$ETC - Bounce from 60 period SMA on the 4 hour chart - LONGA simple idea along the lines of my last couple if you've seen, we've had a large expansion when ethereum classic started to get a lot of attention surrounding the merge narrative and mining moving over, a range was set on the break down from that rally and price has managed to break out and is currently come back down to retest it, also lining up with a bounce from the 20 period SMA which I like.
this is a good level to buy imo and i think we go to at least 40.6ish which is towards the top of the prior consolidation before breaking down
tldr
buy 37.6
target 40.6
stop 36ish (below a prior wick and 20 period SMA)
follow me on the tweeter :)
Sma

$BTC finally overtaking the 60day simple moving averageOK time to dust off the old TV account again!
$BTC has moved above the 60 day simple moving average and historically when this happens after a period of consolidation, BTC will trend for at least a couple of weeks with the 60 day mean price offering a good spot to rebuy in the result of a pull back.
I expect some headwinds obviously at the 28k-29k level for the obvious reason of being a zone of major bounces in the past, so would probably be looking to take profits there and rebuy the retest of the 60day SMA.
If this idea is to fail i have a stop below the wick of the prior thrust candle and below the 60 day SMA around 20.4k
tldr
Initial Target 29k
Stop 20.4k
using the 60 day SMA as a guide to buy pull backs or to get out if it gives way
Sign up to the best exchange FTX right here
and help a brother out 👇👇
ftx.com

DOT above support#DOT/USDT
$DOT is above the trend line that is the same as the support zone.
🐻 price may have more drop in the short term to touch the support zone where meets curved support.
break down from this support will drop the price to descending trend line (green).
🐮 holding above the support zone can bring back bulls in play and attempt to break out descending trend line to reach the next trend line above.

BTC 1970 and 1420 Daily Simple Moving Averages Are Your Friend1420 Daily SMA - This is basically the 200 Week Simple Moving Average. It’s held pretty consistently throughout BTC’s history and only been violated twice since 2015. Once during the Covid market meltdown of 2020, and once during the 3AC meltdown of 2022. These two violations have held at around the 1970 daily SMA
1970 Daily SMA - This was formed on March 13, 2020 during the Covid market crash. It also marked the local bottom of the crash on 2022, which bottomed on June 18, 2022.
During future market crashes, one should start buying with size near these two levels. This will provide you with excellent market positioning for future bull markets.

Analysis on the ES Futures chart on the Weekly Time FrameI am trying in this analysis to figure out the price movement of the ES futures in the coming months
Using the Bollinger Band as a simple tool to analyse I am basing this analysis on previous price action
and its relevance to the current place of price on the chart. We are revisiting the 20 WSMA and a significant
supply zone on the price front. We could see some resistance on the strong up move that we have seen in the
last 2 to 3 weeks and the rally may be coming to a climax in this cycle.
We should wait for the confirmation signals before we begin to trade on this analysis and commit our capital
only once the price action gives us the desired moves. I am not a registered financial advisor and just releasing
this idea as a piece of educational information on how price analysis can lead to action that can help us profit
from engagement with the market.
Please opine on this analysis and comment your views

Nasdaq Futures Price Action analysis for the coming monthsAm basing my analysis on the weekly chart using the Bollinger Bands which is the most simple tool to understand
In my analysis, the price action has brought us to a point on the weekly where we are bound to face resistance
around the middle line of the BB - which is the 20 SMA in our case the 20 WSMA. The prices have reversed from
a similar area twice before and also as a concurrence these areas have been near previous areas of interest where
either price has broken out or reversed from acting as resistance and support points at different times.
The prices may give us confirmation signals if they close below the 13000 levels in the current week or next one
from where one can aim to take a short which can take us down to the 11000 levels.
I am not a registered financial advisor and the release is just an expression for educational purposes. Using futures
as a trading instrument is risky and should be done only under proper guidance and with proper risk management.
Please comment on the analysis and contribute with your ideas on the subject

EurGbp Chance To Test 0.83 Level AgainFrom the trend chanel, macd and sma 50, eurgbp is indicating to retest 0.83 level again. So in my humble opinion I am going to sell.
Stop ABOVE the horizontal redline.
Trade well and wisely. 🙏🙏🙏

Ethereum at the Gates!We see that we have reached the end of the ascending channel in Ethereum , and if this ascending channel is broken down, it seems inevitable that the price level of $775, which is just fib support, will come.
We clearly observe the interaction of 3 separate support and resistance levels with the price.
As long as the vitally important 3rd level is not broken upwards, the channel structure we are in is suitable to be broken downwards.
In addition, the 50-day simple moving average acts as a resistance element for us.

Dailiy EMA 30 Rejection Phases for BitcoinAs can be seen, when we examine the rejections associated with the 30-day exponential moving average in two separate channels, it is expected that the price moving in the falling channels will break the falling trend after the 4th phase.
However, it is useful to be careful and not to enter a position without using stoploss, especially in margin transactions.

Expressive Subjective Predictions About BTCThere is currently an ascending channel and two different symmetrical triangle formations that we are in at the same time.
Although the support zone and trend for the lower band seem to hold the price tight, if the fundamental data creates a selling pressure, the targets of the relevant formation formations seem clear.
On the 4-hour timeframe, the 200-hour exponential moving average is clearly acting as resistance. Also, the Stochastic Relative Strength Index is likely to exert negative pressure.

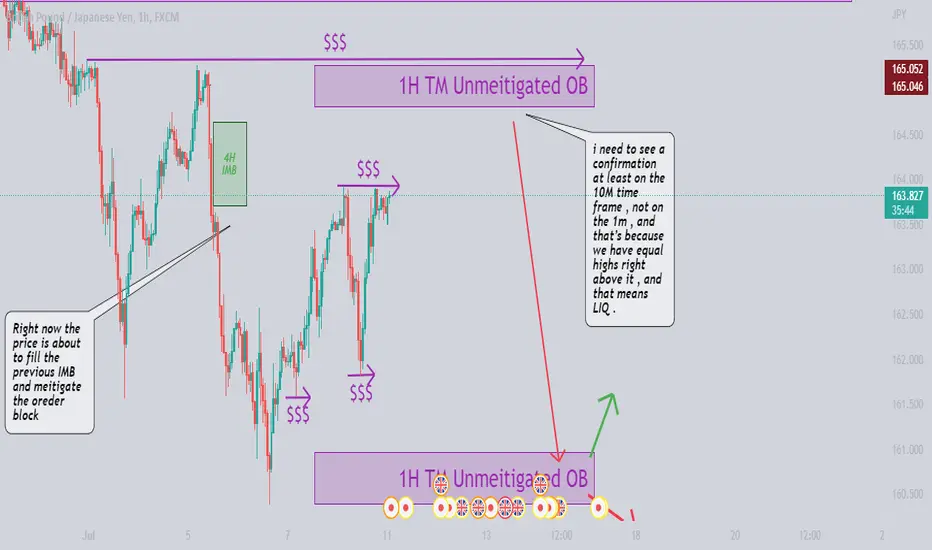
GBPJPY setup Hi everyone ,, this is my set for GJ this week ,,
everything eplained on the chart along with a simple forecast ,,
if you like the idea give it a thumbes up , and follow for more ,,
TRADE SAFELE.
Further decline or range trend?Hello to all members of TradingView and my followers.
As you can see, Bitcoin is currently trading at the bottom of the $19,632 range (which is also resistance).
Even though the 100-hour simple moving average is at the $20,000 level, Bitcoin's efforts to break above the $19,632 level have been unsuccessful.
In general, Bitcoin's movement is under its downward trend line.
In the previous hours, we saw that the price of Bitcoin reached $18,800.
There are two major resistances to Bitcoin right now. The first is the $19,632 level, and the second is the 100-hour simple moving average line I mentioned.
Of course, the downward trend line is also considered a resistance.
As you can see, the green histograms formed on MACD; are tied to the buy signal on the chart. Although the indicator displayed a buy signal, buyers still struggled in the market.
Bollinger Bands portray the price volatility of the asset.
Until the powerful $18,700 support range is broken to the downside, Bitcoin can fluctuate between this range and the $19,800 resistance.
If it breaks, the situation will be different, and the movement towards $17,500 will start.
If it is helpful to you, please like it. If you have a comment, I'll be happy to know. Respectfully.

Ethereum ETHUSDT - Millennium Elliott Wave + 200 weekly MA!- As per my Elliott Wave analysis on the weekly scale, we have 2 impuls waves successfully completed and now we are missing the final impulse wave!
- ABC correction (Wave 4) can be done, because wave 4 should not overlap the first wave.
- 200 weekly moving average is currently acting as a very strong support!
- Also the price is currently sitting on 0.786 fibonacci retracement.
- If you take a look at RSI indicator, you can spot a bearish divergence from previous waves, which helps us to identify the Elliott wave structure.
- Looks like the bear market can be over and we are ready for another massive bull market!
- Check my related analysis for Bitcoin down below!

BTC to $18.500 Again at Micro TrendWhile our journey continues in a long falling channel, you can profit with the micro uptrend breakouts that are forming.

BTC has reached the correction dip at SMA 200WWe have a horrible day when BTC drops more than 10% and hits SMA 200W ~ $22.5K
I hope that SMA 200W will support the BTC price line now and we are at the bottom of crypto winter.

BTCUSD WEEKLY FIBONACCI TARGETSBitcoin weekly Fibonacci targets shows that this bear market is just a correction for next bull market which targets to 136k

Bitcoin Macro Outlook (Regression, SMA)Long-term price analysis using Log regression bands, 50-Month SMA, 300 Week SMA, and 10 year Fibonacci levels

SMA, EMA & Bollinger Bands on S&P500Current Price = 4072.17
💲EMA 20 = 4048.62 (below CP, Buy territory)
💲SMA 20 = 4022.81 (below CP, Buy territory)
💲SMA 50 = 4249.27 (above CP, Sell territory)
💲SMA 200 = 4450.25 (above CP, Sell territory)
💲Bollinger Bands = Middle Band SMA 20, 2 SD (4022.81) (below CP, Buy territory); Overbaught (4196.95); Oversold (3848.68);
🚀 Overall sentiment =
1. Go Long for short term trading,
2. Go Short for intermediate and long term.
Potential Gain
= 9.28% + 4.35% + 1.74%
= 15.37 %
Potential Loss
= -5.49 %

Quick Ideas Chart Patterns on MaybankQuick Ideas Chart Patterns on Maybank
Flags signals. price to surge up.
SMA 20, 50, 200 below prices signal a strong buy

Strength on Krispy Kreme $DNUT has seen very good signs of strength from the support of the 20SMA. Also you’ll notice that the RSI Is holding above the 14SMA while it sits on top of the 50RSI. With this being a newer stock on the market and many years in business. We could see the company making expansive moves to catch the eyes of investors moving forward.
I see a lot of potential in the company to keep growing into something more than just donut shops and store products.

50RSI 20SMA Today a 30% move was made to the 20MA. It also crossed over the 50RSI making the setup very bullish for tomorrow 5/26/2022

Is the SPY carving out a bottom? A Bollinger and MA study. In this video I discuss the importance of the 3rd standard deviation from the 50 SMA on the SPY, QQQ, and NDX. Details in video.
TLDR:
The SPY has found itself at extremes: The Stochastic, the ATR, and the 3rd standard deviation (lower Bollinger Band) on the weekly timeframe all show this.
Pull up the weekly SPY, add the Bollinger Band - go to settings: change the period to 50 and the stnddv to 3, add ATR, add Stochastic, add the 50 SMA - these will paint a picture of the extremes
Study the corrections vs the crashes, 00', 08', 18', 20', 22' - ask yourself: is this a correction or a crash?
Consider the extremes and consider the history of corrections/crashes and how they uses these extremes.
I have heard this argument A LOT last week: " The NASDAQ and IWM are already at -30%.....if the SPY is to go lower that means the NASDAQ may go to -45% and THIS is not possible."
---> I beg to differ, but recognize the importance of the Bollinger bounce. Look at the dot com bubble and the housing market crash, extremes can be used as a trend line for extended periods.
Remember, nothing goes straight down or up, there is always trending days/periods and range days/periods. It is best to be able to quickly identify which type of day/period you are trading in in order to ultimately use your indicators correctly.
Although I remain in the bear camp, I am absolutely open to the idea of a huge massive bounce here before the 200 SMA is tested. This bounce may come with a test of the 50 SMA in the 440's - where is goes from there I am not yet ready to speculate on. Since though I am remaining bearish, I do see a higher probability of the 200 SMA being tested before the real rally to the 50 begins. Either way, I do expect a rally in the near term, news and catalysts aside.
Please watch the video for a more detailed look, and please chart this out yourself to draw your own conclusions.....as these are ONLY my opinions and NOT financial advise.

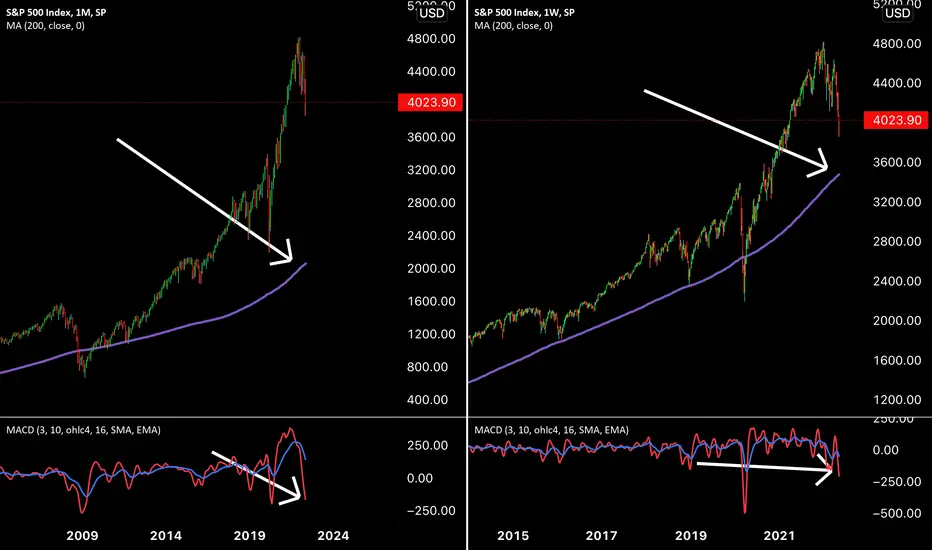
Although Oversold, Most Major Market Selloffs Test the 200 SMA.Since1982, most market sell-offs approach, or briefly plunge, under the monthly and weekly 200 SMA.