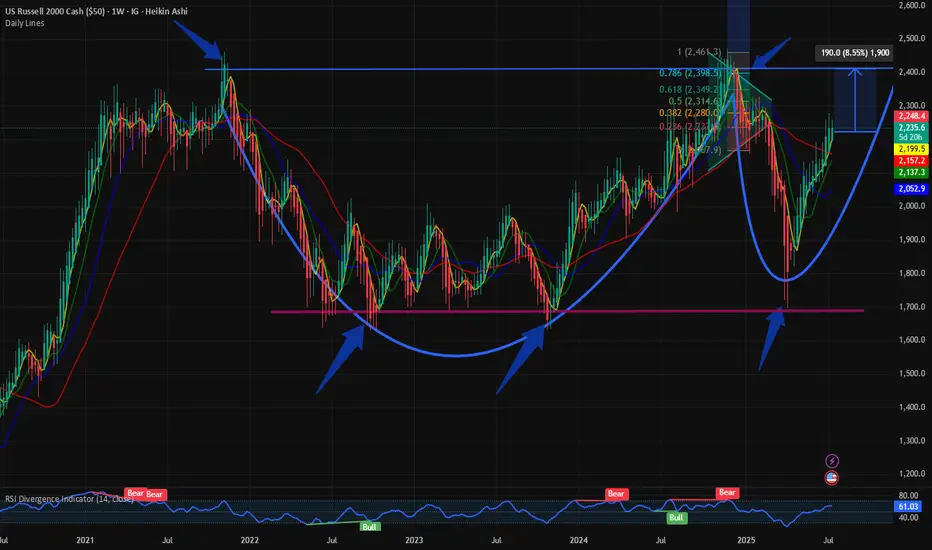
$RUSSEL: Completion of Cup and Handle formation or higher?The small cap index $RUSSEL has had a good past couple of months and has bounced back from its lows. We visited the small cap index on May 1st when we identified the trend reversal. The $RUSSEL was in the recovery mode after the Liberation Day capitulation.
IG:RUSSELL in a bounce back mode. But upside is capped @ 2400 for IG:RUSSELL by RabishankarBiswal — TradingView
This cup and handle pattern is still on hold, and I also predicted that the upside is capped @ 2400. Currently the $RUSSEL is @ 2222.
So how much upside can we expect from here with TVC:DXY making new lows? My assumption is that $RUSSEL will fail to break above 2400, and the handle part will not break out of the reverse neckline. So, the upside in the small caps is capped @ 2400 which seems to be a major resistance indicating a 9% upside from here.
Verdict : $RUSSEL Cup and handle pattern nearing completion. 2400 is the upper resistance. Still some more room to run.
Smallcaps
$IWM is set for a Blow-Off Top - 34% UpsdieAMEX:IWM is about to have a blow-off top moment!
Catch up mode engaged...
- Breakout of downward trend
- Volume shelf launch
- Rate cuts inbound
- Suppressed for 4 years
PTs: $244/ 259/ 276 (MM)

$VKTX Gann VKTX has a beautiful symmetry. Ones it breaks the next arc, it will gravitate to the next one!

what is underperforming? Personally, I think small caps are where we should be looking for opportunities.
We see the people telling you 5-15% easy silver will pump before maybe something happens. Gold is in the same spot IMO. they want you to buy the sucker rally before the dump(As they build short positions).
I will be looking to buy some silver in a year or two when the divergencies look correct to me.
NOT FINANCIAL ADVICE!!

$IWM, small caps, not YET giving the "all clear"AMEX:IWM is the lone index still not in the clear 🚩 — backtesting its 200dma today and tagging the weekly mid-BB , just like in '22. Will it matter by week's end? If not, the bull is likely back across the board 🐂
This week's #CPI (Consumer Price Index) and #PPI (Producer Price Index) prints could significantly influence market direction across major indices — AMEX:SPY , NASDAQ:QQQ and AMEX:IWM — especially with rate cut expectations in flux. 🧵Here's how:
1. Hot CPI or PPI (above expectations):
AMEX:SPY : Likely to pull back as sticky inflation pressures broader S&P names, especially rate-sensitive sectors like real estate and utilities.
NASDAQ:QQQ : Could see sharper downside—tech stocks (many of which are high duration assets) are highly sensitive to interest rate expectations.
AMEX:IWM : Likely the hardest hit. Small caps suffer from tighter financial conditions and depend more on domestic borrowing costs.
🟥 Result: Bearish across the board, with small caps underperforming.
2. Cool CPI or PPI (below expectations):
AMEX:SPY : Broad lift, particularly in consumer discretionary and financials.
NASDAQ:QQQ : Strong rally—mega cap tech loves the prospect of lower yields.
AMEX:IWM : Outperforms if cooling inflation suggests easing ahead, since it's more leveraged to rate cycles and domestic growth.
🟩 Result: Bullish, with small caps possibly leading a relief rally.
3. In-line CPI/PPI :
Markets may stay choppy or consolidate, with AMEX:SPY and NASDAQ:QQQ more stable.
AMEX:IWM remains at risk of drifting lower unless there’s a strong dovish narrative from the Fed or other macro catalysts.
With small caps already lagging, this week’s inflation data could either validate its bearish divergence or spark a rotation rally if inflation
AMEX:SPY NASDAQ:QQQ TVC:VIX $ES_F $NQ_F $RTY_F TVC:TNX NASDAQ:TLT TVC:DXY #Tariffs #Stocks

ASST: Trade write-up / 07 MayDaily Time-Frame Context
1h Chart
ASST gapped up over 300% pre-market on news of transitioning to a crypto holding company (a strong hype theme).
Despite being in a long-term downtrend, ASST had a history of prior gap-ups in 2023–2025.
Highest daily trading volume (HDW) ever recorded, with 80M shares traded pre-market.
Low short interest (0.5 days) and a relatively small float of 10.9M.
5-Min Time-Frame Analysis
Pre-Market Action:
Gap-up to Jan’25 highs, followed by shallow consolidation to the rising 8 EMA and VWAP (1h 8 EMA)
Opening Price Action:
Price posted a failed breakdown setup, finding support at VWAP, Jan’25 highs, and the pre-market base.
Selling volume remained low, while reversal volume showed substantial buying interest, with most bars closing at the highs.
MACD signaled bearish posture during this reversal, hinting at potential upcoming consolidation.
Mid-Day Movement
Price reached a mid-day top with increased selling volume, reduced buying, bearish MACD, and flattening short-term EMAs.
Pullback Phase
Price pulled back for 4 hours to early morning support (Jan’25 highs, pre-market top, morning reversal), with gradually decreasing volume, indicating drying-up selling interest.
Pullback had a textbook three-wave structure with ideal Fibonacci proportions.
Consolidation and Breakout
Established a solid consolidation at the key support zone, featuring:
Several shake-outs
Buying volume dominating selling
Sequance of higher lows formation
Inside bars prior to breakout
MACD turning bullish
Possible Entries
Aggressive Entry:
Failed breakdown and V-shaped reversal with an 11% stop at LOD.
Ideal Entry/Aggressive add-on:
After the shake-out/inside bars sequence on low volume, breakout confirmed by bullish convergence of EMAs and VWAP. Full stop could be placed bellow higher low.
Active Uptrend Phase
Price respected the 8 EMA during the active advance phase, pausing only during halts.
(!) Gradually increasing buying volume without a sudden spike - a sign of steady buying rather than stop-loss coverage.
Noticeably lower selling volume compared to buying volume.
Price approached the next significant daily resistance zone at Jan’24 highs - a potential profit-trimming target.
Swing-Trading Thesis
Strong crypto-related hype (becoming a crypto holding company).
Crypto sector showing relative strength since the market top and recovery phase.
Price maintained above key short-term moving averages into the close and post-market, supporting the bullish case.
Bitcoin pullback and altcoin breakout setups further enhance the thesis.

Levels where to short $MLGO Do not short on ssr + microfloat + high volume
These are my key levels on chart where I want to short
Nothing more.

$OBLG #OBLG BUY ALERT FOAT IS LOCKED, $17.6+ then $60+ INCOMING!NASDAQ:OBLG #OBLG NASDAQ:OBLG My name is Landon Wogalter & this is the next NYSE:GME #GME NYSE:GME / NYSE:HKD #HKD NYSE:HKD type move, I am also the reason that NASDAQ:CHSN #CHSN NASDAQ:CHSN went to $44 that I called & locked the float from <1.80 & called for $30+, & even emailed the company in August 24’ stating that their stock would see $30+.
Oblong price targets are as follows:
17.6+ , 60+, 150+, 2900 past 404< #FLOAT IS #LOCKED THERE IS NO OTHER SET UPS LIKE THIS ON THE MARKET AND NEVER HAS BEEN. #ZERO #DEBT OBLG wants #parabolic (This is not promotion nor/or financial advice😘) I’m your daddy forever & ever.

US2000 Small Caps DANGER!Fully formed rising channel ready to collapse.
-Where do I begin with this chart? Wave 3 up ending.
-Multiple Double Top (Daily time frame and 4 hour.)
-Head and Shoulders
-Multiple CRACKS already in place.
-Consolidation at the bottom of the structure
All screaming DANGER to bulls!!

Small Cap Reversal patternAs rates persist higher as FED lowers rates, small-cap companies with limited pricing power, and high debt, needing to roll over debt are in trouble.
The chart is showing a CRACK!

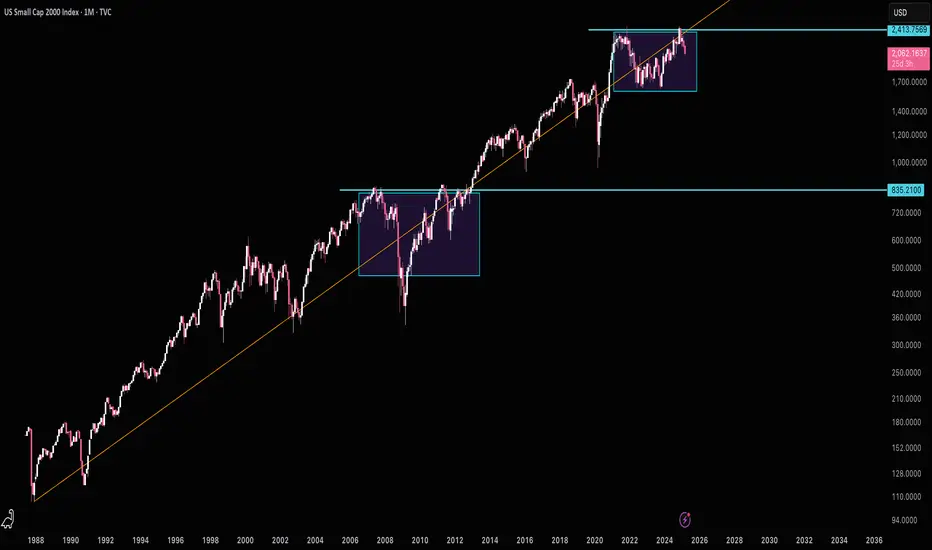
Russell 2000 Very UndervaluedJust wanted to share this to help people keep calm during this tariff everything sell off. Small caps have been crushed well below their longterm trend. I'd suggest holding on for the rebound above resistance.
The IWM is sitting at critical support!!!On Friday, the IWM broke through a multi year support line (beige) and closed below a multi year parallel channel. Thankfully, it found support at its 200 day MA. If the IWM cannot recapture the inside of the parallel channel this week and confirms a close below the 200 day MA - watch out below. This should be on every one’s watch list this week because where the small caps go - every other risk asset will follow!!!

Crypto Miner CLSK longterm patternBullish "march" if all factors hold true?
ie NVDA look weak-ish.
Falling yields would be nice.
Trump told his crypto team to investigate BTC reserve question within 100 days. That's now around April.
www.investing.com Markets pricing 1st rate cut around June.
Look into longterm macd potential.

IREN becoming Irensistible?! 93% UpsideNASDAQ:IREN
Cup&Handle forming here and up-trending towards a potential breakout! This could lead to a massive move to $31 over a longer period of time.
H5_L is red and should flip to green if we get a B/O
Not financial advice.

NVTS - 300% Move back on the table!💾 NASDAQ:NVTS Trade Alert! 💾
Locked & Reloaded 🔫
▫️ Falling Wedge B/O
▫️ Green H5 Indicator
▫️ Volume Shelf
▫️ BULLISH WCB
▫️ Above 9ema & Smoothing Line
🎯 $4.65
🎯 $6.00
🎯 $7.62
🎯 $11.17
🎯 $12
Not financial advice!

RUSSELL 2000 at 200 day SMA#TGIF. A simple chart to end the week. The US Small Cap index Russel 2000 its just hovering above its 200 Day SMA on the daily chart. Every time this happened in the last 1 year it was a bullish indicator in a medium term. The 50- and 100-Day SMA are below the 20 Day SMA which is a short term bearish indicator.

NVTS TRADE UPDATE - Massive upside potential...STILL!NASDAQ:NVTS UPDATE 💾
The H5 Trade is still intact...for now. We are at an inflection point in the markets and although I believe we get a big bounce higher soon nothing is concrete.
If we do get a bounce and what I believe will be a blow off top in this bull market then this name base on the setup will do very well to start blasting through these profit targets.
- H5 indicator is green
- At volume shelf
- Higher low
- Already successfully retested falling wedge breakout area.
- Broke out of downtrend
-Volume gap to fill
-WCB is formed and thriving
When companies break out and successfully retest it is common for them to consolidate above the breakout area to create new support before continuing higher
Don't make buy/ sell decisions based solely off price action, have a strategy and follow it so you don't get burned up in the massive swings...especially on volatile stocks. This name has given me 70% gains off the initial breakout and after we loaded back up off the retest.
Not exiting this name unless my strategy indicates a correction or crash in the markets is upon us or my strategy tells me to exit this name (Red H5 Indicator/ Break of support on WCB).
NOT FINANCIAL ADVICE

$NVTS - A Free 140% anyone?NASDAQ:NVTS
A free H5 Trade that ran 70% on the breakout and again after the pullback to retest said breakout!
That's 140% in gains in ONE MONTH!!!! 😘
We call that a DOUBLE TROUBLE Target Smash!!!
$4.65 🎯🎯🏹🏹
Not financial advice

MBLY above $20Has been holding despite of weakness all across the board.
A hourly close above $20 is an entry for me, with target at 23.50

$NVTS Ready to Soar! 200% UPSIDECHARTURDAY - NASDAQ:NVTS
ALL SYSTEMS GO!
-H5 Indicator is GREEN
-Broke out and successfully retested falling wedge and downtrend
-Volume shelf with GAP
-Weekly Hammer candle
-Williams CB thriving
A break over recent highs is VERY BULLISH!
🎯$6🎯$7.62 🎯$11
Not financial advice

Psychedelic Stocks About to Trip! 100%+ UpsidesPsychedelic Stocks About to Trip! 🍄
RFK Jr. has been named the top health official in Trump's administration, and he's known for his stance against big pharma and preference for natural products like psychedelics. This could be a game-changer for psychedelic stocks!
In this video analysis, I dive deep into the potential impact RFK Jr. could have on key psychedelic stocks: AMEX:CYBN , NASDAQ:CMPS , NASDAQ:ATAI , and $MNMD.
These stocks are poised for significant movement, and you won't want to miss out on the insights and strategies I share. Not financial advice. 👇

GNS - A double up?AMEX:GNS just announced they were upping their Bitcoin treasury. This piece of news could be a nice catalyst for some upward movement.
Chart looks bottomed out on the monthly and weekly. Looking for a bullish fair value gap (FVG) to be created on the weekly chart.
Mapped out my trade on the 1D timeframe.
-Bullish FVG was created on the daily and tested
-nice hammer off the FVG
-has some work to do to get through those bearish FVGs on the daily.
Targeting $1.50 and $1.70.
Going to buy a few hundred shares and let this play out.

POET is writing a POEM! 86% UPSIDEPOET TECHNOLOGIES - NASDAQ:POET 🧠
-H5 Indicator's GREEN
-Cup&Handle close to B/O
-Broke out of downtrend
-Massive Volume Shelf w/free space
-Bullish Wr%
✅ H5 Trade on BREAKOUT!
Entry: $6.01
Stop-Loss: $4.08
Risk/Reward: 2.51
🎯 $7.75 🎯 $11
Not financial advice
