Gold at a Crossroads: $100 Drop Ahead or New All-Time High?Gold is now sitting at a critical decision zone near the $3300 level — a key bank-level area. If we see a daily candle close below this level, I anticipate a minimum drop of 1,000 pips, with the first major support around the $3220–$3200 range. The $3200 level is extremely significant, and I’ll discuss its importance more in future updates if necessary.
On the flip side, if buyers step in and we get a daily close above $3300, I still believe it’s too early to jump into longs. The selling pressure remains quite obvious, and we’ve already seen multiple failed attempts to push beyond this level toward the $3500 all-time high. That tells me the orders at this level might be exhausted.
Personally, I’ll only consider a long position if we get at least a clean 4-hour candle close above $3350.
It’s going to be an exciting week ahead with high-impact data releases including ADP, Core PCE, the Federal Funds Rate — and most importantly, Friday’s NFP.
📌 Stay tuned for updates throughout the week!
Disclaimer: This is not financial advice. Just my personal opinion!!!
Smart-money

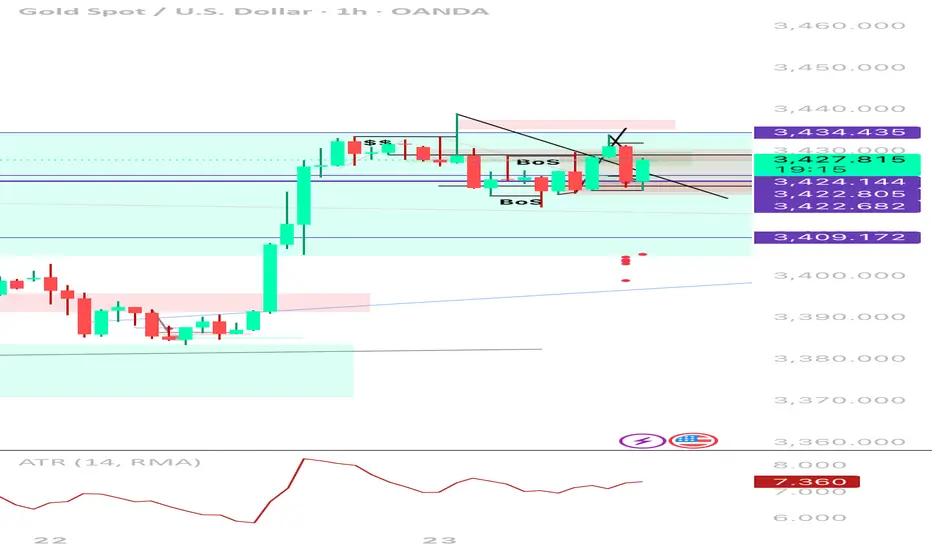
XAUUSD 1H | Sell TP Hit → Now Flipping Long After Liquidity SweeSmart Money Buy Setup | 1H Execution | Reversal from Demand Zone
Just hit full TP (396 pts) on a clean short from 3,434. Now flipping bias to long after price tapped into a key 4H OB and demand zone near 3,422. Price swept downside liquidity, mitigated the imbalance, and is now showing bullish intent.
⸻
🔄 Trade Narrative:
• ✅ Sell-side liquidity swept below previous HLs
• 🧱 Price tapped into 4H Order Block + FVG zone
• 💧 Internal liquidity vacuum filled (3,422–3,409)
• 🔁 Potential 1H BOS to the upside forming
• 🕯️ Bullish wick reaction from demand = early entry signal
• 📉 ATR low + building pressure = potential expansion incoming (likely NY)
Buy plan:
Entry Zone
3,422–3,424 (with confirmation on BOS)
Stop Loss
Below 3,409
TP1
3,434.435 (prior supply tap)
TP2
3,439.210 (range high)
TP3
3,455–3,460 (weekly extension target)
📌 Why I’m Flipping:
Price didn’t just reject randomly — it reacted exactly where smart money would’ve wanted to rebalance after the previous long impulse. This is the textbook scenario where you don’t marry a bias — just follow liquidity and structure.
🧠 Key Lessons:
• Don’t force continuation when the market is clearly absorbing
• Liquidity grabs often lead to strong reversals — watch BOS to confirm
• Same zone that gave you your TP? Can give you your next entry 💡
🔖 Tags:
#XAUUSD #SmartMoney #LiquiditySweep #OrderBlock #BreakOfStructure #BuySetup #PriceAction #1HChart #GoldTrading
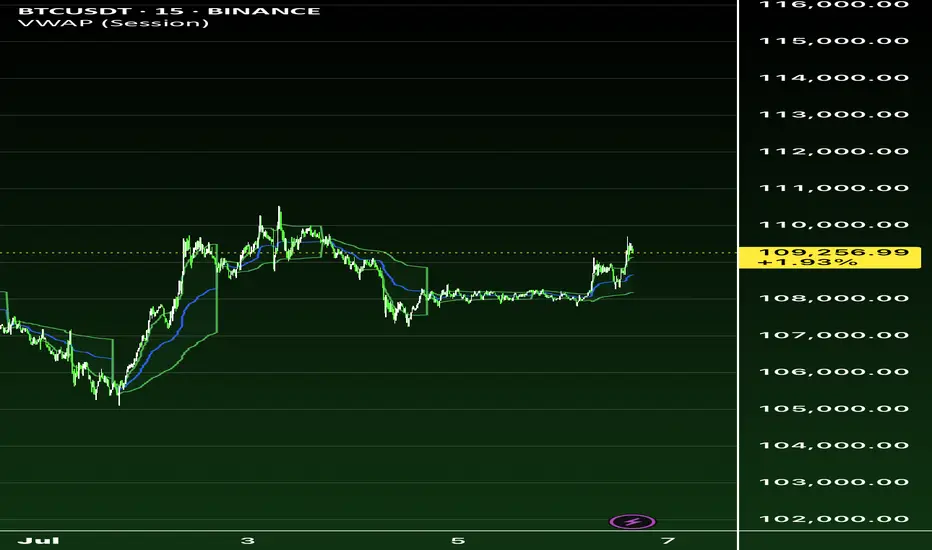
BTC Smart money Bullish don’t be fooled !**BITCOIN MICROSTRUCTURE ANALYSIS: Institutional Accumulation Through Order Flow Divergence**
The current BTCUSD market structure presents a compelling case study in institutional accumulation mechanics, utilizing sophisticated order flow analysis to identify smart money positioning ahead of retail market participants.
**Technical Infrastructure Analysis**
The convergence of multiple analytical frameworks reveals a coordinated accumulation pattern across various timeframes and exchanges. Volume Profile Analysis on the primary chart indicates substantial institutional interest between $108,000-$110,000, with the Point of Control (POC) establishing a robust foundation for directional bias determination.
**Order Flow Microstructure Dynamics**
The Bitfinex footprint data reveals critical microstructural imbalances that traditional technical analysis often overlooks. The current candle displays a **-4.52 delta** with price resilience at $109,480, indicating aggressive institutional absorption of retail selling pressure. This negative delta combined with price strength represents a classic **Wyckoff accumulation signature** - large participants are utilizing iceberg orders and hidden liquidity pools to build positions without triggering algorithmic momentum systems.
**Smart Money Positioning Mechanics**
Three key indicators confirm institutional accumulation:
1. **Cumulative Volume Delta (CVD) Divergence**: Both spot and perpetual markets showing negative CVD (-95.77K spot, -50.05K perp) while price maintains elevation, indicating off-exchange accumulation through dark pools and cross-trading networks.
1. **Open Interest Expansion**: The increase from 77.89K to 78.75K contracts with minimal funding rate pressure suggests fresh institutional capital rather than retail speculation.
1. **Volume Profile Concentration**: The heatmap reveals 105.85M in trading volume concentrated within the $108K-$110K range, representing systematic accumulation rather than random market activity.
**Institutional Arbitrage Mechanics**
The funding rate dynamics (0.001783 with periodic negative spikes to -0.000753) indicate sophisticated carry trade positioning. Institutions are likely utilizing the negative funding periods to establish leveraged long positions while simultaneously hedging through spot accumulation, creating a self-reinforcing feedback loop.
**Market Microstructure Implications**
This accumulation pattern typically precedes **Phase C markup** in Wyckoff methodology, where institutional players transition from absorption to active price discovery. The thin volume profile above $112,000 suggests minimal resistance once the breakout occurs, creating conditions for rapid price expansion toward the $113,600 target.
**Risk-Adjusted Positioning Strategy**
The confluence of volume profile analysis, order flow dynamics, and institutional positioning indicators supports a high-probability long bias with the following parameters:
- **Entry Zone**: $109,000-$109,200 (current accumulation range)
- **Risk Management**: Stop loss at $108,200 (below institutional POC)
- **Target Sequence**: $110,653 → $112,000 → $113,600
- **Confidence Level**: 90% (upgraded from initial 75% based on footprint confirmation)
**Forward-Looking Market Structure**
The sophisticated nature of this accumulation pattern suggests institutional preparation for a significant directional move. The combination of hidden liquidity absorption, funding rate arbitrage, and volume profile concentration creates optimal conditions for sustained upward momentum once the $110,000 psychological resistance is cleared.
This analysis exemplifies how advanced order flow techniques can provide substantial informational advantages over traditional technical analysis, particularly in identifying institutional positioning ahead of retail market recognition.
*Position sizing should remain within 3-5% of total portfolio allocation, with dynamic risk management protocols adjusted based on evolving market microstructure conditions.*
Internal and external liquidity Here's another mechanical lesson for you.
In my last post I covered a mechanical technique to identify swing ranges. Rule-based, simple and repeatable.
In this post, I want to share another little technique, again part of the mechanical series. But this time I want to talk about liquidity.
Most traders talk about liquidity, they might even have a grasp of what it is. But most do not know how liquidity forms the sentiment and how that creates a type of algo for the market.
You might have heard of Elliott wave theory. There is a saying along the lines of "you ask 10 Elliott traders for their count and you get 11 answers".
But the point is here, when you simplify the concept, it's clear to see that sentiment caused by liquidity swings is what causes a repeatable pattern in the market.
Let's take the idea of the ranges from my last post.
Now after a fair amount of accumulation, this level becomes "defended" - the price will gradually move up until old short stop losses are tagged and new long entries are entered into.
This allows the institutional players to open up their orders without setting off the alarm bells.
Price then comes back from external liquidity to find internal liquidity (more on this in a later post).
But then it looks for the next fresh highs.
As the highs are put in, we can use the range technique to move our range to the new area as seen in the image above.
Next we will be looking for an internal move, not just internal to the range, but a fractal move on the smaller timeframe that drives the pullback down. See this in blue.
The logic here is simple; on the smaller timeframes we have witnessed an accumulation at the 2 region and as we spike up for 3; we will witness a distribution on the smaller timeframes.
Wyckoff called this the accumulation, followed by a mark-up and then the distribution and a mark-down.
It is this pattern, over and over again that leads to this type of structure.
This will then be re-branded by various analysts who will call it things like a head and shoulders, smart money will see a change of character and a retest before breaking the structure.
This is all the same thing - just a different naming convention.
Again, I hope this helps some of you out there!
Disclaimer
This idea does not constitute as financial advice. It is for educational purposes only, our principal trader has over 25 years' experience in stocks, ETF's, and Forex. Hence each trade setup might have different hold times, entry or exit conditions, and will vary from the post/idea shared here. You can use the information from this post to make your own trading plan for the instrument discussed. Trading carries a risk; a high percentage of retail traders lose money. Please keep this in mind when entering any trade. Stay safe.

BTCUSDT Fresh Short Setup: Targeting Key Support Zones with SMC Description:
This trade setup presents a Bitcoin short opportunity on the 4H timeframe using the Smart Money Concepts (SMC) framework. After a significant reaction from the supply zone, Bitcoin's price structure aligns with bearish confluences, signaling potential downside. Additionally, external events, such as the recent announcement of China's AI application "DeepSeek," may have amplified market volatility, further supporting the setup.
Trade Setup:
Entry:
Between 103,300 and 104,500
Take-Profit Levels (TP):
101,897
99,825
97,565
95,208
Stop Loss (SL):
Above 105,975
Analysis and Confluences:
Market Structure:
Bitcoin remains in a bearish trend on the 4H timeframe, with consistent lower highs and lower lows.
Supply Zone:
The price is entering the 103.3k–104.5k supply zone, a key resistance area where sellers are expected to dominate.
Fibonacci Confluence:
This zone overlaps with the 0.618–0.786 Fibonacci retracement levels, a high-probability reversal area.
Liquidity Sweeps:
Liquidity above previous highs has been swept, leaving the path clear for potential downside.
Bearish Targets:
The targets align with previous demand zones and liquidity pools at 101,897, 99,825, 97,565, and 95,208.
Trade Plan:
Confirmation: Wait for bearish price action signals or smaller timeframe BOS (Break of Structure) within the supply zone before entering.
Risk Management: Adjust position size to keep risk within acceptable levels. After reaching TP1, move your stop loss to breakeven and secure partial profits.
Final Note: While bearish bias dominates, unexpected macroeconomic events can cause reversals, so use tight risk management.

BTCUSD | 1D SMC Short Setup with Refined SL and TargetsDescription:
This analysis identifies a high-probability short opportunity for BTCUSD on the 1D timeframe using the Smart Money Concepts (SMC) framework. The chart shows clear bearish confluences, including market structure, supply zones, liquidity levels, and Fibonacci retracement zones. I believe the current bullish momentum is merely a manipulation driven by inflation news and the upcoming Trump inauguration. Following these events, I anticipate a significant market correction. Here’s the detailed breakdown and trade plan:
Analysis:
Market Structure:
Break of Structure (BOS): Price has confirmed a bearish trend with BOS to the downside, signaling a continuation of lower highs and lower lows.
Trendline Resistance: A well-defined downward trendline indicates selling pressure, reinforcing the bearish bias.
Key Zones and Liquidity:
Supply Zone: Highlighted in purple at $102,000-$104,000 . This zone represents an area where strong selling previously occurred, creating an imbalance.
Golden Zone (Fibonacci Retracement): Located around $101,000-$103,000 , this area aligns with the 61.8%-78.6% retracement levels and offers a high-probability reversal opportunity.
Weak High: The high near $104,000 represents untapped liquidity, which smart money may target for a liquidity grab before reversing lower.
Equal Lows (EQL): Around $92,000 , these act as a bearish target where liquidity rests, aligning with the continuation of the bearish trend.
Confluences for Short Entry:
Price is approaching the supply zone and Fibonacci Golden Zone , indicating a potential reversal point.
The weak high may trigger a liquidity grab to entice buyers before sellers regain control.
Previous BOS and trendline resistance add further validation to the bearish bias.
Trade Plan:
Short Entry Setup:
Entry Zone: $102,000-$104,000 (inside the supply zone and Golden Zone).
Stop Loss (SL): $105,500 (above the supply zone and imbalance to account for liquidity grabs).
Take Profit Levels:
TP1: $97,000 – Close partial profits at this imbalance mitigation level.
TP2: $92,000 – Target the equal lows and resting liquidity.
TP3: $88,000 – Final target near the blue demand zone for maximum reward.
Risk-Reward Ratio:
With the entry at $103,000 (midpoint of supply), SL at $105,500, and TP at $92,000, the trade offers a 1:4 RR or better, depending on execution and scaling.
Additional Notes:
Monitor the price action closely as BTC approaches the supply zone for confirmation, such as bearish candlestick patterns or lower timeframe CHoCH (Change of Character).
Scaling into the trade in smaller portions across the supply zone can improve overall entry precision.
Adjust stop loss or take profit levels as market conditions evolve

$BITF - Bottom In?Hello Friends,
For those of you looking to capitalize on NASDAQ:BITF you may want to add to your position, or start accumulating for the first time.
Posting a fresh idea here for NASDAQ:BITF now that the bottom should be in.
Keeping with the Bullish narrative of CRYPTOCAP:BTC we can assume NASDAQ:BITF will once again see another projection higher back to its 2024 ATH (All Time High) of $3.91.
I will post further Exit/ TP objective as we see NASDAQ:BITF move out of its current consolidation.

USDJPY SELL STOPI have a stop loss of a 100 pip in place for my short here, the first target is 1:2,15 RR. My long term short trend is based off of the sentiments or fundamentals. I believe we will be seeing a lot of shorts for the month of January.

$MSTR Time to Buy?Hello Friends,
For those of you looking to capitalize on Microstrategy NASDAQ:MSTR you may want to add to your position, or start accumulating for the first time.
After an impressive move to the upside, we can now feel confident to look for entries after that retracement.
Keeping with the Bullish narrative of CRYPTOCAP:BTC we can assume NASDAQ:MSTR will once again see another projection higher back to its ATH (All Time High) of $543.

$COIN - Update: Buy + TPHello Friends,
For those of you looking to capitalize on NASDAQ:COIN you may want to add to your position, or start accumulating for the first time.
My original post:
UPDATED IDEA:
NASDAQ:COIN moving nice with CRYPTOCAP:BTC in this 2024-2025 Bull Run!
Remember, NASDAQ:COIN basically mimics CRYPTOCAP:BTC so we want to trade them in a similar fashion.
As you can see NASDAQ:COIN is still trading below the $368.90 High & the ATH of $429.54.
I am expecting those levels to be traded to as CRYPTOCAP:BTC continues higher.
The chart showing "Swing Protection TP 1" based on our current swing we left ($283-$149) is giving us a projection of $419.61.
That being said, if you wish to add to your NASDAQ:COIN holdings at ~$318 (or lower), you have upside available to take profits.
Please note: $429.54 ATH is a good objective.
Will NASDAQ:COIN go higher with this bull run? IT all depends on when CRYPTOCAP:BTC tops out - I will update you then or follow along with my CRYPTOCAP:BTC exit strategy...
Check out this link for my BTC Exit Strategy :

NZDUSD 15mThis analysis comes from the new indicator I have coded recently. As shown on the chart, I anticipated a reaction at the red box 5m OB, with a target price at the green box 5m OB.
The reason is that, on the 5-minute chart, the supply zone was converted to a demand zone and broke the recent high. Pay attention: confirmation is required before entering the position.

BTC Under $100k, Where Do I Buy?Hello Friends,
For those of you looking to capitalize on Bitcoin BINANCE:BTCUSD you may want to add to your position, or start accumulating for the first time.
While we are currently in consolidation under $100,000 USD, note the current Dealing Range we are in (chart).
Below that Fib 50% Dealing Range, we can look for Buys.
I also want us to consider the possibility of losing that +OB (Bullish Orderblock), we can expect lower prices - based on Daily/ Weekly chart.
Should that occur - Start looking to accumulate/ Buy sub $86,760.
My ideal entry will be at $85,158.42
Check out this link for my BTC Exit Strategy:

Bitcoin ATH: Potential Retracement Zones and Key LevelsBitcoin current price now is 76k surpassed ATH at 14 March 2024, after surge more than 13% we may see increased speculation and bullish momentum driving the price higher. However, if Bitcoin struggles to maintain upward momentum near this level, we may witness a retracement before the next significant move.
Retracements are a common and healthy part of price movement, providing the opportunity for consolidation before the next leg up. On the chart, we observe several retracement levels marked by Fibonacci retracement levels, as well as Fair Value Gaps (FVGs) that may act as areas of support if Bitcoin's rally takes a breather.
1. The first potential support level sits at the 0.5-0.62 retracement level. This zone represents a modest pullback and would allow Bitcoin to establish a higher base without losing its bullish structure. This level falls within an FVG, which might reinforce the zone as a strong support if Bitcoin pulls back to this area.
2. A deeper retracement could see Bitcoin testing the 0.705-0.79 retracement level. This level could attract more significant buying interest, as it represents a meaningful correction or extreme discount zone that provides an attractive entry point for new buyers.
3. Green zone (OB) signaling areas of potential liquidity where buyers might enter aggressively to capture value.
Trendline Support and Horizontal Levels
Trendlines provide insight into Bitcoin's directional bias. A rising trendline, indicated in yellow on the chart, has been guiding the recent rally and could serve as dynamic support in case of a downturn. If Bitcoin respects this trendline, it would suggest a continuation of the uptrend, with the trendline acting as a safety net for any dips in price. This would allow BTC to pull back and consolidate while maintaining its upward momentum.
Another significant level is marked as "rH" around $73,787, a former resistance level that could now act as support. If Bitcoin retraces to this level and finds support, it could reinforce bullish sentiment and potentially lead to another rally attempt.
Volume Analysis
We also see moderate trading volumes, indicating sustained but cautious buying activity. An increase in volume at higher prices would strengthen the case for a continued rally, as it would demonstrate robust market interest. Conversely, if the volume decreases during a pullback, it may indicate that sellers lack conviction, suggesting that the retracement could be brief and limited to consolidation.

Most important candle for Bitcoin !this weekly candle close is equal by Monthly candle close . ( 4 Days to close )
if price in weekly timeframe close above the 73754 $ then btc would have a good potential to raise up to 83000 $ - 129000$ and 173000 $
But if it falls and close blow the 63146 $ then btc would have a good potential to falls down to 43800 $ - 28000 $ - 15500 $ again .
what you think ? let me know in the comments .

GBPUSD 1h Potential "Short"Hello friends!
I don't actually trade GBPUSD, but I think this can be a good entry if price dares to return sooner.
PNG chart image:

Bullish Dollar Within a Trading Range. TVC:DXY is currently trading in a consolidation pattern and is located in the premium end of the trading range between 104.447 and 103.013.
The August 30 candle swept the short term daily sellside liquidity at 103.013 into the Weekly BISI fair value gap which was nearly totally rebalanced. Upon leaving the Weekly FVG range, it was repriced to the premium end of the range, forming a daily BISI Fair Value Gap.
Sept 4th trading range appears to still be forming a Daily BISI fair value gap in which I expect price to protract into early in the week before either staying in a consolidated range or move higher toward daily and weekly buyside liquidity pools toward the daily Volume Imbalance.
Price points of interest:
D.Volume Imbalance: 105.278 & 105.125
Wk.Buyside Liquidity: 104.700
D.Buyside Liquidity: 104.447
D BISI Fair Value Gap: 104.025 high & 103.740 low
D. BISI Fair Value Gap: 102.771 high & 102.654 low.

UNI/USDT 4H LONG SCALPThe breakdown of the structure in the 4-hour time frame is quite clear, and the price has strongly fallen to the EMA20, the price can first retreat or correct to the 6.137 level, and then we will continue the downward trend, the first target [/il can be the 5.67 point.

Smart Money Concepts swing trading odyssey|Ep.12|8R long|EURUSDBack yet again with the Phase C continuation limit order entry model for swing trading, using ICT's SMC toolkit. This is again being documented as a reference for my future YouTube channel.
This description took too long to write, sorry if price has moved away from where I got tagged in...
So, these Phase C swing trades are proving to be a bane - the last one on Gold went sideways for about 2 weeks leading to me closing it today before inflation news with DXY showing weakness.
Fed sentiment: Hawkish? The bond market says another 0.25% rate hike is likely and I think it has been priced in for a while. US inflation slowly coming down; 5% down to 4% y/y. Month on month it's not improving though and employment is only just starting to maybe drop, meaning room for another interest rate hike to tighten the economy.
Trader sentiment: risk on (inflation easing + stock market rallying)
On the Euro side, employment seems to be going up, and inflation is still too high. A rate hike is practically a given with the ECB having room to do it.
Overall sentiment: The 0.25% rate hike seems to be baked in, and in spite of that, EURUSD continues to form a technical pattern that implies it's going higher. If the Fed doesn't make the expected rate hike, it will likely just accelerate Euro's move up.
I am forecasting a technical move up more than a fundamental one. At LEAST to fill in the weekly FVG - if not breaking the last supply zone creating a new high for the year - but with the Fed expected to hold rates ~5% until possibly 2024 v.s. the pace of Europe's hikes and their stagnant GDP putting a limiter on their hikes, right now I don't see how EURUSD could rally much higher than that (but maybe this is just a lack of understanding on my part?)
Technicals: W pattern formed on daily TF creating new demand zone. SMT divergence with the DXY gives me confidence that market makers won't push price lower during FOMC tomorrow.
Entry: Phase C pullback into discount/50% of 4h swing low/daily bullish OB. As I said above, the SMT divs with Dollar gives me confidence to put my stop below the last 4h swing low despite news tomorrow, which could give an opportunity to scale in with bigger size, providing Euro doesn't just slip 60 pips in the blink of an eye.
Exit/Terminus: mid-point of the gap (volume imbalance) on the weekly TF + old weekly high, which is an 8R trade. I plan to partial at the last supply zone which begins at ~$1.09500.
Confidence: 7.5/10 for directional bias & 6/10 that they won't stop me out during FOMC tomorrow 😋.
Here is the weekly chart. Notice the red box which is the volume imbalance I am using as my Terminus/DOL:

Smart Money Concepts swing trading odyssey|Ep.11|11R short|GoldTesting my own Phase C continuation limit order entry model for swing trading, using ICT's SMC toolkit.
Fed sentiment: Hawkish? bond yields up/possibly more hikes/USD strength
Trader sentiment: risk on? (Nasdaq rally/debt ceiling raise talks/inflation easing?)
Supply/Demand factors: people still in employment and spending money means demand
Overall sentiment: should be bullish if not for hawkish fed and dollar strength
Technicals: Gold overbought/in premium on higher timeframes, double top pattern yet to finish playing out. SMT divergence with Silver
Entry: Phase C pullback into premium of 4h swing high/fair value gap. tightened up stop because swept PDH (prev day high) giving a nice potential 11R return
Exit/terminus: MT of M -OB (50% of monthly bearish order block(Mean Threshhold))
Confidence: 7/10
Weekly chart:
Monthly chart (see order block):

V2.0 | 22R Gold Long Swing Trade | Smart Money Concepts/ICTThis is an updated plan for the macro Cup & Handle breakout
Previous setup for the 30R Gold long didn't play out; the unconfirmed SMT divergence didn't get confirmed and there was no impulsive move away.
The stop loss is larger due to the entry location.
Not financial advice but if this trade idea inspires you, you could use an even bigger stop to avoid potentially getting stopped out by an errant news spike. 22:1 risk reward sounds cooler though doesn't it?
SMT divergence in this setup between Gold & Silver has been confirmed this time; stops were swept on one pair but not on the other, before rallying upwards and creating a higher high on the daily timeframe.
In theory the swing where stops were swept SHOULD hold now.

#DXY index dayly idean 💵💵💵Hello guys I wish you the best.
In my point of view dollar index in the most effectiveness market at all, therefore u need to be aware of it's behavior.
Cheers 🥂

Possible 30R Gold Long - Swing trade - Smart Money Concepts/ICT1. Price has come back to mitigate the 4H +FVG (Fair Value Gap) created on the 4th April, sweeping a PDL (Previous Day's Low) in the process to clean out the stop losses of anyone in early longs from this past week. This is an early entry signal and I have started to scale in with a scalp. (This higher risk trading, and not financial advice!)
2. Price has also retraced to a W +OB (Order Block)
3. We have SMT divergence with Silver, which has not swept the same low; another bullish signal in SMC (Smart Money Concepts) - although it would be better to have the SMT divergence with the previous structure than the current one as this is still unconfirmed (Silver can still make a lower low!)
ENTRY: ***IF*** price displaces/moves impulsively away now on the 15m timeframe, it can come back to fill the 15m +BPR (Balanced Price Range) left after the sweep of the 4th April lows. a 15m ChoCh (Change of Character) A.K.A. MSS (Market Structure Shift) would be ideal, but the last 15m swing high to be broken is a bit far away so the BPR fill is the alternative. This also lines up with the 4H +FVG which has a 4H +OB/Demand Zone below it.
I have placed my stop loss below the Pennant's rPOC (Range Point Of Control) for a peace of mind instead of the wick of the stop hunt.
I will post a zoomed in chart below.

Oil 6R Short Trade | Smart Money Concepts | ICT | SMT divergenceTesting another short swing trade based on SMT divergence; this time, divs between US treasury yields and Oil, targeting a previous day's low and demand zone.
I already caught one 6R short the other day using this same setup, and now we have more divergence while price has come into an untapped New Day Opening Gap as well as a supply zone.
We have also retraced on the daily timeframe to the 50%/equilibrium of the range and bottom of the wedge pattern that has already played out.
Price has choched/MSS'd on the 1H timeframe taking out Asia lows and pulling back to mitigate around daily range's equilibrium/mid.
This swing trade is supported by:
1. (like my BTC long) A risk-off environment due to impending bank failures combined with the Fed's sentiment indicating an ostensible softening of interest rate rises.
This is not investment or financial advice, just my own opinion.
