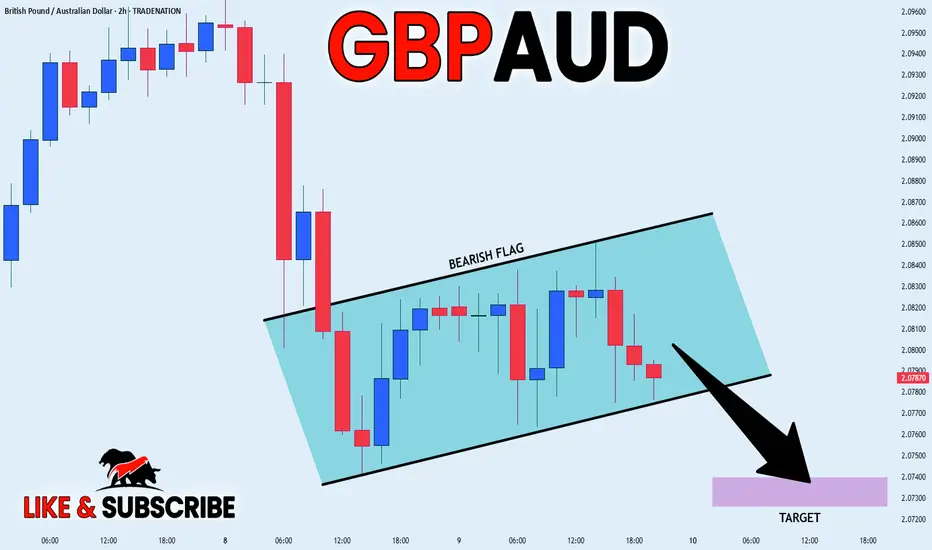
GBP_AUD BEARISH FLAG|SHORT|
✅GBP_AUD is going down now
And the pair has formed
A bearish flag pattern
Which makes me bearish biased
And after the breakout
I believe we will see bearish continuation
SHORT🔥
✅Like and subscribe to never miss a new idea!✅
Disclosure: I am part of Trade Nation's Influencer program and receive a monthly fee for using their TradingView charts in my analysis.
Smartmoney
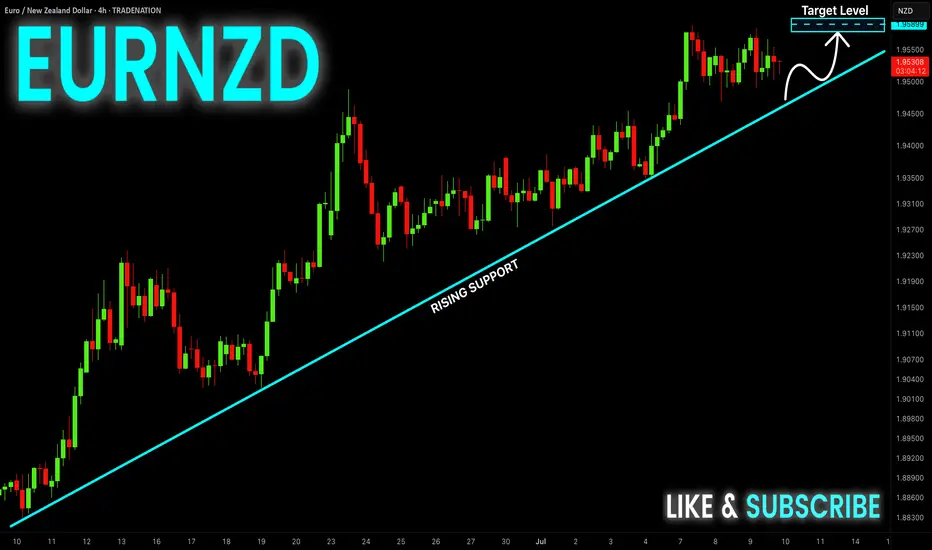
EUR-NZD Strong Uptrend! Buy!
Hello,Traders!
EUR-NZD is trading in a
Strong uptrend along the
Rising support so we are
Bullish biased and we will
Be expecting a further
Bullish move up
Buy!
Comment and subscribe to help us grow!
Check out other forecasts below too!
Disclosure: I am part of Trade Nation's Influencer program and receive a monthly fee for using their TradingView charts in my analysis.
EUR_CHF SUPPORT AHEAD|LONG|
✅EUR_CHF is going down now
But a strong support level is ahead at 0.9293
Thus I am expecting a rebound
And a move up towards the target of 0.9320
LONG🚀
✅Like and subscribe to never miss a new idea!✅
Disclosure: I am part of Trade Nation's Influencer program and receive a monthly fee for using their TradingView charts in my analysis.

USD-CHF Bearish Flag! Sell!
Hello,Traders!
USD-CHF is trading in a
Downtrend and the pair broke
Out of the bearish flag so
We are bearish biased
And we will be expecting
A further bearish move down
Sell!
Comment and subscribe to help us grow!
Check out other forecasts below too!
Disclosure: I am part of Trade Nation's Influencer program and receive a monthly fee for using their TradingView charts in my analysis.

AUDJPY: Short Trade with Entry/SL/TP
AUDJPY
- Classic bearish pattern
- Our team expects retracement
SUGGESTED TRADE:
Swing Trade
Sell AUDJPY
Entry - 95.749
Stop - 96.149
Take - 94.847
Our Risk - 1%
Start protection of your profits from lower levels
Disclosure: I am part of Trade Nation's Influencer program and receive a monthly fee for using their TradingView charts in my analysis.
❤️ Please, support our work with like & comment! ❤️

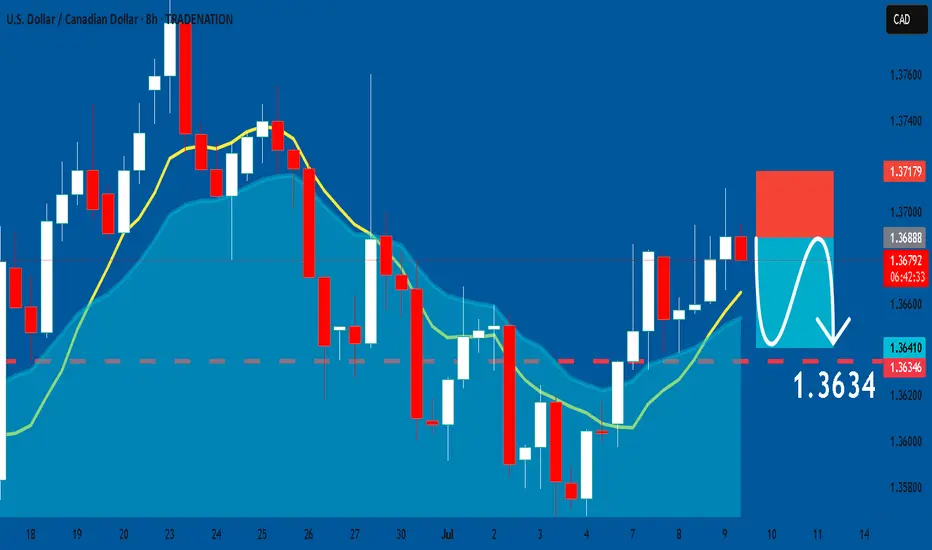
USDCAD: Bearish Continuation & Short Signal
USDCAD
- Classic bearish setup
- Our team expects bearish continuation
SUGGESTED TRADE:
Swing Trade
Short USDCAD
Entry Point - 1.3688
Stop Loss - 1.3717
Take Profit - 1.3634
Our Risk - 1%
Start protection of your profits from lower levels
Disclosure: I am part of Trade Nation's Influencer program and receive a monthly fee for using their TradingView charts in my analysis.
❤️ Please, support our work with like & comment! ❤️
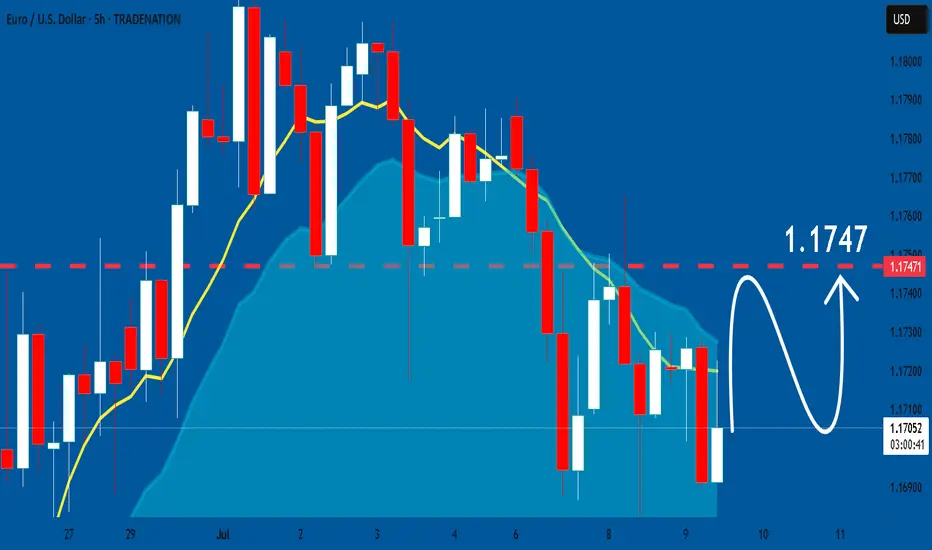
EURUSD: Expecting Bullish Movement! Here is Why:
Looking at the chart of EURUSD right now we are seeing some interesting price action on the lower timeframes. Thus a local move up seems to be quite likely.
Disclosure: I am part of Trade Nation's Influencer program and receive a monthly fee for using their TradingView charts in my analysis.
❤️ Please, support our work with like & comment! ❤️
GBPUSD: Market of Sellers
The analysis of the GBPUSD chart clearly shows us that the pair is finally about to tank due to the rising pressure from the sellers.
Disclosure: I am part of Trade Nation's Influencer program and receive a monthly fee for using their TradingView charts in my analysis.
❤️ Please, support our work with like & comment! ❤️

AUD_JPY WILL KEEP GROWING|LONG|
✅AUD_JPY is going up
Now and the pair made a bullish
Breakout of the key horizontal
Level of 95.600 and the breakout
Is confirmed so we are bullish
Biased and further growth
Is to be expected
LONG🚀
✅Like and subscribe to never miss a new idea!✅
Disclosure: I am part of Trade Nation's Influencer program and receive a monthly fee for using their TradingView charts in my analysis.

GOLD Long Inside The Range! Buy!
Hello,Traders!
GOLD is stuck in a local
Range while still trading
In a strong long-term uptrend
So we think that this is an
Accumulation before the
Next leg up and as we are
Bullish biased we will be
Expecting a retest and a
Rebound from the horizontal
Support below around 3259$
With the target of retesting
The horizontal resistance
Above around 3354$
Buy!
Comment and subscribe to help us grow!
Check out other forecasts below too!
Disclosure: I am part of Trade Nation's Influencer program and receive a monthly fee for using their TradingView charts in my analysis.

AUD_NZD SWING SHORT|
✅AUD_NZD has been growing recently
And the pair seems locally overbought
So as the pair is approaching a horizontal resistance of 1.0920
Price decline is to be expected
SHORT🔥
✅Like and subscribe to never miss a new idea!✅
Disclosure: I am part of Trade Nation's Influencer program and receive a monthly fee for using their TradingView charts in my analysis.

AUD-JPY Bullish Breakout! Buy!
Hello,Traders!
AUD-JPY is trading in a
Strong uptrend and the pair
Made a bullish breakout of
The key horizontal level
Of 95.650 which is now a
Support and the breakout
Is confirmed so we are bullish
Biased and we will be expecting
A further bullish move up
Buy!
Comment and subscribe to help us grow!
Check out other forecasts below too!
Disclosure: I am part of Trade Nation's Influencer program and receive a monthly fee for using their TradingView charts in my analysis.

DXY LOCAL SHORT|
✅DXY is about to retest a key structure level of 98.000
Which implies a high likelihood of a move down
As some market participants will be taking profit from long positions
While others will find this price level to be good for selling
So as usual we will have a chance to ride the wave of a bearish correction
SHORT🔥
✅Like and subscribe to never miss a new idea!✅
Disclosure: I am part of Trade Nation's Influencer program and receive a monthly fee for using their TradingView charts in my analysis.

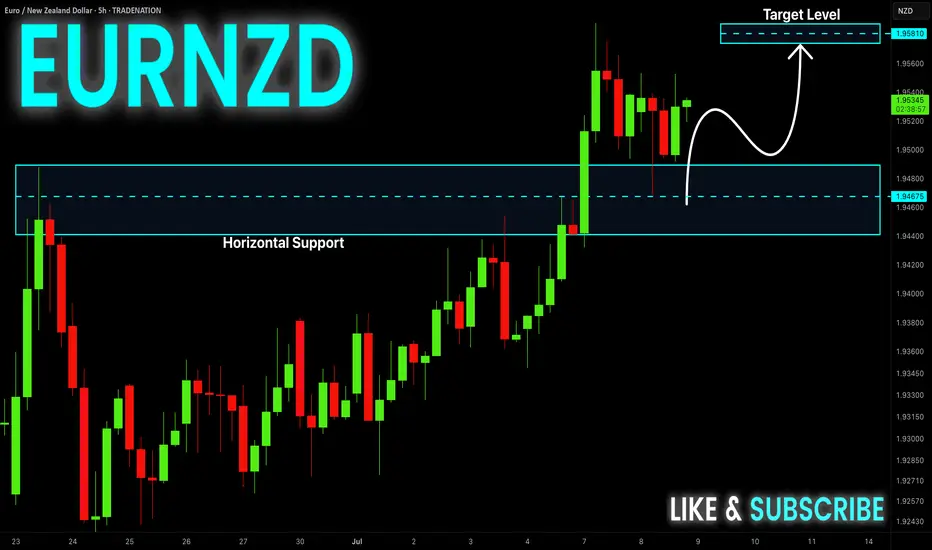
EUR-NZD Will Keep Growing! Buy!
Hello,Traders!
EUR-NZD keeps growing in a
Strong uptrend and the pair
Made a retest and a rebound
From the horizontal support
Of 1.9480 so we are bullish
Biased and we will be expecting
A further bullish move up
Buy!
Comment and subscribe to help us grow!
Check out other forecasts below too!
Disclosure: I am part of Trade Nation's Influencer program and receive a monthly fee for using their TradingView charts in my analysis.
NZDUSD: Bullish Continuation & Long Trade
NZDUSD
- Classic bullish pattern
- Our team expects retracement
SUGGESTED TRADE:
Swing Trade
Buy NZDUSD
Entry - 0.5984
Stop - 0.5949
Take - 0.6053
Our Risk - 1%
Start protection of your profits from lower levels
Disclosure: I am part of Trade Nation's Influencer program and receive a monthly fee for using their TradingView charts in my analysis.
❤️ Please, support our work with like & comment! ❤️

GBPJPY: Bearish Forecast & Outlook
Looking at the chart of GBPJPY right now we are seeing some interesting price action on the lower timeframes. Thus a local move down seems to be quite likely.
Disclosure: I am part of Trade Nation's Influencer program and receive a monthly fee for using their TradingView charts in my analysis.
❤️ Please, support our work with like & comment! ❤️

GBPCAD: Bullish Continuation is Highly Probable! Here is Why:
Remember that we can not, and should not impose our will on the market but rather listen to its whims and make profit by following it. And thus shall be done today on the GBPCAD pair which is likely to be pushed up by the bulls so we will buy!
Disclosure: I am part of Trade Nation's Influencer program and receive a monthly fee for using their TradingView charts in my analysis.
❤️ Please, support our work with like & comment! ❤️

GOLD: Long Signal Explained
GOLD
- Classic bullish setup
- Our team expects bullish continuation
SUGGESTED TRADE:
Swing Trade
Long GOLD
Entry Point - 3311.9
Stop Loss - 3305.4
Take Profit - 3324.3
Our Risk - 1%
Start protection of your profits from lower levels
Disclosure: I am part of Trade Nation's Influencer program and receive a monthly fee for using their TradingView charts in my analysis.
❤️ Please, support our work with like & comment! ❤️

AMAZON STRONG UPTREND|LONG|
✅AMAZON is going up
Now and the stock made a bullish
Breakout of the key horizontal
Level of 220$ and the breakout
Is confirmed so we are bullish
Biased and we will be expecting
A further bullish move up
LONG🚀
✅Like and subscribe to never miss a new idea!✅
Disclosure: I am part of Trade Nation's Influencer program and receive a monthly fee for using their TradingView charts in my analysis.

TESLA Reached The Support! Buy!
Hello,Traders!
TESLA gaped down on
Monday but the move was
Held up by a massive support
Area ending around 272$ and
As the support is strong we
Will be expecting a rebound and
A move up from the level
Buy!
Comment and subscribe to help us grow!
Check out other forecasts below too!
Disclosure: I am part of Trade Nation's Influencer program and receive a monthly fee for using their TradingView charts in my analysis.

DXY Short From Resistance! Sell!
Hello,Traders!
DXY made a nice rebound
From the lows but will soon
Hit a horizontal resistance
Around 97.900 from where
We will be expecting a
Local bearish correction
Sell!
Comment and subscribe to help us grow!
Check out other forecasts below too!
Disclosure: I am part of Trade Nation's Influencer program and receive a monthly fee for using their TradingView charts in my analysis.

GOLD RESISTANCE AHEAD|SHORT|
✅GOLD is going up now
But a strong resistance level is ahead at 3360$
Thus I am expecting a pullback
And a move down towards the target of 3325$
SHORT🔥
✅Like and subscribe to never miss a new idea!✅
Disclosure: I am part of Trade Nation's Influencer program and receive a monthly fee for using their TradingView charts in my analysis.

NZD_CHF BEARISH BREAKOUT|SHORT|
✅NZD_CHF keeps falling in
A strong downtrend and the pair
Made a bearish breakout and a
Retest of the key horizontal level
Of 0.4810 which is now a resistance
And the pair is already making a
Bearish pullback so we are
Bearish biased and we will be
Expecting a further bearish move down
SHORT🔥
✅Like and subscribe to never miss a new idea!✅
Disclosure: I am part of Trade Nation's Influencer program and receive a monthly fee for using their TradingView charts in my analysis.
