GOLD SUPPORT AHEAD|LONG|
✅GOLD is trading in an uptrend
With the price set to retest
The rising support line
From where I think the growth will continue
LONG🚀
✅Like and subscribe to never miss a new idea!✅
Disclosure: I am part of Trade Nation's Influencer program and receive a monthly fee for using their TradingView charts in my analysis.
Smartmoney

GBP_JPY RISING SUPPORT|LONG|
✅GBP_JPY is trading along the rising support
And as the pair will soon retest it
I am expecting the price to go up
To retest the supply levels above at 195.733
LONG🚀
✅Like and subscribe to never miss a new idea!✅
Disclosure: I am part of Trade Nation's Influencer program and receive a monthly fee for using their TradingView charts in my analysis.

GBP-CHF Support Ahead! Buy!
Hello,Traders!
GBP-CHF keeps falling but
A strong horizontal support
Level is ahead at 1.0921
From where we will be
Expecting a rebound
And a local bullish move up
Buy!
Comment and subscribe to help us grow!
Check out other forecasts below too!
Disclosure: I am part of Trade Nation's Influencer program and receive a monthly fee for using their TradingView charts in my analysis.

ETH Short – Smart Money Setup | 17.06 🔍 Context:
After a strong dump on ETH, clearly visible on the 1H chart (left side of image), I waited for a retrace into the Fair Value Gap (FVG) zone — typical Smart Money behavior. That’s where I started looking for a short setup.
🎯 Entry Logic:
Now here's the part I’d love to discuss with you.
The classic and maybe "cleanest" approach would be to wait for a market structure break on a lower timeframe and then enter on the continuation, targeting rejection zones visible again on the 1H.
But…
Lately, I’ve been taking entries directly from FVG, even before the break, if another FVG forms on the lower timeframe inside the higher timeframe zone. That’s what happened here — I saw a second FVG form in the key area, and took the short from that.
Sometimes I even treat two FVGs in the same direction (on the same or different timeframes) as a valid entry point on their own.
🤔 Question to the community:
How do you usually approach this?
Do you wait for confirmation/structure break on the lower TF before entering, or do you also go straight from the FVG if the zone is respected well enough?
Would love to hear how others manage similar setups.

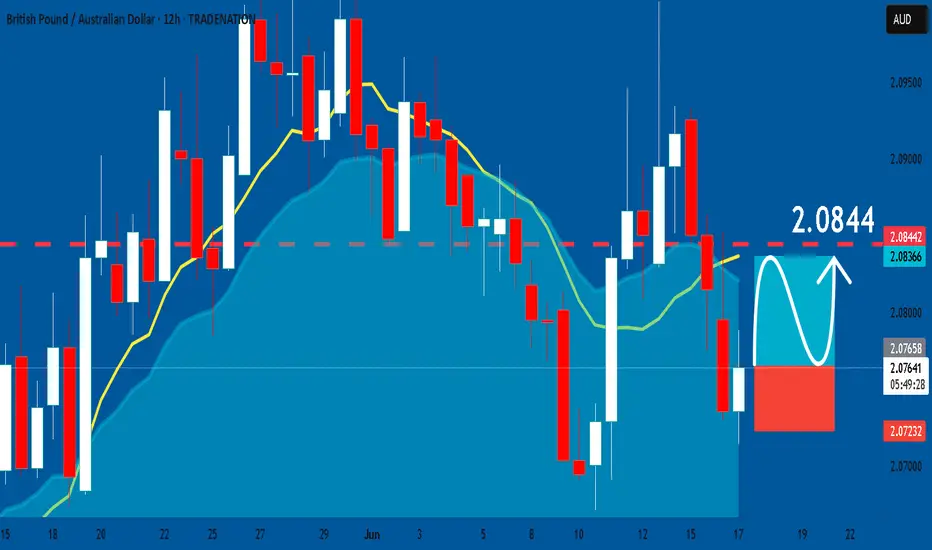
GBPAUD: Bullish Continuation & Long Trade
GBPAUD
- Classic bullish formation
- Our team expects growth
SUGGESTED TRADE:
Swing Trade
Buy GBPAUD
Entry Level - 2.0766
Sl - 2.0723
Tp - 2.0844
Our Risk - 1%
Start protection of your profits from lower levels
Disclosure: I am part of Trade Nation's Influencer program and receive a monthly fee for using their TradingView charts in my analysis.
❤️ Please, support our work with like & comment! ❤️
EURCHF: Bearish Continuation & Short Signal
EURCHF
- Classic bearish setup
- Our team expects bearish continuation
SUGGESTED TRADE:
Swing Trade
Short EURCHF
Entry Point - 0.9403
Stop Loss - 0.9417
Take Profit - 0.9380
Our Risk - 1%
Start protection of your profits from lower levels
Disclosure: I am part of Trade Nation's Influencer program and receive a monthly fee for using their TradingView charts in my analysis.
❤️ Please, support our work with like & comment! ❤️

EURUSD: Weak Market & Bearish Forecast
Our strategy, polished by years of trial and error has helped us identify what seems to be a great trading opportunity and we are here to share it with you as the time is ripe for us to sell EURUSD.
Disclosure: I am part of Trade Nation's Influencer program and receive a monthly fee for using their TradingView charts in my analysis.
❤️ Please, support our work with like & comment! ❤️

GBPUSD: Expecting Bullish Movement! Here is Why:
It is essential that we apply multitimeframe technical analysis and there is no better example of why that is the case than the current GBPUSD chart which, if analyzed properly, clearly points in the upward direction.
Disclosure: I am part of Trade Nation's Influencer program and receive a monthly fee for using their TradingView charts in my analysis.
❤️ Please, support our work with like & comment! ❤️

GBP_CAD RISKY LONG|
✅GBP_CAD is set to retest a
Strong support level below at 1.8380
After trading in a local downtrend for some time
Which makes a bullish rebound a likely scenario
With the target being a local resistance above at 1.8426
LONG🚀
✅Like and subscribe to never miss a new idea!✅
Disclosure: I am part of Trade Nation's Influencer program and receive a monthly fee for using their TradingView charts in my analysis.

GBP-NZD Rising Support Ahead! Buy!
Hello,Traders!
GBP-NZD keeps falling
Down but a rising support
Line is ahead and as the
Pair is locally oversold we
Will be expecting a rebound
And a move up after the
Retest of the support below
Sell!
Comment and subscribe to help us grow!
Check out other forecasts below too!
Disclosure: I am part of Trade Nation's Influencer program and receive a monthly fee for using their TradingView charts in my analysis.

USD-CHF Bearish Bias! Sell!
Hello,Traders!
USD-CHF is trading in a
Downtrend and the pair
Is making a local bullish
Pullback but will soon
Hit a horizontal resistance
Level around 0.8185
So we are bearish biased
And we will be expecting
A further bearish move down
Sell!
Comment and subscribe to help us grow!
Check out other forecasts below too!
Disclosure: I am part of Trade Nation's Influencer program and receive a monthly fee for using their TradingView charts in my analysis.

EUR-CHF Resistance Ahead! Sell!
Hello,Traders!
EUR-CHF keeps growing
But a strong horizontal
Resistance of 0.9445
Is ahead so after the
Retest we will be expecting
A local bearish move down
Sell!
Comment and subscribe to help us grow!
Check out other forecasts below too!
Disclosure: I am part of Trade Nation's Influencer program and receive a monthly fee for using their TradingView charts in my analysis.

The "True Close" Institutions Don't Talk About — But Trade On█ My Story from the Inside
I worked at a hedge fund in Europe, where I served as a Risk Advisor. One thing I never expected before joining the institutional side of the market was this:
They didn’t treat the current day’s close as the "true" close of the market.
Instead, they looked at the first hour of the next day — once all pending flows had settled, rebalancing was done, and execution dust had cleared — that was the true close in their eyes.
Here’s why that changed everything I knew about trading:
█ Institutional Reality vs Retail Fantasy
⚪ Retail traders are taught:
“The daily close is the most important price of the day.” But institutions operate under constraints that most retail traders are never exposed to:
Orders too large to fill before the bell
Internal compliance and execution delays
Batch algorithms and VWAP/TWAP systems that extend into the next session
So while the market might close on paper at 17:30 CET, the real trading — the stuff that matters to funds — might not wrap up until 09:30 or 10:00 the next morning.
Although the official “close” prints here, institutional volume ends quickly. It drops off sharply, almost immediately. Once the books are closed and final prints are done, big players exit — and what's left is thin, passive flow or noise.
The first hour of the New York session reveals structured flows, not random volatility. This is where institutions finalize yesterday’s unfinished business, which is why many consider this the “true” close.
And that’s the price risk managers, portfolio managers, and execution teams internally treat as the reference point.
█ Example: The Rebalance Spillover
Let’s say a fund needs to offload €100 million worth of tech stocks before month-end. They start into the close, but liquidity is thin. Slippage mounts. They pause execution. Next morning, their algo resumes — quietly but aggressively — in the first 30 minutes of trade.
You see a sharp spike. Then a reversal. Then another surge.
That’s not noise. That’s structure. It’s the result of unfinished business from yesterday.
█ Why the First Hour is a War Zone
You’ve probably seen it:
Prices whip back and forth at the open
Yesterday’s key levels are revisited, sometimes violently
Big moves happen without any overnight news
Here’s what’s happening under the hood:
Rebalancing spillovers from the day before
Late-position adjustments from inflows/outflows
Risk parity or vol-targeting models triggering trades based on overnight data
The market’s not reacting to fresh news — it’s completing its old to-do list.
█ What the Research Really Says About Morning Volatility
The idea that "the true close happens the next morning" isn’t just insider intuition — it’s backed by market microstructure research that highlights how institutional behaviors disrupt the clean narrative of the official close.
Here’s what the literature reveals:
█ Heston, Korajczyk & Sadka (2010)
Their study on intraday return patterns shows that returns continue at predictable 30-minute intervals, especially around the open.
The key driver? Institutional order flow imbalances.
When big funds can’t complete trades at the close, they spill into the next session, creating mechanical, non-informational momentum during the first hour. These delayed executions are visible as persistent price drifts after the open, not random volatility.
█ Wei Li & Steven Wang (SSRN 2010)
This paper dives into the asymmetric impact of institutional trades. It shows that when institutions are forced to adjust positions — often due to risk limits, inflows/outflows, or model-based triggers — the market reacts most violently in the early hours of the day.
When funds lag behind the clock, the next morning becomes a catch-up window, and price volatility spikes accordingly.
█ Lars Nordén (Doctoral Thesis, Swedish Stock Exchange)
In his microstructure research, Nordén found that the variance of returns is highest in the early part of the session, not at the close. This is especially true on days following macro events or at the end/start of reporting periods.
The data implies that institutions “price in” what they couldn’t execute the day before, making the next morning more informative than the actual close.
█ Bottom Line from the Research:
The first hour isn’t wild because it’s full of emotion.
It’s wild because it’s full of unfinished business.
These studies reinforce that price discovery is a rolling process, and for institutional flows, the official close is just a checkpoint, not a final destination.
█ How to Use This as a Trader
⚪ Don't assume the official close is final
Treat it as a temporary bookmark. Watch what happens in the first hour of the next day — that’s when intentions are revealed.
⚪ Volume in the first 30–60 minutes matters
It’s not noise — it’s flow completion. Often non-price-sensitive. Often mechanical.
⚪ Design strategies around “true close” logic
Test fade setups after the first hour’s range is established. That’s often the real “settled” level.
⚪ Use the first-hour VWAP or midpoint as a reference
Institutions may anchor to that — not the official close — for mean reversion or risk metrics.
█ Final Thought
The first hour is not the start of something new.
It’s the conclusion of yesterday’s market.
And unless you understand how institutions truly close their books — and how long that takes — you’ll always be a step behind.
So next time you see chaos at the open, stop calling it random.
👉 It’s just the market putting yesterday to bed — late.
-----------------
Disclaimer
The content provided in my scripts, indicators, ideas, algorithms, and systems is for educational and informational purposes only. It does not constitute financial advice, investment recommendations, or a solicitation to buy or sell any financial instruments. I will not accept liability for any loss or damage, including without limitation any loss of profit, which may arise directly or indirectly from the use of or reliance on such information.
All investments involve risk, and the past performance of a security, industry, sector, market, financial product, trading strategy, backtest, or individual's trading does not guarantee future results or returns. Investors are fully responsible for any investment decisions they make. Such decisions should be based solely on an evaluation of their financial circumstances, investment objectives, risk tolerance, and liquidity needs.

EURNZD: Short Trading Opportunity
EURNZD
- Classic bearish setup
- Our team expects bearish continuation
SUGGESTED TRADE:
Swing Trade
Short EURNZD
Entry Point - 1.9088
Stop Loss - 1.9138
Take Profit - 1.8982
Our Risk - 1%
Start protection of your profits from lower levels
Disclosure: I am part of Trade Nation's Influencer program and receive a monthly fee for using their TradingView charts in my analysis.
❤️ Please, support our work with like & comment! ❤️

NZDUSD: Market of Sellers
The analysis of the NZDUSD chart clearly shows us that the pair is finally about to tank due to the rising pressure from the sellers.
Disclosure: I am part of Trade Nation's Influencer program and receive a monthly fee for using their TradingView charts in my analysis.
❤️ Please, support our work with like & comment! ❤️

They called it consolidation. I called it accumulation.Price was coiled in a defined OB + FVG combo — building pressure while the rest of the market slept. The moment we swept the low into the Order Block, the trade became personal. This wasn’t noise — it was alignment.
Why I entered:
Daily FVG + OB overlap — textbook Smart Money entry zone
Volume spike at the OB low, signaling smart accumulation
Structural BOS confirmation on intraday after sweep
What followed was an impulsive push through inefficiencies, climbing level by level toward pre-defined liquidity pools.
Targets:
TP1: 2.6464 — rebalancing zone
TP2: 3.00 — clean inefficiency top
TP3: 3.39 — liquidity magnet
Trade thesis:
Entry was set between 2.05–2.10, stop placed with precision below the OB. No guessing. Just calculated structure + narrative.
I don’t chase moves. I let price come to my zone. And when it does, I strike with full conviction.
Final words:
“Your edge doesn’t scream. It sits quietly in imbalance — waiting.”

The FVG told the story. The chart just caught upThis wasn’t a pump. It was a re-delivery. Price tapped into the daily Fair Value Gap, respected the zone, and printed structure off the low. The retracement didn’t break us — it loaded us.
The logic:
The move began from an untouched Daily FVG — clean displacement, low retest, and now price is working its way through old inefficiencies. There’s no breakout here. Just one thing: delivery.
TP: 0.0163 — high timeframe imbalance resolution and prior volume pivot
The setup didn’t beg. It whispered. And now it’s unfolding, with confluence from every angle — market structure, volume, and intention.
Execution:
Entry: 0.0109–0.0113 (already in the zone)
SL: Below 0.0092
TP: 0.0163
Let others laugh at frogs. I’m here to extract liquidity from their disbelief.
Final thought:
“The move doesn’t care if you believe in it. It just needs a reason to unfold.”

You saw a meme. I saw imbalanceWIF doesn’t need to be serious — because I am. This move isn’t about hype. It’s about inefficiency, reclaimed structure, and a clear delivery path.
The logic:
Price swept the lows and gave a clean reaction off the OB. From there, it filled the local FVG but didn’t expand — it paused. That tells me it’s not finished building. The first push wasn’t the move. It was the positioning.
The real draw is layered above:
TP1: 0.9591 — inefficiency midpoint
TP2: 1.0469 — external liquidity and high-volume cluster
The FVG-OB combo below (0.8736–0.8565) is the reload zone. That’s where Smart Money buys. Not above. Not late.
Execution:
Entry: 0.857–0.875 zone
SL: Below 0.825
TP1: 0.959
TP2: 1.046
Let retail react to candles. I’m reacting to context.
Final thought:
“You can laugh at the ticker. Just don’t laugh at the R/R.”

USDJPY Long potential setupWhat's going on?
USDJPY – Reload Zone Marked. If They Take Me Out, I’ll Be Waiting Lower.
Discipline means you don’t chase. You wait where the market must return.
Currently in 2 buys, one is an added position, then I moved my stop in from the purple line— but if those get wicked out, I’m hunting the next key demand zone just beneath 144.10. Where we'll have a textbook spring setup!
🧠 What I See:
We're forming a potential micro accumulation structure.
If the current position gets taken out, I’ll reload lower at the spring aligned with the prior reaction low + liquidity sweep zone.
🎯 Next Area of Interest:
Zone: 144.00 – 144.10
📌 Target Remains:
144.76 → 145.36
1.618 extension aligns with supply inefficiencies & range completion
---
> “Stop loss isn’t failure. It’s recon. The second entry — that’s where pros feast.”
I’m not trading emotion. I’m trading plan + precision + execution.

CAD-CHF Potential Short! Sell!
Hello,Traders!
CAD-CHF made a retest
Of the horizontal resistance
Of 0.5990 and pullback is
Already happening so we are
Locally bearish biased and
We will be expecting a
Further bearish move down
Sell!
Comment and subscribe to help us grow!
Check out other forecasts below too!
Disclosure: I am part of Trade Nation's Influencer program and receive a monthly fee for using their TradingView charts in my analysis.

AUD_JPY MOVE DOWN AHEAD|SHORT|
✅AUD_JPY made a retest of
The strong horizontal resistance of 93.900
Level of 106.083 and as you
Can see the pair is already
Making a local pullback from
The level which sends a clear
Bearish signal to us therefore
We will be expecting a
Further bearish correction
SHORT🔥
✅Like and subscribe to never miss a new idea!✅
Disclosure: I am part of Trade Nation's Influencer program and receive a monthly fee for using their TradingView charts in my analysis.

CHF-JPY Will Keep Growing! Buy!
Hello,Traders!
CHF-JPY made a bullish
Breakout of the key horizontal
Level of 177.327 and the
Breakout is confirmed so
We are bullish biased
And we will be expecting
A further bullish continuation
Buy!
Comment and subscribe to help us grow!
Check out other forecasts below too!
Disclosure: I am part of Trade Nation's Influencer program and receive a monthly fee for using their TradingView charts in my analysis.

AUD-CHF Pullback Ahead! Sell!
Hello,Traders!
AUD-CHF made a retest
Of the strong wide horizontal
Resistance around 0.5289
And we are already seeing a
Local pullback so we are
Locally bearish biased and
We will be expecting a
Further bearish move down
On Monday
Sell!
Comment and subscribe to help us grow!
Check out other forecasts below too!
Disclosure: I am part of Trade Nation's Influencer program and receive a monthly fee for using their TradingView charts in my analysis.
