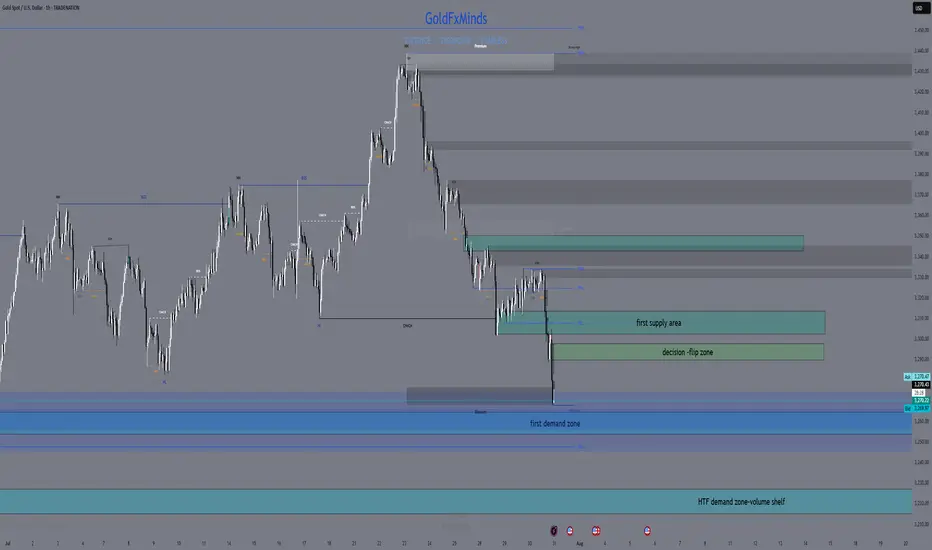
XAUUSD Market Update – July 30 Late NY Recap🔸Macro Context
Markets are still digesting Powell’s ongoing speech with no clear pivot signals. While FOMC tone remained cautious, no dovish surprise emerged. Trump’s upcoming comments keep geopolitical risks elevated. USD remains firm. Gold is reacting within key HTF demand as intraday volatility cools off.
🔸Bias Overview
Weekly Bias:
• Bearish rejection from the major supply wick 3439–3350
• Structure still below 3345, maintaining downside pressure
• Weekly RSI cooling off — no bullish divergence yet
Daily Bias:
• Lower high locked below 3345
• Price reentered the imbalance toward 3272
• Clean structure remains bearish unless we reclaim 3302
H4 Bias:
• Lower high formed at 3314
• Current price testing HTF Extreme Demand Base (3289–3272)
• Still bearish unless we see a confirmed M15 or H1 BOS from demand
🔸Key Structural Zones
🔺Above Price (3272):
• 3289–3294
Decision Block – M30 OB + FVG. First sign of momentum shift if reclaimed.
• 3302–3314
Supply Reversal – H1 OB + previous BOS zone. EMA alignment adds pressure.
• 3345–3350
Major Rejection Zone – H4 origin of last leg down. Strong resistance area.
🔻Below Price (3272):
• 3254–3264
Imbalance + OB – H4 FVG + clean demand zone. Buy setup only on deep flush + reversal PA.
• 3227–3214
HTF Demand Base – Daily OB + historical volume shelf. Final structural floor before deeper downside opens.
🔸Battle Plan
▶ Scenario 1 – Bearish Breakout
If 3272 fails with momentum and no reversal signs, expect continuation into 3254–3264.
No long trades unless BOS confirms.
▶ Scenario 2 – Reactive Long from Demand
If price gives a strong reaction from 3272 with BOS on M15 or H1 and clears 3294, then a recovery into 3302 is possible. Only valid with confirmed PA + EMA shift.
▶ Scenario 3 – Choppy Rejection from 3294
If price tests 3294 but fails, watch for rejections back toward 3272. Scalpers can fade reactions if no bullish structure forms.
🔸Final Thoughts
Price is once again testing our Extreme Demand Base from July 28 (3289–3272). The zone remains valid — but execution depends entirely on confirmation. Bears still in control unless we reclaim 3302 cleanly.
No need to rush. Best RR setups are found at clean structural edges.
Patience = profits.
—💬 Drop your thoughts in the comments.
❤️ Like if you appreciate the precision.
🔔 Follow GoldFxMinds for more sniper-level updates.
With you all the way,
— GoldFxMinds
📊 Analysis based on Trade Nation TradingView charts.
Smartmoney
AUD-JPY Bearish Breakout! Sell!
Hello,Traders!
AUD-JPY made a bearish
Breakout of the rising support
Line and we are bearish biased
So we will be expecting a
Further bearish move down
Sell!
Comment and subscribe to help us grow!
Check out other forecasts below too!
Disclosure: I am part of Trade Nation's Influencer program and receive a monthly fee for using their TradingView charts in my analysis.

GOLD PLAN – LIQUIDITY HUNT BEFORE THE REAL MOVE? SCALPING PLAN – LIQUIDITY HUNT BEFORE THE REAL MOVE? 🔍
🔹 Timeframe: 30M
🔹 Bias: Intraday Bullish to Bearish Reversal
🔹 Posted by: Clinton Scalper | Smart Money Focus
🔹 Date: July 30, 2025
🔍 MACRO CONTEXT – WHY GOLD REMAINS HIGHLY REACTIVE
The macro backdrop continues to favor volatility in gold:
🟢 Dovish Fed tone ahead of FOMC
– Fed speakers hint at a pause or rate cut timeline.
– Inflation pressures are easing → lowers interest rate expectations.
📉 USD weakening + falling yields
– 10Y U.S. bonds retreating → dollar under pressure → gold gains ground.
🌐 Geopolitical risks remain elevated
– Tensions from Middle East and global recession risks continue to drive flows into safe-haven assets like gold.
🧭 Conclusion: Short-term upside still viable – but be cautious of liquidity traps and OB rejection.
📈 TECHNICAL + SMC INSIGHTS – THE CHART TELLS THE STORY
🔹 Structure Overview:
Market broke out of a descending channel and formed a bullish ascending wedge.
However, price is now approaching multiple OB SELL zones, aligning with smart money exhaustion levels.
🔹 Key Zones:
🔺 OB SELL Zones:
3,334 → 3,342
3,354 → 3,369 (Fibonacci 1.618 extension)
🔻 OB BUY Zones:
3,302 → 3,291 (confluence with previous liquidity sweep)
📍 Current Price: 3,330 – approaching first supply zone.
🔹 Smart Money Flow:
Liquidity above 3,334 has likely been targeted.
If price reaches 3,354–3,369 and shows exhaustion, expect distribution + reversal.
Key confirmation will be a break back below the ascending structure with momentum.
🎯 TRADE PLAN – TWO POSSIBLE SCALPING SCENARIOS
✅ SCENARIO 1: SHORT FROM PREMIUM OB SELL ZONE
Looking to fade bullish liquidity grab near top of range.
Entry: 3,354–3,369
SL: 3,375
TP1: 3,334
TP2: 3,302
TP3: 3,291
Ideal for reversal scalpers catching the distribution move.
✅ SCENARIO 2: LONG FROM DISCOUNT OB BUY ZONE
If price rejects OB SELL and dumps into unfilled demand.
Entry: 3,291–3,302
SL: 3,275
TP1: 3,322
TP2: 3,343
TP3: 3,354
Smart money often reloads after hunting liquidity beneath discount OBs.
⚠️ EXECUTION REMINDERS
✅ Wait for confirmation candles: engulfing / wick rejection / breaker structure
⛔ No market orders without OB reaction
📊 Risk max 1–1.5% per position
📉 Use volume to confirm absorption / exhaustion in OB zones
📢 FINAL THOUGHT – TRAPS COME FIRST, THEN MOVES
Smart Money doesn't chase price — it hunts stops first.
We’re watching closely to see if price completes its liquidity sweep at 3,354–3,369 before a potential reversal. Alternatively, we wait for price to return to the OB BUY zone around 3,291 for a high-RR long play.
🔥 If this helped you:
👍 Like this idea
💬 Comment your thoughts below
🔔 Follow Clinton Scalper for weekly institutional-grade setups

USD_CAD BULLISH BREAKOUT|LONG|
✅USD_CAD is going up
Now and the pair made a bullish
Breakout of the key horizontal
Level of 1.3800 and the breakout
Is confirmed so we are bullish
Biased and we will be expecting
A further bullish move up
LONG🚀
✅Like and subscribe to never miss a new idea!✅
Disclosure: I am part of Trade Nation's Influencer program and receive a monthly fee for using their TradingView charts in my analysis.

EUR-USD Free Signal! Buy!
Hello,Traders!
EUR-USD keeps falling and
The pair is locally oversold so
As the pair is retesting the
Horizontal support level
Of 1.1468 we can enter a
Long trade with Take Profit
Of 1.1510 and Stop Loss
Of 1.1443
Buy!
Comment and subscribe to help us grow!
Check out other forecasts below too!
Disclosure: I am part of Trade Nation's Influencer program and receive a monthly fee for using their TradingView charts in my analysis.

NZDCAD: Bullish Continuation is Expected! Here is Why:
The analysis of the NZDCAD chart clearly shows us that the pair is finally about to go up due to the rising pressure from the buyers.
Disclosure: I am part of Trade Nation's Influencer program and receive a monthly fee for using their TradingView charts in my analysis.
❤️ Please, support our work with like & comment! ❤️

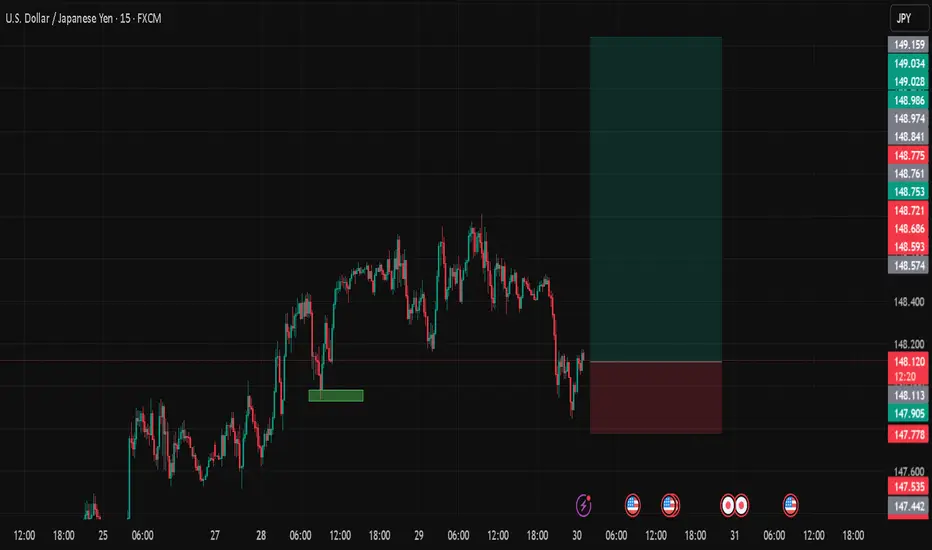
USDJPYDate:
July 30,2025
Session:
Asia and Sydney Session
Pair:
USDJPY
Bias:
Long
Liquid from Mondays New york open swept now price wants to follow trend
Entry: 148.108
Stop Loss: 147.778
Target: 149.640
RR: 4.57
AUDCAD: Long Trade Explained
AUDCAD
- Classic bullish formation
- Our team expects pullback
SUGGESTED TRADE:
Swing Trade
Long AUDCAD
Entry - 0.8914
Sl - 0.8901
Tp - 0.8941
Our Risk - 1%
Start protection of your profits from lower levels
Disclosure: I am part of Trade Nation's Influencer program and receive a monthly fee for using their TradingView charts in my analysis.
❤️ Please, support our work with like & comment! ❤️

EURCHF: Market of Buyers
Looking at the chart of EURCHF right now we are seeing some interesting price action on the lower timeframes. Thus a local move up seems to be quite likely.
Disclosure: I am part of Trade Nation's Influencer program and receive a monthly fee for using their TradingView charts in my analysis.
❤️ Please, support our work with like & comment! ❤️

GOLD: Bearish Continuation & Short Trade
GOLD
- Classic bearish pattern
- Our team expects retracement
SUGGESTED TRADE:
Swing Trade
Sell GOLD
Entry - 3331.7
Stop - 3334.0
Take - 3327.0
Our Risk - 1%
Start protection of your profits from lower levels
Disclosure: I am part of Trade Nation's Influencer program and receive a monthly fee for using their TradingView charts in my analysis.
❤️ Please, support our work with like & comment! ❤️

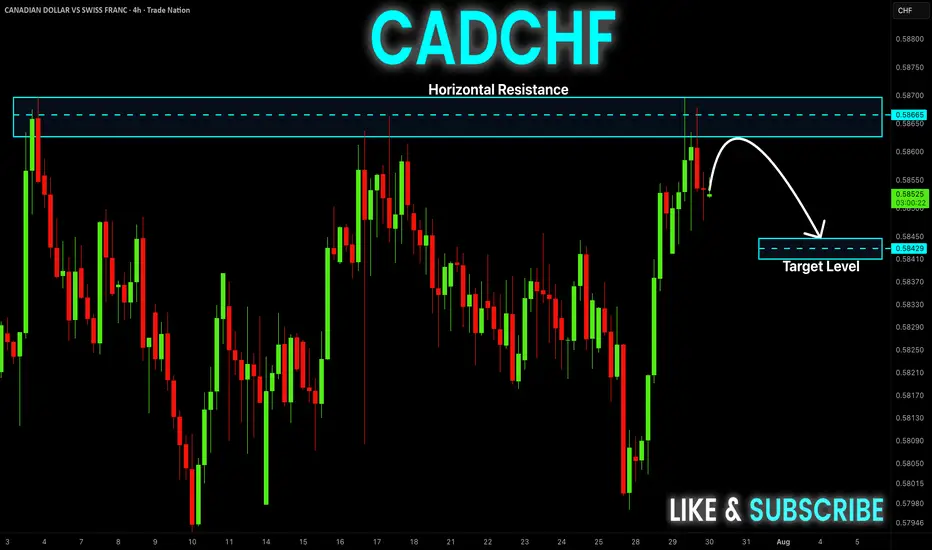
CAD-CHF Local Short! Sell!
Hello,Traders!
CAD-CHF went up and
Made a retest of the
Horizontal resistance
Around 0.5870 and we
Are already seeing a bearish
Pullback so we will be
Expecting a further
Bearish correction
Sell!
Comment and subscribe to help us grow!
Check out other forecasts below too!
Disclosure: I am part of Trade Nation's Influencer program and receive a monthly fee for using their TradingView charts in my analysis.
GOLD BEARISH BIAS|SHORT|
✅GOLD broke the rising
Support line which is now
A resistance and the price
Is retesting the line now so
We are locally bearish biased
And we will be expecting a
Local move down
SHORT🔥
✅Like and subscribe to never miss a new idea!✅
Disclosure: I am part of Trade Nation's Influencer program and receive a monthly fee for using their TradingView charts in my analysis.

GBP-JPY Rising Support! Buy!
Hello,Traders!
GBP-JPY is trading in an
Uptrend and the pair made
A retest of the rising support
And we are seeing a local
Bullish rebound and we will
Be expecting a further
Local move up
Buy!
Comment and subscribe to help us grow!
Check out other forecasts below too!
Disclosure: I am part of Trade Nation's Influencer program and receive a monthly fee for using their TradingView charts in my analysis.

USD-CAD Short From Resistance! Sell!
Hello,Traders!
USD-CAD went up and
Retested a horizontal
Resistance of 1.3800
From where we are
Already seeing a local
Bearish pullback and
As we are locally bearish
Biased so we will be
Expecting a local move down
Sell!
Comment and subscribe to help us grow!
Check out other forecasts below too!
Disclosure: I am part of Trade Nation's Influencer program and receive a monthly fee for using their TradingView charts in my analysis.

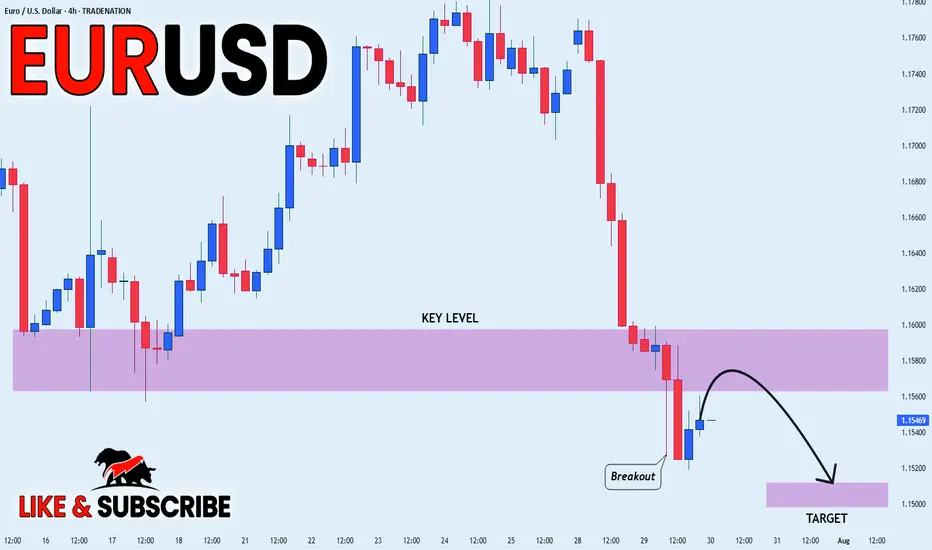
EUR_USD BEARISH BREAKOUT|SHORT|
✅EUR_USD broke the key
Structure level of 1.1580
While trading in an local downtrend
Which makes me bearish
And I think that after the retest of
The broken level is complete
A bearish continuation will follow
SHORT🔥
✅Like and subscribe to never miss a new idea!✅
Disclosure: I am part of Trade Nation's Influencer program and receive a monthly fee for using their TradingView charts in my analysis.
EUR_NZD REBOUND AHEAD|LONG|
✅EUR_NZD fell again to retest the support of 1.9380
But it is a strong key level
So I think that there is a high chance
That we will see a bullish rebound and a move up
LONG🚀
✅Like and subscribe to never miss a new idea!✅
Disclosure: I am part of Trade Nation's Influencer program and receive a monthly fee for using their TradingView charts in my analysis.

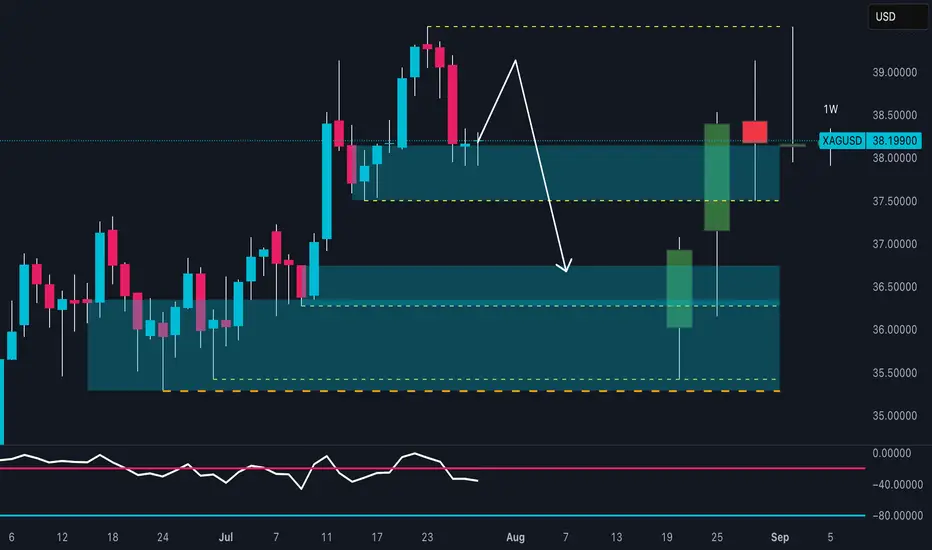
SILVER Is About to Collapse? Watch This Critical Supply Zone!Price recently tapped a high near 39.20 before sharply rejecting from the 38.80–39.20 supply zone, confirming strong selling pressure. The current structure shows:
- Supply zone tested and rejected
- Likely return to the previous demand zone (36.50–36.00)
- RSI is turning down, confirming loss of momentum
A pullback toward 38.30–38.50, followed by a bearish continuation toward the 36.50 area, which acts as a key structural and institutional support.
🗓️ Seasonality
Historically, July is bullish for silver:
Last 5Y average: +0.89%
Last 2Y average: +2.18%
However, August–September are bearish months:
August: mildly positive, but weak
September: consistently negative across all time frames (-0.86% to -1.10%)
This increases the probability of a downward move starting in early August, in line with current price action rejection.
🪙 Commitment of Traders (COT) – July 22
Non-Commercials (speculators):
Longs: +656
Shorts: -516
Commercials (hedging):
Longs: +1,337
Shorts: +916
➡️ Commercials are increasing both long and short exposure, while non-commercials remain net long — a sign of moderate optimism.
However, long positioning is slowing down compared to previous weeks. A potential exhaustion in bullish momentum is forming.
📉 Sentiment
52% short vs 48% long
Volume: more lots on the short side (492 vs 454)
Sentiment remains neutral to slightly contrarian bullish, but not extreme. This may allow for a fake breakout before a deeper move down.
🧩 Operational Summary
Main bias: Bearish short to mid-term (starting August), supported by:
- Technical rejection at supply
- Negative seasonal tendencies ahead
- RSI showing momentum loss
- COT showing stabilization, not accumulation
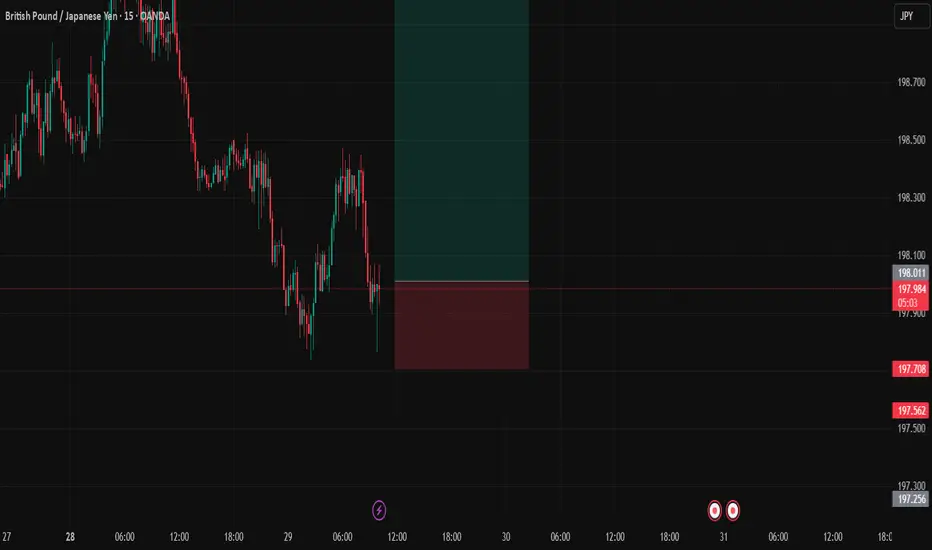
GBPJPYDate:
July 29,2025
Session:
London and New York Session
Pair:
GBPJPY
Bias:
Long
Yesterdays liquid untouched still lies. Expecting price to fill that area either by end of NY session or Asia.
Entry: 198.018
Stop Loss: 197.704
Target: 199.068
RR: 3.5
NZDUSD: Market Sentiment & Price Action
Looking at the chart of NZDUSD right now we are seeing some interesting price action on the lower timeframes. Thus a local move up seems to be quite likely.
Disclosure: I am part of Trade Nation's Influencer program and receive a monthly fee for using their TradingView charts in my analysis.
❤️ Please, support our work with like & comment! ❤️

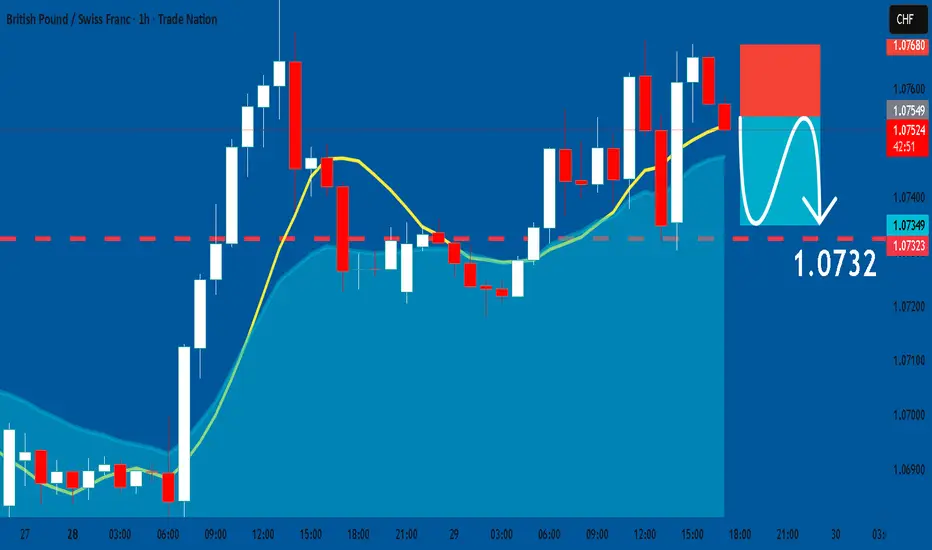
GBPCHF: Short Signal with Entry/SL/TP
GBPCHF
- Classic bearish setup
- Our team expects bearish continuation
SUGGESTED TRADE:
Swing Trade
Short GBPCHF
Entry Point - 1.0754
Stop Loss - 1.0768
Take Profit - 1.0732
Our Risk - 1%
Start protection of your profits from lower levels
Disclosure: I am part of Trade Nation's Influencer program and receive a monthly fee for using their TradingView charts in my analysis.
❤️ Please, support our work with like & comment! ❤️
EURUSD: Bullish Continuation is Expected! Here is Why:
Remember that we can not, and should not impose our will on the market but rather listen to its whims and make profit by following it. And thus shall be done today on the EURUSD pair which is likely to be pushed up by the bulls so we will buy!
Disclosure: I am part of Trade Nation's Influencer program and receive a monthly fee for using their TradingView charts in my analysis.
❤️ Please, support our work with like & comment! ❤️

AUDNZD: Short Signal Explained
AUDNZD
- Classic bearish formation
- Our team expects fall
SUGGESTED TRADE:
Swing Trade
Sell AUDNZD
Entry Level - 1.0926
Sl - 1.0929
Tp - 1.0920
Our Risk - 1%
Start protection of your profits from lower levels
Disclosure: I am part of Trade Nation's Influencer program and receive a monthly fee for using their TradingView charts in my analysis.
❤️ Please, support our work with like & comment! ❤️

Euro Drops Hard — Is a 100-Pips Slide Toward 1.1500 Next?Euro’s current situation doesn’t look great — we’re clearly seeing strong selling pressure across the board.
Price has now reached the block zones near 1.1600, and I want to break down what this area means to me.
The lower pivot of the 1.1600 zone was created after the 50% level of the previous bullish leg was consumed — which is typical in many bullish trends. Based on that, we expected a move toward 1.1800 to break the structure and continue the uptrend.
However, the recent bullish move lacked strength, which became quite clear during the last upward leg. And now, after that weak rally, we’re witnessing a sharp and aggressive selloff.
This reaction weakens the 1.1600 block in my eyes — and I’m now watching 1.1500 as the more probable target. It’s a major price level and also aligns with a bank-level midline zone.
In my view, it’s still too early to buy. I’d want to see price range and confirm before looking for longs.
That said, this area could be a good place to partially exit short positions and lock in some profits.
🔁 This analysis will be updated whenever necessary.
Disclaimer: This is not financial advice. Just my personal opinion!!!
