AUDCHF: Expecting Bullish Movement! Here is Why:
Our strategy, polished by years of trial and error has helped us identify what seems to be a great trading opportunity and we are here to share it with you as the time is ripe for us to buy AUDCHF.
Disclosure: I am part of Trade Nation's Influencer program and receive a monthly fee for using their TradingView charts in my analysis.
❤️ Please, support our work with like & comment! ❤️
Smartmoney

EURGBP: Bearish Forecast & Bearish Scenario
Looking at the chart of EURGBP right now we are seeing some interesting price action on the lower timeframes. Thus a local move down seems to be quite likely.
Disclosure: I am part of Trade Nation's Influencer program and receive a monthly fee for using their TradingView charts in my analysis.
❤️ Please, support our work with like & comment! ❤️

GOLD: Long Trading Opportunity
GOLD
- Classic bullish pattern
- Our team expects retracement
SUGGESTED TRADE:
Swing Trade
Buy GOLD
Entry - 3301.5
Stop - 3295.3
Take - 3312.0
Our Risk - 1%
Start protection of your profits from lower levels
Disclosure: I am part of Trade Nation's Influencer program and receive a monthly fee for using their TradingView charts in my analysis.
❤️ Please, support our work with like & comment! ❤️

XAUUSD Breakout from Bullish Flag – Eyes on $3,387Gold (XAUUSD) on the 1H timeframe is exhibiting a strong bullish continuation setup, supported by multiple confluences that suggest the uptrend is far from over. The chart clearly shows the market breaking out from a Bullish Flag Pattern, respecting curve support, and targeting the major resistance zone near $3,387.
🔍 Technical Breakdown:
1. Bullish Flag Pattern Formation
After a sharp bullish impulse, price consolidated in a tight downward-sloping channel — the classic bullish flag. This pattern typically appears mid-trend and signals a healthy pause before the next leg higher. The breakout from the flag confirms bullish continuation, often offering a high-probability trade entry.
2. Break of Structure (BOS)
The breakout above minor resistance marked a Break of Structure (BOS), which is a key bullish signal. It indicates a shift in market sentiment and validates the end of the corrective phase (flag) and beginning of the next impulse wave.
3. Curve Support (Parabolic Trajectory)
A parabolic curve support is now guiding price upward, showing increasing bullish pressure and higher lows forming consistently. This type of dynamic support often appears in strong trending markets where buyers step in aggressively at every pullback.
4. Liquidity Sweep & Smart Money Behavior
Before the breakout, price dipped below recent lows within the flag, likely sweeping liquidity and triggering stop-losses. This move provided institutional players with the liquidity needed to push price higher — a classic smart money trap-and-break scenario.
5. Volume & Momentum Confirmation
The breakout occurred with strong bullish momentum and rising volume (if checked on the volume profile), reinforcing the credibility of this move. A momentum-based continuation is likely as long as price remains above previous resistance (now support).
🎯 Target & Resistance Levels:
Short-Term Target: $3,387 — aligned with the previous major resistance area
Support Zone: $3,260–$3,275 (previous flag breakout + structure support)
Major Resistance Zone: Around $3,360–$3,387 (historical supply zone)
🧠 Trade Idea / Strategy:
As long as price holds above the curve support and retests the previous breakout zone (flag top or minor resistance), bullish entries on pullbacks are favored.
✅ Buy on dips into curve support or minor resistance retests.
❌ Avoid shorting into a strong parabolic structure unless signs of exhaustion appear.
🎯 Potential RR setups: 1:2 and beyond if entry is timed well.
💬 Conclusion:
The market structure, pattern confirmation, and strong bullish momentum all point toward a continuation move toward the $3,387 level. This setup provides a solid technical case for bullish trades with multiple entry options and well-defined risk levels. Keep an eye on curve support and potential higher timeframe resistance reactions for dynamic trade management.

BITCOIN Free Signal! Sell!
Hello,Traders!
BITCOIN keep growing in a
Strong uptrend but the price
Will soon hit an an all-time-high
Price around 109,400$ which
Is also a resistance from where
We can go short with the
Take Profit of 103,900$
And the Stop Loss of 109,739$
Sell!
Comment and subscribe to help us grow!
Check out other forecasts below too!
Disclosure: I am part of Trade Nation's Influencer program and receive a monthly fee for using their TradingView charts in my analysis.

EUR_USD BULLISH BREAKOUT|LONG|
✅EUR_USD made a bullish
Breakout of the key horizontal
Level of 1.1287 and the breakout
Is confirmed so we are bullish
Biased and we will be expecting
A further bullish move up
After a potential local
Retest of the new support
LONG🚀
✅Like and subscribe to never miss a new idea!✅
Disclosure: I am part of Trade Nation's Influencer program and receive a monthly fee for using their TradingView charts in my analysis.

AUD-CAD Local Long! Buy!
Hello,Traders!
AUD-CAD will soon hit
A horizontal support level
Of 0.8888 after a sharp
Fall down but its a strong
Support so we will be
Expecting a rebound and
A local move up
Buy!
Comment and subscribe to help us grow!
Check out other forecasts below too!
Disclosure: I am part of Trade Nation's Influencer program and receive a monthly fee for using their TradingView charts in my analysis.

CHFJPY: Long Trade Explained
CHFJPY
- Classic bullish setup
- Our team expects bullish continuation
SUGGESTED TRADE:
Swing Trade
Long CHFJPY
Entry Point - 173.57
Stop Loss - 173.03
Take Profit - 174.53
Our Risk - 1%
Start protection of your profits from lower levels
Disclosure: I am part of Trade Nation's Influencer program and receive a monthly fee for using their TradingView charts in my analysis.
❤️ Please, support our work with like & comment! ❤️

CADJPY: Long Trade with Entry/SL/TP
CADJPY
- Classic bullish formation
- Our team expects growth
SUGGESTED TRADE:
Swing Trade
Buy CADJPY
Entry Level - 103.60
Sl - 103.05
Tp - 104.64
Our Risk - 1%
Start protection of your profits from lower levels
Disclosure: I am part of Trade Nation's Influencer program and receive a monthly fee for using their TradingView charts in my analysis.
❤️ Please, support our work with like & comment! ❤️

EURUSD: Weak Market & Bearish Continuation
Remember that we can not, and should not impose our will on the market but rather listen to its whims and make profit by following it. And thus shall be done today on the EURUSD pair which is likely to be pushed down by the bears so we will sell!
Disclosure: I am part of Trade Nation's Influencer program and receive a monthly fee for using their TradingView charts in my analysis.
❤️Please, support our work with like & comment!❤️

AUDUSD: Bullish Forecast & Bullish Scenario
The recent price action on the AUDUSD pair was keeping me on the fence, however, my bias is slowly but surely changing into the bullish one and I think we will see the price go up.
Disclosure: I am part of Trade Nation's Influencer program and receive a monthly fee for using their TradingView charts in my analysis.
❤️ Please, support our work with like & comment! ❤️

GBP_NZD WILL GROW|LONG|
✅GBP_NZD has retested a key support level of 2.2520
And as the pair is already making a bullish rebound
A move up to retest the supply level above at 2.2600 is likely
LONG🚀
✅Like and subscribe to never miss a new idea!✅
Disclosure: I am part of Trade Nation's Influencer program and receive a monthly fee for using their TradingView charts in my analysis.

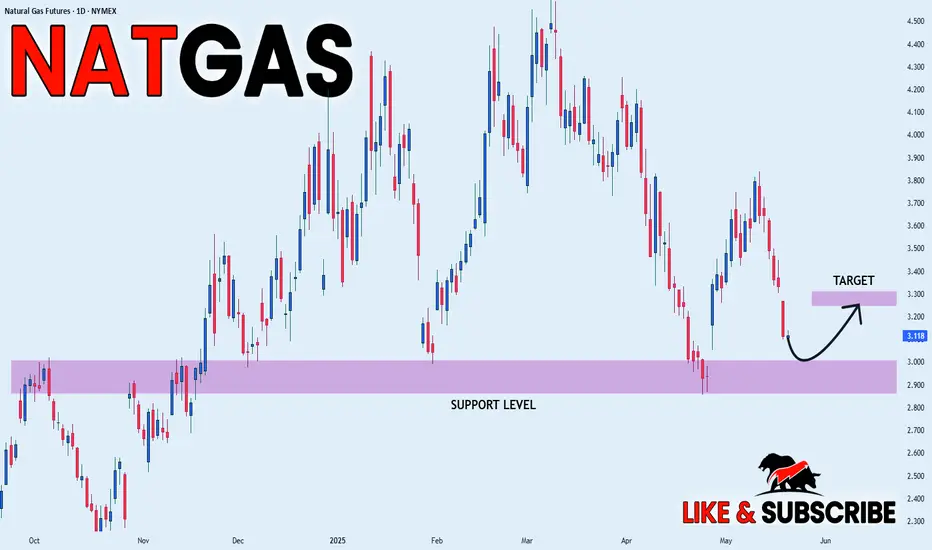
NATGAS SWING LONG|
✅NATGAS is set to retest a
Strong support level below at 2.90$
After trading in a local downtrend from some time
Which makes a bullish rebound a likely scenario
With the target being a local resistance above at 3.26$
LONG🚀
✅Like and subscribe to never miss a new idea!✅
Disclosure: I am part of Trade Nation's Influencer program and receive a monthly fee for using their TradingView charts in my analysis.
GBP-AUD Double Top Pattern! Sell!
Hello,Traders!
GBP-AUD made a retest
Of the horizontal resistance
Level of 2.0820, then
Established a double-top
Pattern and is now going
Down so we are locally
Bearish biased which
Means that we will be
Expecting a further
Bearish move down
Sell!
Comment and subscribe to help us grow!
Check out other forecasts below too!
Disclosure: I am part of Trade Nation's Influencer program and receive a monthly fee for using their TradingView charts in my analysis.

EUR_USD WILL GO DOWN|SHORT|
✅EUR_USD has retested a
Resistance level of 1.1290
And we are seeing a bearish reaction
With the price going down so we are
Bearish biased now and we will be
Expecting the pair to go further down
SHORT🔥
✅Like and subscribe to never miss a new idea!✅
Disclosure: I am part of Trade Nation's Influencer program and receive a monthly fee for using their TradingView charts in my analysis.

GBPNZD: Bears Will Push Lower
GBPNZD
- Classic bearish formation
- Our team expects fall
SUGGESTED TRADE:
Swing Trade
Sell GBPNZD
Entry Level - 2.2555
Sl - 2.2624
Tp - 2.2425
Our Risk - 1%
Start protection of your profits from lower levels
Disclosure: I am part of Trade Nation's Influencer program and receive a monthly fee for using their TradingView charts in my analysis.
❤️ Please, support our work with like & comment! ❤️

EURCAD: Market Sentiment & Price Action
Balance of buyers and sellers on the EURCAD pair, that is best felt when all the timeframes are analyzed properly is shifting in favor of the sellers, therefore is it only natural that we go short on the pair.
Disclosure: I am part of Trade Nation's Influencer program and receive a monthly fee for using their TradingView charts in my analysis.
❤️ Please, support our work with like & comment! ❤️

GBPAUD: Growth & Bullish Forecast
It is essential that we apply multitimeframe technical analysis and there is no better example of why that is the case than the current GBPAUD chart which, if analyzed properly, clearly points in the upward direction.
Disclosure: I am part of Trade Nation's Influencer program and receive a monthly fee for using their TradingView charts in my analysis.
❤️ Please, support our work with like & comment! ❤️

GOLD: Short Trade Explained
GOLD
- Classic bearish formation
- Our team expects pullback
SUGGESTED TRADE:
Swing Trade
Short GOLD
Entry - 3234.0
Sl - 3241.7
Tp - 3216.0
Our Risk - 1%
Start protection of your profits from lower levels
Disclosure: I am part of Trade Nation's Influencer program and receive a monthly fee for using their TradingView charts in my analysis.
❤️ Please, support our work with like & comment! ❤️

XAGUSD (BOS + Supply + OTE + Volume)Hello traders!
I expecting reaction from supply zone, target you have.
Need confirmation on 1-3min.
Have a profitable day and don't forget to subscribe for updates!

BITCOIN CORRECTION AHEAD|SHORT|
✅BITCOIN keeps growing in a
Strong uptrend in a narrowing
Bearish wedge pattern and the
Coin has reached a horizontal
Resistance level of 108000$
So IF we see a breakout from
The wedge a local bearish
Correction is to be expected
SHORT🔥
✅Like and subscribe to never miss a new idea!✅
Disclosure: I am part of Trade Nation's Influencer program and receive a monthly fee for using their TradingView charts in my analysis.

EUR/USD is Loading a Breakout?!EUR/USD has posted an interesting bullish reaction following a controlled descent within a descending channel.
After a brief break below a long-term ascending trendline, price established support within a clear demand zone between 1.1130 and 1.1170, closing the daily candle back above the key area.
This structure suggests a possible phase of accumulation, especially given the presence of a strong lower wick and the defense of the highlighted yellow zone. Still, the pair remains within the descending channel, and the squeeze between the trendline and resistance at 1.1280 could become a decision zone. A daily close above 1.1280 would support bullish continuation and open the way to 1.1450.
🧠 Institutional Positioning (COT):
Large speculators continue to favor the long side on the euro, with a noticeable increase in net long exposure. This confirms the accumulation narrative visible on the chart.
Meanwhile, the USD shows a consistent decline in bullish positioning, adding weight to the case for a softer dollar — supportive of a potential EUR breakout.
📊 Retail Sentiment:
Retail traders are slightly skewed to the short side (52% short), which is not extreme but does act as a contrarian input favoring bullish continuation — especially if the price breaks above dynamic resistance.
📅 Seasonality (May):
Historically, May tends to be a weak-to-neutral month for EUR/USD over the 10–20Y horizon. However, recent years (last 2Y) show a bullish deviation from that trend, supporting the idea that any dips could offer opportunity rather than signal trend reversals.
🧭 Summary
📈 Directional Bias: Moderately Bullish
❌ Invalidation: Daily close below 1.1130
🎯 Target Levels:
• Key Resistance: 1.1280
• Extension Zone: 1.1450
🧠 Key Takeaway:
EUR/USD is showing early signs of bullish reversal within a still-constrained technical structure. Demand rejection, institutional long bias, and retail short pressure all align for a potential continuation higher. However, a confirmed breakout above 1.1280 is crucial to validate the scenario.

NZD-JPY Bearish Breakout! Sell!
Hello,Traders!
NZD-JPY made a bearish
Breakout of the rising support
Line then made a retest of the
New resistance and is going
Down now so we are bearish
Biased and we will be expecting
A further bearish move down
Sell!
Comment and subscribe to help us grow!
Check out other forecasts below too!
Disclosure: I am part of Trade Nation's Influencer program and receive a monthly fee for using their TradingView charts in my analysis.
