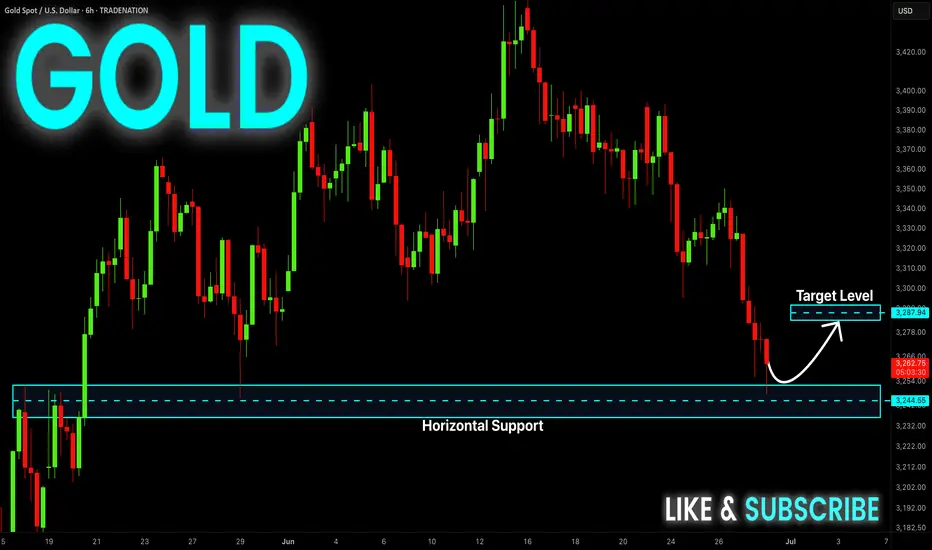
GOLD Support Ahead! Buy!
Hello,Traders!
GOLD keeps falling just
As I predicted but the price
Will soon hit a horizontal support
Around 3235$ from where we
Will be expecting a local
Bullish rebound
Buy!
Comment and subscribe to help us grow!
Check out other forecasts below too!
Disclosure: I am part of Trade Nation's Influencer program and receive a monthly fee for using their TradingView charts in my analysis.
Smartmoney
EUR_AUD LOCAL SHORT|
✅EUR_AUD is going up now
But a strong resistance level is ahead at 1.8018
Thus I am expecting a pullback
And a move down towards the target of 1.7900
SHORT🔥
✅Like and subscribe to never miss a new idea!✅
Disclosure: I am part of Trade Nation's Influencer program and receive a monthly fee for using their TradingView charts in my analysis.

Waiting for the Liquidity Flush – Will We Get That Drop or a StoCurrently holding a short position and have been waiting for a decent liquidity flush towards my TP zone for almost a day now. The thing that bothers me is how slow the price action is—it's grinding lower, but at the same time, building up a new liquidity shelf just above my entry.
This makes me concerned that we might see a quick liquidity sweep to the upside (taking out stops, possibly including mine) before any real move down happens. The area around my TP is loaded with liquidity, but the market seems hesitant to make that push.
What’s your opinion—are we likely to get that clean drop soon, or should we brace for a fake-out and stop hunt first?

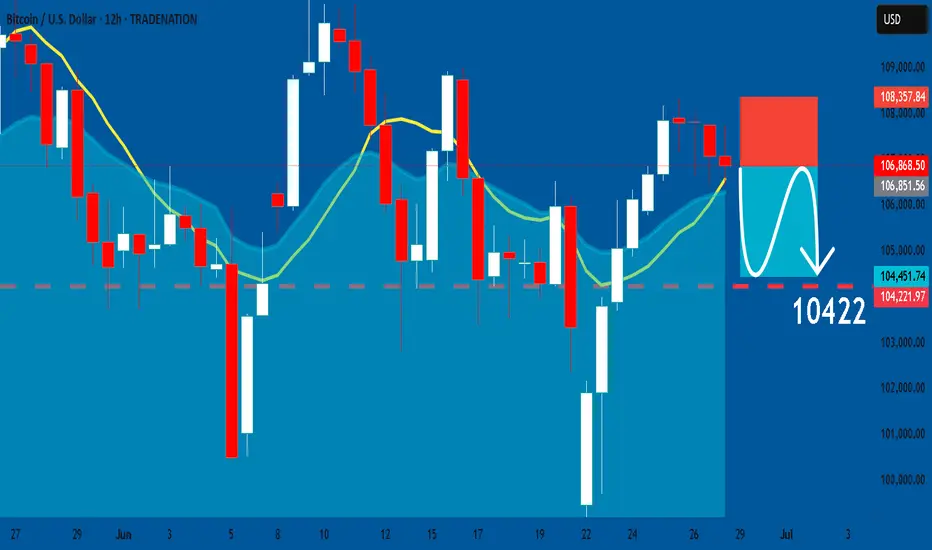
BTCUSD: Bearish Continuation & Short Signal
BTCUSD
- Classic bearish pattern
- Our team expects retracement
SUGGESTED TRADE:
Swing Trade
Sell BTCUSD
Entry - 10686
Stop - 10837
Take - 10422
Our Risk - 1%
Start protection of your profits from lower levels
Disclosure: I am part of Trade Nation's Influencer program and receive a monthly fee for using their TradingView charts in my analysis.
❤️ Please, support our work with like & comment! ❤️
EURUSD: Short Trading Opportunity
EURUSD
- Classic bearish setup
- Our team expects bearish continuation
SUGGESTED TRADE:
Swing Trade
Short EURUSD
Entry Point - 1.1717
Stop Loss - 1.1764
Take Profit - 1.1614
Our Risk - 1%
Start protection of your profits from lower levels
Disclosure: I am part of Trade Nation's Influencer program and receive a monthly fee for using their TradingView charts in my analysis.
❤️ Please, support our work with like & comment! ❤️

GBPCHF: Will Start Growing! Here is Why
The charts are full of distraction, disturbance and are a graveyard of fear and greed which shall not cloud our judgement on the current state of affairs in the GBPCHF pair price action which suggests a high likelihood of a coming move up.
Disclosure: I am part of Trade Nation's Influencer program and receive a monthly fee for using their TradingView charts in my analysis.
❤️ Please, support our work with like & comment! ❤️

NATGAS: Forecast & Trading Plan
The analysis of the NATGAS chart clearly shows us that the pair is finally about to tank due to the rising pressure from the sellers.
Disclosure: I am part of Trade Nation's Influencer program and receive a monthly fee for using their TradingView charts in my analysis.
❤️ Please, support our work with like & comment! ❤️

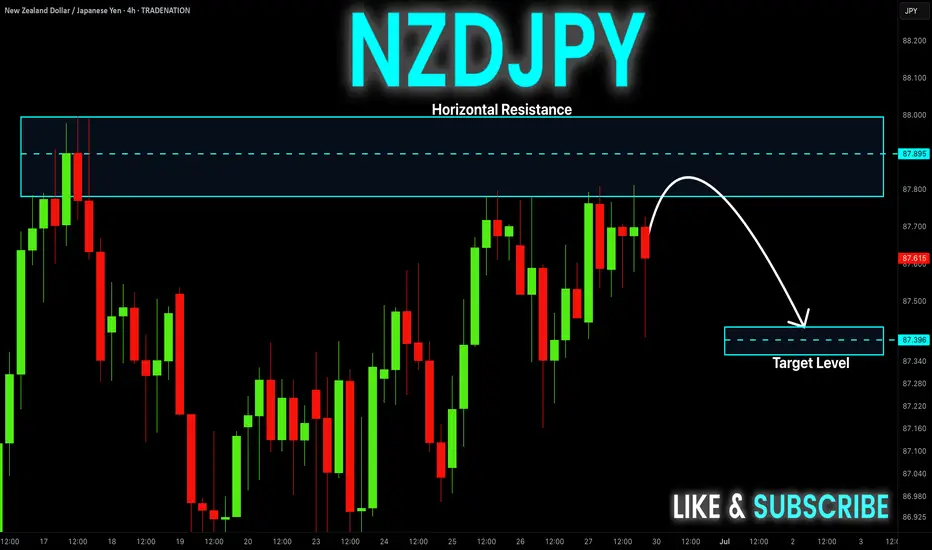
NZD-JPY Potential Short! Sell!
Hello,Traders!
NZD-JPY is slowly approaching
A horizontal resistance level
Around 87.994 so despite
The strong uptrend
We will be expecting a
Local bearish pullback on Monday
Sell!
Comment and subscribe to help us grow!
Check out other forecasts below too!
Disclosure: I am part of Trade Nation's Influencer program and receive a monthly fee for using their TradingView charts in my analysis.
DXY Swing Short! Sell!
Hello,Traders!
DXY keeps falling down
And the index broke the
Key wide horizontal level
Around 97.800 which is now
A resistance and the breakout
Is confirmed so we are very
Bearish biased and we will
Be expecting a bearish
Continuation on Monday
Sell!
Comment and subscribe to help us grow!
Check out other forecasts below too!
Disclosure: I am part of Trade Nation's Influencer program and receive a monthly fee for using their TradingView charts in my analysis.

GBP_CHF RISKY LONG|
✅GBP_CHF fell down sharply
But a strong support level was hit at 1.0932
Thus as a rebound is already happening
A move up towards the target of 1.0970 shall follow
LONG🚀
✅Like and subscribe to never miss a new idea!✅
Disclosure: I am part of Trade Nation's Influencer program and receive a monthly fee for using their TradingView charts in my analysis.

NZD_JPY SHORT FROM RESISTANCE|
✅NZD_JPY is set to retest a
Strong resistance level above at 88.000
After trading in a local uptrend for some time
Which makes a bearish pullback a likely scenario
With the target being a local support below at 87.341
SHORT🔥
✅Like and subscribe to never miss a new idea!✅
Disclosure: I am part of Trade Nation's Influencer program and receive a monthly fee for using their TradingView charts in my analysis.

CHF-JPY Local Long! Buy!
Hello,Traders!
CHF-JPY is trading in a strong
Uptrend and the pair made a
Bullish breakout from the bullish
Triangle pattern and is now seems
To be consolidating above the
Support cluster around 180.740
So we are bullish biased and
We will be expecting a further
Bullish move up on Monday
Buy!
Comment and subscribe to help us grow!
Check out other forecasts below too!
Disclosure: I am part of Trade Nation's Influencer program and receive a monthly fee for using their TradingView charts in my analysis.

AUD_NZD LOCAL LONG|
✅AUD_NZD is trading along the rising support line
And as the pair is going up now
After the retest of the line
I am expecting the price to keep growing
To retest the supply levels above at 1.0789
LONG🚀
✅Like and subscribe to never miss a new idea!✅
Disclosure: I am part of Trade Nation's Influencer program and receive a monthly fee for using their TradingView charts in my analysis.

USD-CHF Will Fall! Sell!
Hello,Traders!
USD-CHF keeps falling down
And the pair broke the key
Horizontal level of 0.8090
Decisively so we are bearish
Biased and we will be expecting
A further move down next week
Sell!
Comment and subscribe to help us grow!
Check out other forecasts below too!
Disclosure: I am part of Trade Nation's Influencer program and receive a monthly fee for using their TradingView charts in my analysis.

DXY STRONG DOWNTREND CONTINUES|SHORT|
✅DXY is going down currently
In a strong downtrend and the index
Broke the key structure level of 98.000
Which is now a resistance,
And after the pullback
And retest, I think the price
Will go further down next week
SHORT🔥
✅Like and subscribe to never miss a new idea!✅
Disclosure: I am part of Trade Nation's Influencer program and receive a monthly fee for using their TradingView charts in my analysis.

EUR-NZD Bullish Bias! Buy!
Hello,Traders!
EUR-NZD is trading in a
Strong uptrend and the pair
Is printing higher highs and
Higher lows while breaking
Important key levels such
As 1.9270 which is now
A support and the pair
Is consolidating above the
New support so we are
Bullish biased and we will
Be expecting a further move
Further up on Monday
Buy!
Comment and subscribe to help us grow!
Check out other forecasts below too!
Disclosure: I am part of Trade Nation's Influencer program and receive a monthly fee for using their TradingView charts in my analysis.

USOIL: Long Trading Opportunity
USOIL
- Classic bullish pattern
- Our team expects retracement
SUGGESTED TRADE:
Swing Trade
Buy USOIL
Entry - 65.03
Stop - 62.60
Take - 69.73
Our Risk - 1%
Start protection of your profits from lower levels
Disclosure: I am part of Trade Nation's Influencer program and receive a monthly fee for using their TradingView charts in my analysis.
❤️ Please, support our work with like & comment! ❤️

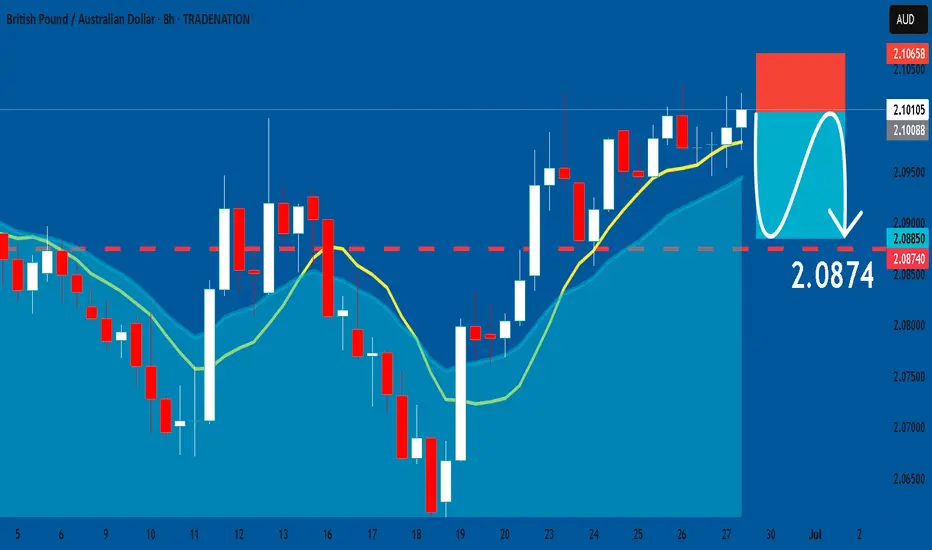
GBPAUD: Short Trade Explained
GBPAUD
- Classic bearish formation
- Our team expects fall
SUGGESTED TRADE:
Swing Trade
Sell GBPAUD
Entry Level - 2.1010
Sl - 2.1065
Tp - 2.0874
Our Risk - 1%
Start protection of your profits from lower levels
Disclosure: I am part of Trade Nation's Influencer program and receive a monthly fee for using their TradingView charts in my analysis.
❤️ Please, support our work with like & comment! ❤️
SPY: Bearish Continuation is Expected! Here is Why:
Looking at the chart of SPY right now we are seeing some interesting price action on the lower timeframes. Thus a local move down seems to be quite likely.
Disclosure: I am part of Trade Nation's Influencer program and receive a monthly fee for using their TradingView charts in my analysis.
❤️ Please, support our work with like & comment! ❤️

SILVER: Bulls Will Push
The price of SILVER will most likely increase soon enough, due to the demand beginning to exceed supply which we can see by looking at the chart of the pair.
Disclosure: I am part of Trade Nation's Influencer program and receive a monthly fee for using their TradingView charts in my analysis.
❤️ Please, support our work with like & comment! ❤️

GBP-CHF Rebound Ahead! Buy!
Hello,Traders!
GBP-CHF is hovering above
The wide horizontal demand
Level around 1.0926 from
Where we are already
Seeing a bullish rebound
So a further local bullish
Move up is to be expected
Buy!
Comment and subscribe to help us grow!
Check out other forecasts below too!
Disclosure: I am part of Trade Nation's Influencer program and receive a monthly fee for using their TradingView charts in my analysis.

GOLD 4H: not all that glitters is bullish...The 4H chart shows a clean descending triangle breakdown. Price failed to reclaim the trendline and was rejected under both MA50 and MA200. The bounce into 3325–3340 was absorbed — classic liquidity sweep and fade. Volume confirms bearish control.
Technically, the breakdown below 3320 opens the way toward $3293 (1.0 Fibo), $3250 (1.272 extension), and final target at $3195 (1.618), where buyers might step in. RSI supports the continuation without signs of reversal. Structure broke — and the market is telling us where it's heading.
Tactical plan:
— Entry at market or on a retest of $3325–3335
— Targets: $3293 → $3250 → $3195
— Stop: above $3340 (above MA50 and broken trendline)
When gold looks shiny, smart traders look deeper. This breakout isn’t golden — it’s a trap for late bulls.

Soybeans Crashing Into Demand — Reversal Coming or Trap?1. COT REPORT — Updated June 17, 2025
📌 Non-Commercials (Speculators)
Long: +5,661 → 195,984
Short: -9,226 → 110,761
✅ Net Long Increase: A clear bullish shift in speculative positioning (+14,887 net contracts). This is an early indication of a sentiment reversal.
📌 Commercials (Hedgers / Producers)
Long: +6,023
Short: -5,806
➡️ The decrease in net shorts suggests improving confidence among institutional players.
📌 Total Open Interest: 846,169 (down by 12,776)
❗ This slight drop may be linked to position rotation or partial profit-taking.
2. NET POSITIONS CHART INSIGHT
Commercial traders remain structurally net short, but their exposure has been gradually declining since March.
Non-commercial traders have increased their net long positions since April, aligned with the price's technical recovery.
The current price is trading near the historical mean, indicating neutral conditions with potential room for further upside.
🕰️ 3. SEASONALITY OUTLOOK
The June–July period has historically been bearish:
June Average Performance:
Last 5 years: -39.61
Last 2 years: -38.71
July Average Performance:
Last 20 years: -44.82
Last 2 years: -34.73
📉 August and September typically continue this seasonal downtrend.
🟨 Caution is advised on initiating long positions during this phase.
📊 4. TECHNICAL OUTLOOK —
Current Structure:
Rising channel has broken to the downside with a strong bearish impulse candle.
RSI is neutral but previously showed bearish divergence.
Key Support Zones:
1035–1025: Intermediate support area already tested.
1012–994: Golden Pocket aligned with a demand block — likely target zone with high potential for reaction.
Possible Scenarios:
🔴 Bearish Continuation: A retracement followed by a move down into the 994–1000 range, where a tactical long setup may emerge.
🔵 Bull Trap and Reversal: A rapid recovery above 1050, potentially triggering a continuation to 1080 (range top).
5. EXECUTION SUMMARY
Primary Bias: Bearish in the short term
🎯 Target Zone: 994–1000
🛑 Invalidation Level: Weekly close above 1055
Tactical Long Setup: Monitor price action at 994–1000 for bullish reaction.
Macro context and speculative positioning suggest a structural bottom may develop in Q3 2025, but current conditions are not yet favorable for a full swing position.

CADCHF at the Cliff's Edge – Is a Breakdown Imminent? 🧭 Technical Context
Price is currently sitting at the key support area of 0.5890–0.5900, tested multiple times since April.
This week’s candlestick shows a clear close below the intermediate micro-structure (two consecutive closes under recent lows), confirming bearish pressure.
The weekly RSI remains in a neutral-to-low zone, trending downwards with no active bullish divergence.
📉 Technical Conclusion: Active bearish bias. Watch out for potential false breaks below 0.5890 as liquidity traps.
📊 COT Report – as of June 17, 2025
🇨🇦 CAD
Non-Commercials: added +8.5k long contracts, aggressively cut −18.3k shorts
→ Excessive optimism, potential exhaustion on the buy-side
Commercials: added +31k shorts
→ Typical hedge behavior – signaling protection from CAD devaluation
🇨🇭CHF
Net positions in gradual decline with no sharp moves → CHF remains in consolidation, with a defensive tone
Open Interest dropped by −19.5k → Institutional money exiting positions
→ Interpretation: Market likely preparing for a directional breakout, CHF could act as a safe haven
📉 COT Conclusion: CAD appears overbought, CHF still gathering strength. Bearish bias on CADCHF remains intact.
📅 Seasonality – June Pattern
CHF tends to strengthen in June:
+0.0095 (10Y average), +0.0068 (5Y average)
CAD shows structural weakness in June:
−0.0027 (10Y), −0.0076 (5Y)
📉 Seasonality Conclusion: June favors CAD weakness and CHF strength → Bearish confirmation for CADCHF
🧠 Retail Sentiment
92% of retail traders are long CADCHF, only 8% are short
→ Extreme imbalance = classic contrarian signal
📉 Sentiment Conclusion: Confirms potential for continued downside on CADCHF
✅ Trade Plan Summary
📌 Base scenario:
Short CADCHF if we get a daily/weekly close below 0.5890
🎯 Target 1: 0.5820
🎯 Target 2: 0.5770
🚫 Invalidation: daily close above 0.5960 (invalidates current setup)
📌 Alternative scenario:
Short from 0.5960–0.6000 if we get a bearish rejection pattern → ideal for better R/R
