BTCUSD Technical Analysis (Smart Money Concepts) BTCUSD Technical Analysis (Smart Money Concepts)
Market Structure Overview:
Break of Structure (BOS) observed multiple times confirms a strong bearish trend.
Change of Character (CHoCH) around 30th July indicated initial shift from bullish to bearish intent.
Price has been forming lower highs and lower lows, respecting the bearish structure.
Key Zones:
🔴 Previous Resistance Zone (119,000 - 120,500)
Strong supply area from where price sharply reversed.
Also aligned with a Strong High marked at ~$120,000 – key for any future bullish invalidation.
🟫 Current Target Zone – 116,000
Acts as an immediate imbalance fill/FVG retracement zone.
Target highlighted as potential retracement point before continuing lower.
🟦 Liquidity / Fair Value Gap (FVG) Zone
Located between ~115,800 and 114,500.
Price may aim to revisit this zone on pullback, filling inefficiencies.
🟩 Support Zone (~113,000)
Price currently reacting near this zone.
This area has acted as a demand zone in the past and is expected to provide short-term support.
Volume Profile & Order Flow:
Visible Range Volume Profile shows heavy activity near the resistance cluster, indicating strong distribution by institutional players.
Low volume in the FVG area further confirms inefficiency and potential for a retracement move.
Smart Money Perspective:
The current structure reflects distribution at highs, followed by markdown phase.
Price swept liquidity below local lows and may now seek to mitigate previous supply or FVG around 116,000 before resuming bearish trend.
📌 Conclusion:
Bias: Bearish until 116K is tested and rejected.
Next Move Expectation: Possible liquidity sweep → bounce to 116K → short continuation.
Invalidation Level: Break and close above 117K would signal strength returning.
✅ Educational Note:
This is a classic Smart Money trap setup — liquidity grab near lows, fakeout pump to FVG, and potential short continuation. Traders should be cautious of fake rallies into known supply zones.
Smartmoneyconcept

BTCUSD Technical Analysis – Bearish Momentum Towards Fair Value BTCUSD Technical Analysis – Bearish Momentum Towards Fair Value Gap
Bitcoin is showing clear bearish pressure after rejecting from the previous resistance zone around 118,800 – 120,000. The market structure and smart money concepts indicate potential for further downside.
🔍 Key Observations:
Previous Resistance Respected: Price failed to break through the strong resistance zone marked near the 119,200–120,000 level, showing strong institutional selling interest.
Market Structure Breaks:
BOS (Break of Structure) and CHoCH (Change of Character) confirmed bearish shift.
Price has maintained lower highs and lower lows, signaling a bearish trend.
Liquidity/Fair Value Gap Zone: The market is currently targeting the liquidity/FVG zone between 116,400 – 116,100, which aligns with price inefficiency and unfilled orders.
Support Zone Ahead: A strong support zone is visible near 115,600 – 115,200. Expect a potential reaction or consolidation here.
📌 Strategy & Bias:
Short Bias Active until price reaches 116,116 (target).
Watch for possible bullish reversal signs in the support/FVG zone.
Ideal for scalp-to-swing short trades, with tight SL above recent EQH.
📚 Educational Notes:
Fair Value Gaps (FVG) indicate institutional imbalances and are often revisited by price.
CHoCH and BOS are early signals of smart money moves – always monitor them in confluence with volume and zones.

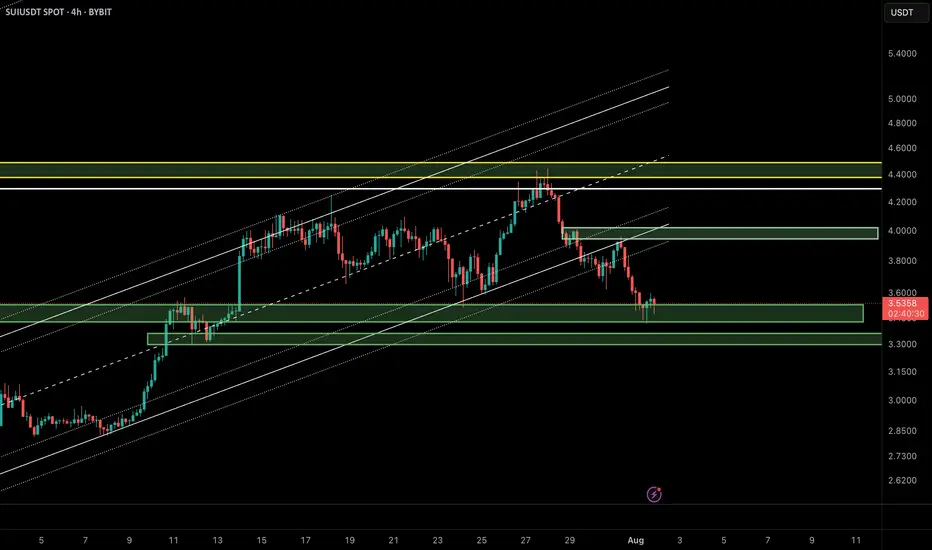
SUI/USDT Update – Bounce Setup from Demand Zone?In the previous analysis, we highlighted a short opportunity near $4.20, which played out perfectly. Now, SUI has reached a key demand zone around $3.40–$3.55, overlapping with the lower boundary of the ascending channel and a previously defined bullish order block.
🔹 Market Structure:
After breaking the bullish structure, price is now revisiting a major liquidity zone between $3.40 and $3.55.
🔹 Price Behavior:
Wicks to the downside suggest buy-side absorption and potential for short-term reversal.
🔹 Possible Scenario:
If the $3.40 zone holds, we could see a corrective move up to the supply zone around $3.90–$4.00.
📌 Key Levels:
• Support: $3.40–$3.55
• Resistance: $3.90–$4.00
❗️If the $3.40 support fails, bullish momentum will likely be invalidated in the short term.
🧠 Pro Tip (SMC-based):
When a demand zone aligns with liquidity sweep and channel support, it often becomes a high-probability area for institutional re-entries. Wait for a clear confirmation like BOS or bullish engulfing candle before entering.
⸻
🔗 Like, share, and follow for more Smart Money & Elliott Wave-based insights!
GOLD Short From Resistance! Sell!
Hello, Traders!
GOLD surged up sharply
On Friday and is already
Retesting the horizontal
Resistance of 3377$
From where we will be
Expecting a local pullback
On Monday as Gold
Is locally overbought
Sell!
Comment and subscribe to help us grow!
Check out other forecasts below too!
Disclosure: I am part of Trade Nation's Influencer program and receive a monthly fee for using their TradingView charts in my analysis.

GBP-JPY Risky Long! Buy!
Hello,Traders!
GBP-JPY collapsed on Friday
And the pair's final move
Was absorbed by the horizontal
Support of 195.400 so as the
Pair is oversold we will be
Expecting a local rebound
And a correction on Monday
Buy!
Comment and subscribe to help us grow!
Check out other forecasts below too!
Disclosure: I am part of Trade Nation's Influencer program and receive a monthly fee for using their TradingView charts in my analysis.

GBP_NZD BEARISH BIAS|SHORT|
✅GBP_NZD has retested
A resistance level of 2.2500
And we are seeing a bearish reaction
With the price going down so we are
Bearish biased now and we will be
Expecting the pair to go further down
SHORT🔥
✅Like and subscribe to never miss a new idea!✅
Disclosure: I am part of Trade Nation's Influencer program and receive a monthly fee for using their TradingView charts in my analysis.

NZD-JPY Local Long! Buy!
Hello,Traders!
NZD-JPY is retsting a
Strong horizontal support
Level around 87.044 and
As the pair is locally
Oversold we will be expecting
A local rebound and a move
Up on Monday!
Buy!
Comment and subscribe to help us grow!
Check out other forecasts below too!
Disclosure: I am part of Trade Nation's Influencer program and receive a monthly fee for using their TradingView charts in my analysis.

GOLD Local Short! Sell!
Hello,Traders!
GOLD made a retest
Of the horizontal resistance
Of 3313$ and we are already
Seeing a bearish reaction and
We will be expecting a further
Bearish move down
Sell!
Comment and subscribe to help us grow!
Check out other forecasts below too!
Disclosure: I am part of Trade Nation's Influencer program and receive a monthly fee for using their TradingView charts in my analysis.

XAUUSD Smart Money Technical Analysis – Bullish Potential XAUUSD Smart Money Technical Analysis – Bullish Potential from Strong Support
Gold (XAUUSD) is currently trading around $3,291.780, showing a potential bullish reversal setup from the strong support zone after a clear liquidity sweep and market structure shifts.
🔍 Key Technical Highlights:
✅ Strong Support Zone (Demand)
Price is reacting from a major demand zone (Strong Low) between $3,275 – $3,225, a level that previously triggered bullish rallies.
Multiple Breaks of Structure (BOS) and CHoCH indicate previous bullish control and a possible re-accumulation phase.
✅ CHoCH Near Support
A recent Change of Character (CHoCH) around the support area shows the first signs of smart money accumulation.
Liquidity below recent lows has been swept, triggering possible bullish intent.
✅ Bullish FVG (Fair Value Gap)
A clear Bullish FVG remains unmitigated around the mid-range, offering target confluence at $3,349.560.
Price may aim to rebalance inefficiency and fill the FVG as part of the bullish move.
✅ Resistance Zone Above
The resistance area near $3,325 – $3,350 acts as a short-term target for long positions.
Further resistance lies at the Buy-Side Liquidity & Weak High zone around $3,450 if momentum sustains.
🧠 Smart Money Concept Interpretation:
Liquidity Grab: Price dipped into strong demand to collect sell-side liquidity before potential reversal.
CHoCH + BOS Alignment: Indicates the market may now transition into a bullish phase.
FVG as Magnet: Price is drawn toward unfilled value zones—ideal for bullish target projection.
🎯 Trade Idea (Educational Purposes Only):
Bias: Bullish
Entry: Around current zone ($3,290)
Target: $3,349.560 (FVG zone)
Invalidation/SL: Below strong low (~$3,225)

CHF_JPY LOCAL SHORT|
✅CHF_JPY has been growing recently
And the pair seems locally overbought
So as the pair is approaching a
Horizontal resistance of 186.000
Price decline is to be expected
SHORT🔥
✅Like and subscribe to never miss a new idea!✅
Disclosure: I am part of Trade Nation's Influencer program and receive a monthly fee for using their TradingView charts in my analysis.

USD_JPY RESISTANCE AHEAD|SHORT|
✅USD_JPY is going up now
But a strong resistance level is ahead at 151.232
Thus I am expecting a pullback
And a move down towards the target of 150.368
SHORT🔥
✅Like and subscribe to never miss a new idea!✅
Disclosure: I am part of Trade Nation's Influencer program and receive a monthly fee for using their TradingView charts in my analysis.

EUR_CHF WILL KEEP FALLING|SHORT|
✅EUR_CHF broke the key
Structure level of 0.9295
While trading in an local downtrend
Which makes me bearish
And I think that after the retest of the
Broken level is complete
A rebound and bearish
Continuation will follow
SHORT🔥
✅Like and subscribe to never miss a new idea!✅
Disclosure: I am part of Trade Nation's Influencer program and receive a monthly fee for using their TradingView charts in my analysis.

EUR-USD Bearish Breakout! Sell!
Hello,Traders!
EUR-USD made a bearish
Breakout of the key horizontal
Level of 1.1460 then made
A retest and a pullback so
We are bearish biased and
We will be expecting a
Further bearish continuation
Sell!
Comment and subscribe to help us grow!
Check out other forecasts below too!
Disclosure: I am part of Trade Nation's Influencer program and receive a monthly fee for using their TradingView charts in my analysis.

BTC/USD – Strong Buy Opportunity from Demand Zone BTC/USD – Strong Buy Opportunity from Demand Zone
🟢 Technical Outlook:
Bitcoin (BTC/USD) has tapped into a well-defined Demand Zone near 115,000–116,000, showing early signs of a potential bullish reversal. This level aligns with key liquidity zones, smart money concepts, and price inefficiencies — offering high-probability long setups.
🧠 Key Technical Highlights:
🔻 Equal Lows + Sell-Side Liquidity:
Market swept equal lows, grabbing liquidity below support — a common institutional setup before a bullish push.
✅ Break of Structure (BOS):
A prior BOS indicates a shift from bearish to bullish structure after liquidity collection.
📉 Fair Value Gap (FVG):
Price created and respected an FVG after the BOS, validating bullish intent.
📊 Imbalance Filled:
A prior price inefficiency has now been filled, completing a clean move from imbalance back into structure.
📈 Target Zone: 119,000 USD
Marked as the logical next stop — sitting near prior resistance and a liquidity zone.
🎓 Educational Insight:
This is a textbook Smart Money Concept scenario:
Sell-side liquidity sweep
Demand zone tap
Imbalance rebalancing
Shift in market structure
It shows how institutions often engineer liquidity grabs before a large directional move.

SILVER WILL FALL|SHORT|
✅SILVER is going up now
But a strong resistance level is ahead at 37,60$
Thus I am expecting a pullback
And a move down towards the target of 36,69$
SHORT🔥
✅Like and subscribe to never miss a new idea!✅
Disclosure: I am part of Trade Nation's Influencer program and receive a monthly fee for using their TradingView charts in my analysis.

CAD_JPY BEARISH BREKAOUT|SHORT|
✅CAD_JPY broke the key structure level of 107.400
While trading in an local downtrend
Which makes me bearish
And I think that after the retest of the broken level is complete
A rebound and bearish continuation will follow
SHORT🔥
✅Like and subscribe to never miss a new idea!✅
Disclosure: I am part of Trade Nation's Influencer program and receive a monthly fee for using their TradingView charts in my analysis.

GBP-AUD Growth Ahead! Buy!
Hello,Traders!
GBP-AUD made a retest
Of the horizontal support
Of 2.0420 and we are
Already seeing a bullish
Rebound so we will be
Expecting a further
Bullish move up
Buy!
Comment and subscribe to help us grow!
Check out other forecasts below too!
Disclosure: I am part of Trade Nation's Influencer program and receive a monthly fee for using their TradingView charts in my analysis.

CHF_JPY RISKY LONG|
✅CHF_JPY has retested a key support level of 182.800
And as the pair is already making a bullish rebound
A move up to retest the supply level above at 183.700 is likely
LONG🚀
✅Like and subscribe to never miss a new idea!✅
Disclosure: I am part of Trade Nation's Influencer program and receive a monthly fee for using their TradingView charts in my analysis.

EUR-AUD Bullish Breakout! Buy!
Hello,Traders!
EUR-AUD made a bullish
Breakout of the falling resistance
And the breakout is confirmed
So we are bullish biased
And we will be expecting
A further bullish move up
On Monday!
Buy!
Comment and subscribe to help us grow!
Check out other forecasts below too!
Disclosure: I am part of Trade Nation's Influencer program and receive a monthly fee for using their TradingView charts in my analysis.

GBP/USD | SMC Roadmap – Clinton Scalper POV🧠 Institutional Structure Overview
GU has been aggressively distributed from the 1.358xx premium zone, creating a strong downward market structure. We now observe:
A clean internal BOS confirming bearish intent
Major liquidity voids left behind
Price currently resting around discount levels (0.236–0.0 zone)
This sets the stage for a "fake recovery" trap before deeper markdown.
📉 Anticipated Smart Money Playbook
🔹 Scenario 1 – Short-Term Internal Rally (Liquidity Grab)
Price may engineer liquidity by forming a corrective retracement toward:
→ First Rejection Zone: ~1.33747 (aligned with fib 0.5 & diagonal internal trendline)
→ Extended Trap Zone: 1.34893 (near fib 0.705 + previous unmitigated OB)
This will allow Smart Money to unload positions before continuation lower. Expect a sharp sell-off post-liquidity sweep.
🔹 Scenario 2 – Continuation Without Full Retrace
If price fails to climb above 1.325xx, we could see an early breakdown after a minor internal rally. Key level to watch:
→ Support-to-Sell Zone: 1.31622
A clean break + retest here opens the way for a bearish expansion toward mid-July lows.
🎯 Key Levels to Monitor
Support Zone: 1.31622 → Valid for potential internal bounce
Short-Term Target if rally forms:
→ 1.33747 → Liquidity Cluster
→ 1.34893 → Final Trap Zone before HTF selloff
Mid-Term Target if breakdown confirmed:
→ 1.3050 → Old demand + final downside imbalance
→ Below 1.30 → Long-term liquidity void
🔍 SMC Takeaways
Premium Zone = Distribution, especially when price is beneath BOS
Discount Zone = Trap/Reload, but not always for bullish continuation
Market seeks efficiency, so every imbalance is eventually filled
True entry is not at key levels, but at confirmations within them (M5/M15 shift after sweep)
🎯 Trade Smart. Think Like Liquidity.
📌 Follow @ClintonScalper for more SMC breakdowns with precision.

AUD-USD Will Go Down! Sell!
Hello,Traders!
AUD-USD is trading in a
Downtrend and the pair
Broke the key horizontal
Level of 0.6470 which is
Now a resistance then
Made a retest and a
Confident pullback which
Reinforces our bearish
Bias and makes us expect
A further bearish move down
Sell!
Comment and subscribe to help us grow!
Check out other forecasts below too!
Disclosure: I am part of Trade Nation's Influencer program and receive a monthly fee for using their TradingView charts in my analysis.

USOIL GROWTH AHEAD|
✅CRUDE OIL broke the key
Structure level of 69.50$
While trading in an local uptrend
Which makes me bullish biased
And I think that after the retest of the broken level is complete
A rebound and bullish continuation will follow
LONG🚀
✅Like and subscribe to never miss a new idea!✅
Disclosure: I am part of Trade Nation's Influencer program and receive a monthly fee for using their TradingView charts in my analysis.

NATGAS Free Signal! Buy!
Hello,Traders!
NATGAS went down and
Almost reached the horizontal
Support of 3.014$ from where
We can enter a long trade
With the Take Profit of 3.066$
And the Stop Loss of 2.981$
Buy!
Comment and subscribe to help us grow!
Check out other forecasts below too!
Disclosure: I am part of Trade Nation's Influencer program and receive a monthly fee for using their TradingView charts in my analysis.
