EURAUD: Possible Swing Movement of 660 pips expected! FX:EURAUD on daily candles of last few days breakthrough and now dropping back to demand zone where we expect price to bounce strongly and at least we expect target one to accomplished by end of January. While target two and three remain a long away from our current price area. Stop Loss should be below the strong wick of daily candle.
From fundamentals side AUD will be weaken and EURO can be bullish for next few months, taking entry will require a strict risk management as this is a swing trade, do not expect to achieve the target in couple of hours or days.
Good luck and trade safe.
Smartmoneyconcept

GBP-NZD Long From Demand Ahead! Buy!
Hello,Traders!
GBP-NZD is making a bearish
Correction but will soon
Retest a wide demand area
Around 2.2539 from where
We will be expecting a
Local rebound a move up
Buy!
Comment and subscribe to help us grow!
Check out other forecasts below too!
Disclosure: I am part of Trade Nation's Influencer program and receive a monthly fee for using their TradingView charts in my analysis.

NZD_USD RIKSY SHORT|
✅NZD_USD has been growing recently
And the pair seems locally overbought
So as the pair is approaching a horizontal resistance of 0.6020
Price decline is to be expected
SHORT🔥
✅Like and subscribe to never miss a new idea!✅
Disclosure: I am part of Trade Nation's Influencer program and receive a monthly fee for using their TradingView charts in my analysis.

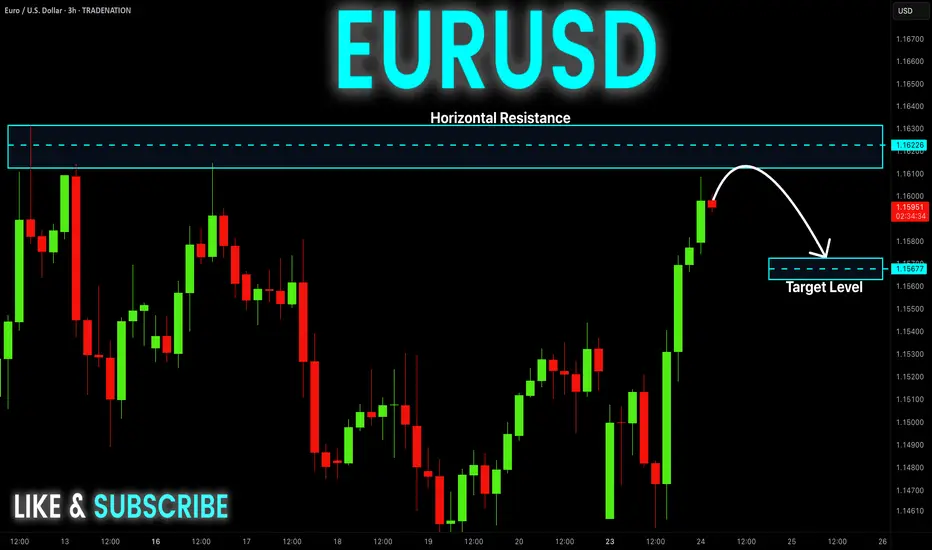
EUR-USD Risky Short! Sell!
Hello,Traders!
EUR-USD made a nice bullish
Move up and has almost reached
A horizontal resistance level
Of 1.1631 and the pair is locally
Overbought so after the retest
A local bearish correction
Is to be expected
Sell!
Comment and subscribe to help us grow!
Check out other forecasts below too!
Disclosure: I am part of Trade Nation's Influencer program and receive a monthly fee for using their TradingView charts in my analysis.
AUD_NZD LOCAL LONG|
✅AUD_NZD has retested a key support level of 1.0800
And as the pair is already making a bullish rebound
A move up to retest the supply level above at 1.0820 is likely
LONG🚀
✅Like and subscribe to never miss a new idea!✅
Disclosure: I am part of Trade Nation's Influencer program and receive a monthly fee for using their TradingView charts in my analysis.

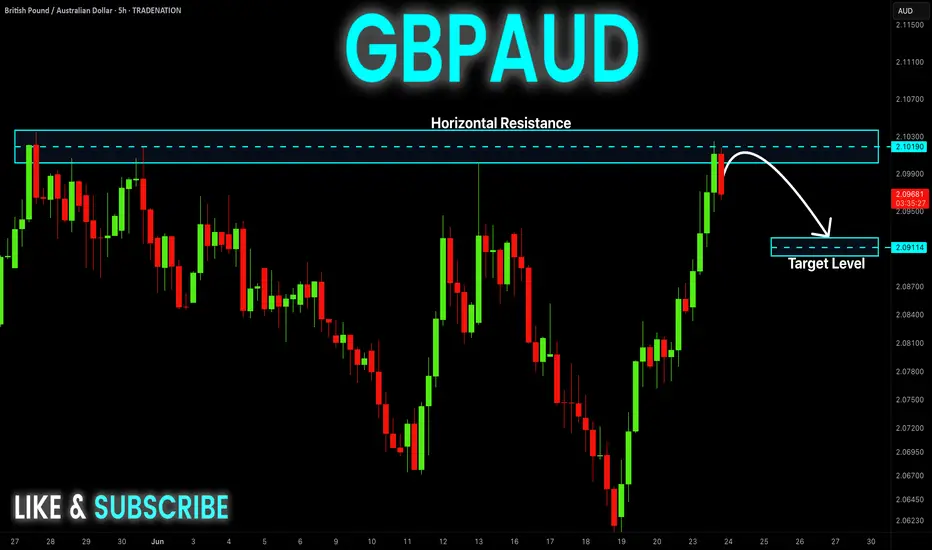
GBP-AUD Local Short! Sell!
Hello,Traders!
GBP-AUD made a retest of
The horizontal resistance
Of 2.1037 from where we
Are already seeing a bearish
Pullback so we will be
Expecting a further local
Move down
Sell!
Comment and subscribe to help us grow!
Check out other forecasts below too!
Disclosure: I am part of Trade Nation's Influencer program and receive a monthly fee for using their TradingView charts in my analysis.
Mastering Inverse Fair Value Gaps (IFVG) - How to use them?In this guide, I’ll explain the concept of the Inverse Fair Value Gap (IFVG), how it forms, and how you can use it to identify high-probability trading opportunities. You'll learn how to spot the IFVG on a chart, understand their significance in price action, and apply a simple strategy to trade them effectively.
What will be discussed?
- What is a FVG
- What is an IFVG
- What is a bullish IFVG
- What is a bearish IFVG
- How to trade the IFVG
-------------------------------
What is a FVG?
A FVG is a technical concept used by traders to identify inefficiencies in price movement on a chart. The idea behind a fair value gap is that during periods of strong momentum, price can move so quickly that it leaves behind a "gap" where not all buy and sell orders were able to be executed efficiently. This gap creates an imbalance in the market, which price may later revisit in an attempt to rebalance supply and demand.
A fair value gap is typically observed within a sequence of three candles (or bars). The first candle marks the beginning of a strong move. The second candle shows a significant directional push, either bullish or bearish, often with a long body indicating strong momentum. The third candle continues in the direction of the move, opening and closing beyond the range of the first candle. The fair value gap itself is defined by the price range between the high of the first candle and the low of the third candle (in the case of a bullish move), or between the low of the first candle and the high of the third (in a bearish move). This range represents the area of imbalance or inefficiency.
-------------------------------
What is an IFVG?
An Inverse Fair Value Gap (IFVG) occurs when a traditional Fair Value Gap (FVG) is not respected by price, and instead of acting as a support or resistance zone, price breaks through it with strength. Normally, a Fair Value Gap represents a price imbalance left by a strong move, and when price returns to this area, it often reacts by respecting the gap, bouncing off it or reversing, because it's seen as a high-probability level where orders may rest.
However, in the case of an IFVG, price does not respect this imbalance. Instead, it slices through the FVG in the opposite direction, showing that the initial momentum behind the imbalance has weakened or reversed. This breach is a strong indication that market sentiment is shifting. What was once a zone of strength now becomes invalid, and this failed reaction signals that the opposite side of the market (buyers or sellers) has taken control.
The IFVG highlights a key transition in momentum. It tells traders that the prior bias, bullish or bearish, is breaking down, and the new dominant force is pushing price beyond levels that would typically hold. This makes the IFVG useful not only as a sign of failed structure but also as a potential confirmation of a trend reversal or strong continuation in the opposite direction. Essentially, where an FVG usually acts as a wall, an IFVG is what’s left after that wall gets knocked down.
-------------------------------
What is a bullish IFVG?
A bullish Inverse Fair Value Gap (IFVG) occurs when price breaks through a bearish Fair Value Gap (FVG) instead of respecting it. In a typical bearish FVG, the expectation is that when price retraces into the gap, it will react to the imbalance, usually by reversing lower, as the area represents previous selling pressure or inefficiency caused by aggressive sellers.
However, when price does not react bearishly and instead breaks cleanly through the bearish FVG, it signals a shift in market sentiment and momentum. This breakout through the imbalance suggests that buyers are now in control and that the bearish pressure in that zone has been absorbed or invalidated. What was once considered a resistance area is now being overpowered, often leading to continued bullish movement.
-------------------------------
What is a bearish IFVG?
A bearish Inverse Fair Value Gap (IFVG) occurs when price breaks through a bullish Fair Value Gap (FVG) instead of respecting it. In a normal bullish FVG, the expectation is that when price returns to the gap, it will act as support and prompt a move higher, as this area represents a previous imbalance created by strong buying pressure.
However, when price fails to respect the bullish FVG and instead breaks down through it, this signals a shift in momentum to the downside. The anticipated support fails to hold, suggesting that buyers are no longer in control or that their efforts have been overwhelmed by aggressive selling. This kind of move transforms the bullish FVG into a bearish signal, as it confirms weakness in what was previously considered a demand zone.
-------------------------------
How to trade the IFVG?
Trading the Inverse Fair Value Gap (IFVG) requires patience, precision, and clear confirmation of a shift in momentum. The process involves waiting for key conditions to form before entering a trade. Here's how to approach it step-by-step:
First, you need to wait for a liquidity sweep. This means price must take out a recent high or low, typically a short-term liquidity pool, trapping traders on the wrong side of the market. This sweep sets the stage for a potential reversal and indicates that the market is ready to shift direction.
After the liquidity sweep, watch for a 1-minute Fair Value Gap (FVG) to form and then get broken in the opposite direction. This break is crucial, it’s what creates the Inverse Fair Value Gap. The invalidation of this initial FVG confirms that momentum has switched and that the market is no longer respecting the previous imbalance.
Once the IFVG has formed, your entry comes on the close of the candle that breaks and closes beyond the IFVG, above it in a bullish scenario, or below it in a bearish one. This close confirms that the gap has not held and that price is likely to continue in the new direction.
Place your stop loss below the low (for a bullish setup) or above the high (for a bearish setup) of the structure that formed the IFVG. This gives you protection just beyond the level that would invalidate the setup.
-------------------------------
Thanks for your support.
- Make sure to follow me so you don't miss out on the next analysis!
- Drop a like and leave a comment!

#GBPJPY: Buyers and Sellers Both Has Equal Chances! Hey there! So, GBPJPY is at a pivotal moment, and we might see a mix of buying and selling activity in the market. Since the bulls aren’t exactly sure what to do next, here’s what we think:
- The GBPJPY pair is having a tough time breaking through the 194 region. The Japanese yen (JPY) is holding steady, making it hard to predict what will happen next. This has made trading JPY pairs a real challenge.
- Looking back at how prices have behaved in similar situations can give us some clues about what might happen in the future. But it’s important to do thorough research before we start trading. Just because something happened in the past doesn’t mean it will happen again.
- The Japanese yen (JPY) also tends to go down when the US dollar (USD) goes up. Since we’re bullish on the DXY index in the coming days, we think the JPY will probably take a hit, and it could go down a lot. It’s also worth keeping an eye on the GBP, which has been one of the most popular currencies since the market opened earlier today.
- In the meantime, we suggest setting two take-profit targets: one at 197 and another at 199. These levels are likely to see a lot of selling activity.
Now, let’s talk about what sellers should do:
- The price is currently in favour of sellers since it dropped from 195.50 to 193.50. And since the last two daily candles closed with strong bearish volume, it looks like the price is going to keep going down.
- If the price breaks below 190.50, that would be a great opportunity for sellers to make some money.
Good luck and trade safely!
Thank you for your unwavering support! 😊
If you’d like to contribute, here are a few ways you can help us:
- Like our ideas
- Comment on our ideas
- Share our ideas
Team Setupsfx_
❤️🚀

NZD-CHF Rebound Ahead! Buy!
Hello,Traders!
NZD-CHF made a retest
Of the horizontal support
Level of 0.4847 from where
We are already seeing a
Bullish rebound so we are
Locally bullish biased and
We will be expecting a
Further bullish move up
Buy!
Comment and subscribe to help us grow!
Check out other forecasts below too!
Disclosure: I am part of Trade Nation's Influencer program and receive a monthly fee for using their TradingView charts in my analysis.

EUR_USD RISING SUPPORT AHEAD|LONG|
✅EUR_USD is trading along the rising support
And as the pair will soon retest it
I am expecting the price to go up
To retest the supply levels above at 1.1511
LONG🚀
✅Like and subscribe to never miss a new idea!✅
Disclosure: I am part of Trade Nation's Influencer program and receive a monthly fee for using their TradingView charts in my analysis.

EUR_NZD WILL KEEP GROWING|LONG|
✅EUR_NZD is going up
Now and the pair made a bullish
Breakout of the key horizontal
Level of 1.9250 and the breakout
Is confirmed so we are bullish
Biased and we will be expecting
A further bullish move up on Monday
LONG🚀
✅Like and subscribe to never miss a new idea!✅
Disclosure: I am part of Trade Nation's Influencer program and receive a monthly fee for using their TradingView charts in my analysis.

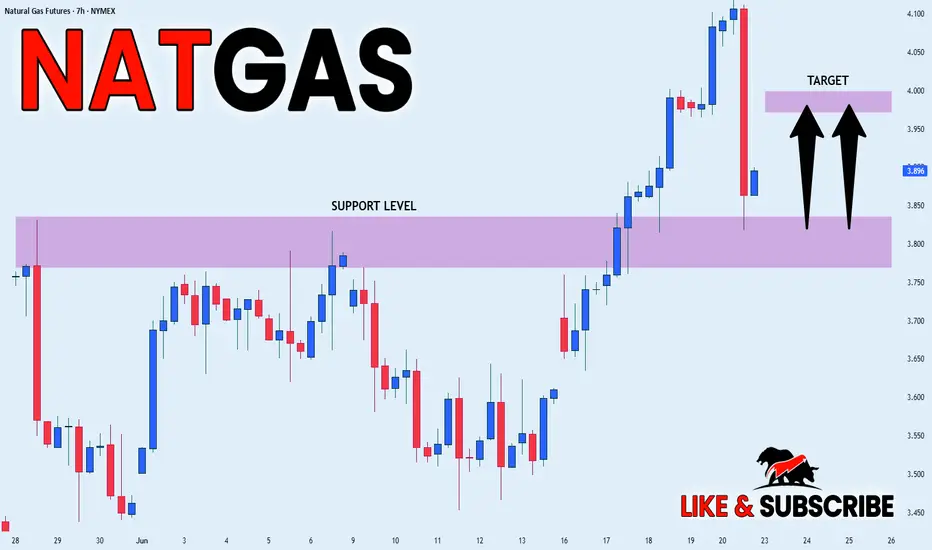
NATGAS REBOUND AHEAD|LONG|
✅NATGAS went down to retest
A horizontal support of 3.820$
Which makes me locally bullish biased
And I think that a move up
From the level is to be expected
Towards the target above at 3.984$
LONG🚀
✅Like and subscribe to never miss a new idea!✅
Disclosure: I am part of Trade Nation's Influencer program and receive a monthly fee for using their TradingView charts in my analysis.
EUR_CHF CORRECTION AHEAD|SHORT|
✅EUR_CHF is set to retest a
Strong resistance level above at 0.9446
After trading in a local uptrend for some time
Which makes a bearish pullback a likely scenario
With the target being a local support below at 0.9410
SHORT🔥
✅Like and subscribe to never miss a new idea!✅
Disclosure: I am part of Trade Nation's Influencer program and receive a monthly fee for using their TradingView charts in my analysis.

NASDAQ Bullish Play into Liquidity Before Potential ReversalForecast:
NOTE: At this moment, this is a forecast and trades will be taken dependent on live PA.
Price has reacted strongly off the 21,410–21,430 Daily Order Block, suggesting bullish intent. If bullish structure holds, I expect a move into the 22,060–22,130 liquidity zone, where sell-side setups could form.
This is a classic Buy to Sell model:
Buy from OB at ~21,420
Target liquidity above recent highs (~22,100+)
Look for shorts after sweep into 22,130–22,220 range
Invalidation: Break and close below 21,410 suggests the OB failed — potential deeper drop toward 20,700.

#Bitcoin is approaching a strong demand zone!#Bitcoin is approaching a strong demand zone!
This level has acted as solid support several times in the past.
According to the Fibonacci levels, we’re currently at the 0.5 level, which makes this area even more significant.
In my opinion, we’re likely to see a bounce from here.
However, if the price fails to hold this level, there’s a good chance we’ll retest the $92K zone.
But for that to happen, we need a daily close below $100K.
Until then, we’re still in a safe zone.
I’ll keep you updated as things develop.
If you find my updates helpful, don’t forget to like and follow for more!
DYOR, NFA

GBP_NZD RISKY SHORT|
✅GBP_NZD is going up now
But a strong resistance level is ahead at 2.2591
Thus I am expecting a pullback
And a move down towards the target of 2.2524
SHORT🔥
✅Like and subscribe to never miss a new idea!✅
Disclosure: I am part of Trade Nation's Influencer program and receive a monthly fee for using their TradingView charts in my analysis.

EUR-NZD Bullish Breakout! Buy!
Hello,Traders!
EUR-NZD keeps growing and
The pair made a bullish breakout
Of the key horizontal level
Of 1.9270 and the breakout
Is confirmed so we are bullish
Biased and we will be
Expecting a further move up
Buy!
Comment and subscribe to help us grow!
Check out other forecasts below too!
Disclosure: I am part of Trade Nation's Influencer program and receive a monthly fee for using their TradingView charts in my analysis.

EUR-CHF Resistance Ahead! Sell!
Hello,Traders!
EUR-CHF keeps growing
But a strong horizontal
Resistance level is ahead
Around 0.9443 so after
The retest we will be
Expecting a local pullback
And a local bearish correction
Sell!
Comment and subscribe to help us grow!
Check out other forecasts below too!
Disclosure: I am part of Trade Nation's Influencer program and receive a monthly fee for using their TradingView charts in my analysis.

EUR_GBP WILL KEEP GROWI|LONG|
✅EUR_GBP broke the key horizontal level of 0.8540
Which is now a support then went down
To retest it and we are now seeing
A bullish reaction so I think that
The pair will go even higher up
LONG🚀
✅Like and subscribe to never miss a new idea!✅
Disclosure: I am part of Trade Nation's Influencer program and receive a monthly fee for using their TradingView charts in my analysis.

NZD-USD Bearish Breakout! Sell!
Hello,Traders!
NZD-USD broke out of the
Rising channel and then made
A bearish breakout of the
Horizontal key level too
Around 0.0602 which is
Now a resistance, then
Made a pullback and retest
And is going down again which
Reinforces our local bearish bias
And we will be expecting a
Further bearish move down
Sell!
Comment and subscribe to help us grow!
Check out other forecasts below too!
Disclosure: I am part of Trade Nation's Influencer program and receive a monthly fee for using their TradingView charts in my analysis.

Bitcoin - Expecting Liquidity Grab at 102.8k Before Relief MoveMarket Context
After a strong rejection from resistance, price has shown clear signs of internal weakness. We recently got an internal liquidity sweep followed by a sharp move down, confirming a shift in momentum. The market is currently compressing just below a key fair value gap, hinting at further downside before any real bullish structure can form
Internal Sweep and Bearish Pressure
The internal sweep acted as a final inducement before the market sold off. The reaction afterward was clean and aggressive, suggesting that smart money is offloading positions into trapped longs. Price has now stalled in a tight range, and the lack of bullish follow-through adds weight to the idea that lower prices are still on the table.
Fair Value Gap Below as Draw
The unfilled imbalance below, lining up near 102.8k, is acting as a magnet. This level has not been tapped and lines up cleanly with the idea of a final liquidity sweep before any retracement. It would make sense to target this zone to clear out remaining liquidity and rebalance price before reassessing.
Retracement Scenarios After the Sweep
Once that low is swept and the gap is filled, we could see a retracement back into the previous fair value gap around 106k. This could either form a lower high, continuing the broader downtrend, or potentially run the high if there's enough momentum. Either way, the reaction from that level will offer the next major clue on direction.
Key Expectation
Until the low around 102.8k is swept, the bearish narrative remains intact. The cleanest setup would be a liquidity run into that level followed by a reaction that leads us higher, ideally back toward the 106k zone. From there, we’ll watch how price behaves to decide whether a deeper correction or a trend continuation is in play.
Conclusion
Still leaning bearish short-term as long as that gap and low remain unfilled. Once we tap into the 102.8k area, I’ll be watching for a shift that could give us a play back into the 106k gap. It’s all about liquidity, structure, and the cleanest path for smart money to move.
Disclosure: I am part of Trade Nation's Influencer program and receive a monthly fee for using their TradingView charts in my analysis.
Thanks for your support!
If you found this idea helpful or learned something new, drop a like 👍 and leave a comment, I’d love to hear your thoughts! 🚀

ETHEREUM Risky Long! Buy!
Hello,Traders!
ETHEREUM is consolidating
Above the horizontal support
Area around 2360$ and we
Are already seeing a local
Rebound from the level
So as we are bullish biased
A further price growth
Is to be expected
Buy!
Comment and subscribe to help us grow!
Check out other forecasts below too!
Disclosure: I am part of Trade Nation's Influencer program and receive a monthly fee for using their TradingView charts in my analysis.

AMAZON Local Short! Sell!
Hello,Traders!
AMAZON made a retest
Of the horizontal resistance
Around 219$ and the stock
Is already making a local
Bearish pullback so a further
Bearish correction
Is to be expected
Sell!
Comment and subscribe to help us grow!
Check out other forecasts below too!
Disclosure: I am part of Trade Nation's Influencer program and receive a monthly fee for using their TradingView charts in my analysis.
