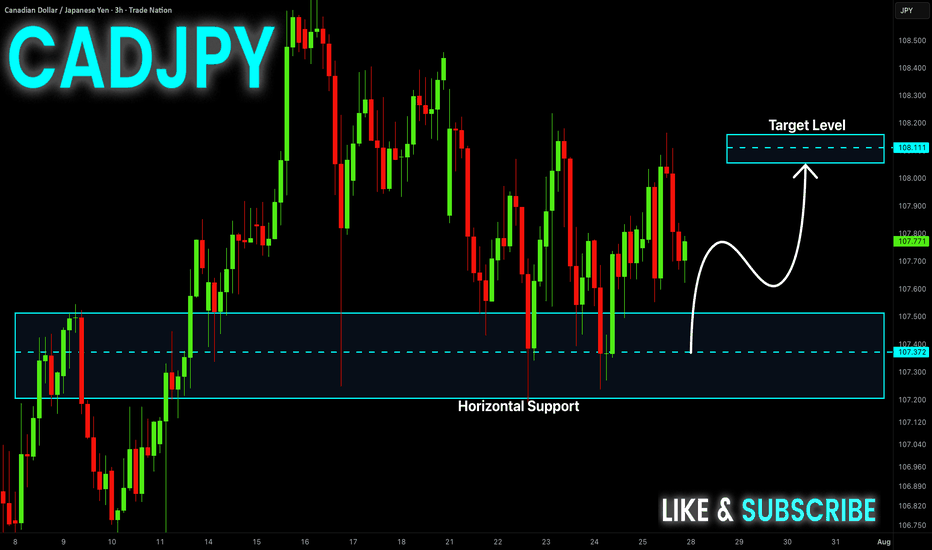
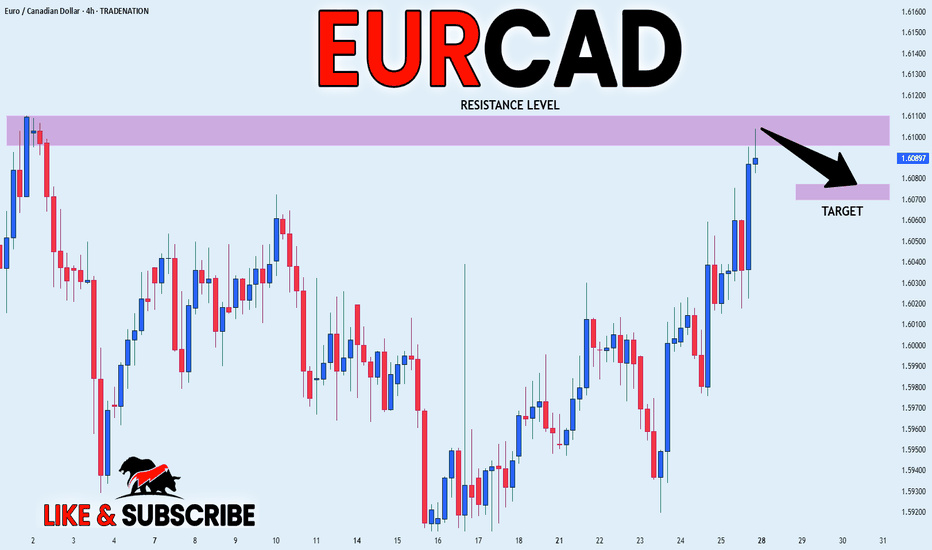
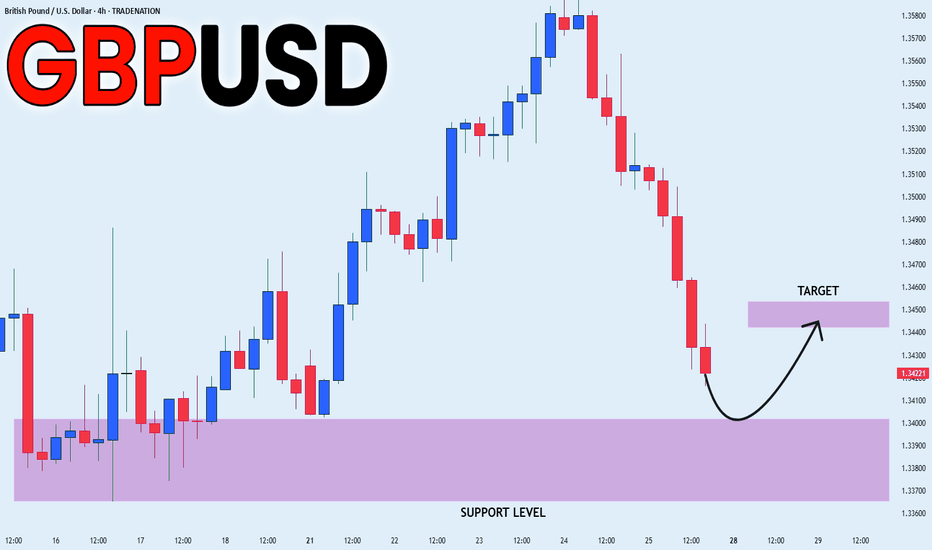
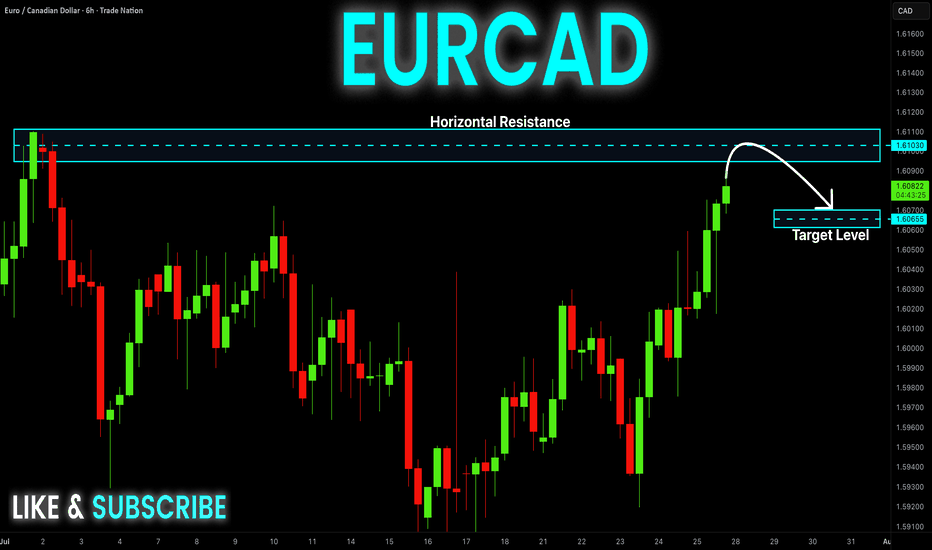
EUR-CAD Bearish Breakout! Sell!
Hello,Traders!
EUR-CAD made a bearish
Breakout of the key horizontal
Level of 1.5700 and the
Breakout is confirmed
So we are bearish biased
And we will be expecting
A further bearish move down
Sell!
Comment and subscribe to help us grow!
Check out other forecasts below too!
Disclosure: I am part of Trade Nation's Influencer program and receive a monthly fee for using their TradingView charts in my analysis.
Smartmoneyconcept
USD-CAD Will Keep Falling! Sell!
Hello,Traders!
USD-CAD is trading in a
Downtrend and the pair made
A retest of the horizontal
Resistance of 1.3868 from where
We are already seeing a bearish
Move down so we will be
Expecting a further
Bearish move down
Sell!
Comment and subscribe to help us grow!
Check out other forecasts below too!
Disclosure: I am part of Trade Nation's Influencer program and receive a monthly fee for using their TradingView charts in my analysis.
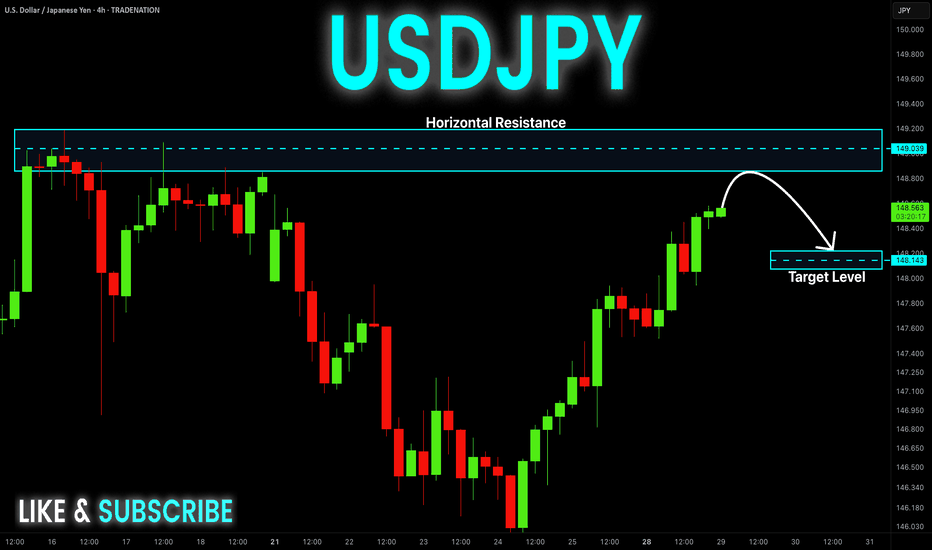
Ultimate Guide to Master ICT KillzonesWhy Timing Matters Just as Much as Price
Smart Money Concepts (SMC) and ICT methodologies are built on the idea that markets are manipulated by large players with precision. While most traders obsess over price levels, entry models, and liquidity zones, many fail to realize that none of those matter if they happen at the wrong time. Time is not an afterthought, it's a core part of the edge.
Price can show you where the move might happen, but time shows you when smart money is most likely to act. That window of action is what ICT calls the killzone.
What Are Killzones?
Killzones are specific time periods in the trading day when smart money typically executes large moves. These sessions have predictable volatility and institutional order flow. They are not just random hours, they coincide with major session opens and overlaps.
The most relevant killzones are:
London Killzone (LKO), 2 AM to 5 AM EST
New York Killzone (NYKO), 7 AM to 10 AM EST
New York Lunch/Dead Zone, 11:30 AM to 1 PM EST (low probability, often reversal traps)
Each killzone offers unique opportunities depending on how liquidity has been engineered prior. ICT-style setups are most reliable when they form within, or directly in anticipation of, these windows.
The Trap Before the Real Move
Smart money loves to trap retail traders. This trap usually happens just before or early in a killzone. For example, if price takes out a key high at 2:30 AM EST (London open), many retail traders see a breakout. But those in tune with SMC see it as a classic liquidity raid, bait before the reversal.
Once that external liquidity is taken, smart money shows its hand with displacement, a sudden, aggressive move in the opposite direction. This typically forms a clean imbalance (Fair Value Gap) or a breaker block. That’s your cue.
If the price returns to that level within the killzone, that’s the optimal entry window.
Confluence is King: Time, Liquidity, and Structure
The most reliable SMC setups happen when:
Liquidity is swept early into a killzone
Displacement confirms the real direction during the killzone
Entry happens via return to an FVG or OB created within that same session
The setup might still look right if it forms outside these windows, but without proper timing, it’s often just noise or engineered liquidity to trap impatient traders.
Real-World Example: NY Killzone Short
NY, At 8:30 AM EST, price runs above the Asian highs, sweeping liquidity
Displacement, Sharp bearish move breaks structure to the downside at 8:45 AM
Entry, Price retraces into the 5M FVG at 9:10 AM
Result, Clean reversal into a nice profit trageting liquidity, all within the NY session
Outside of this killzone structure, the same setup likely would have chopped or failed.
Common Mistakes Traders Make With Time
Chasing price outside of killzones, Setup might look good, but volume is thin and no follow-through comes
Assuming all killzones are equal, London setups are often cleaner in structure, while NY has more manipulation around news
Forcing trades in NY lunch, Midday reversals do happen, but they’re lower probability. If you're not already in a position by 11 AM EST, it's often best to wait for the next day
The Discipline Edge
Most traders overtrade not because they lack setups, but because they don’t filter based on time. By only trading when price interacts with your levels during active killzones, you immediately reduce the number of bad trades and increase your focus on meaningful opportunities.
Good setups are rare. Good setups in the right timing window are even rarer. That’s where consistency comes from.
Final Thoughts
Time is not optional. In SMC and ICT, it’s not enough to have the level, you need the timing. Killzones are your filter, your edge, and your context for every trade.
Once you understand how time and price move together, and stop treating every moment on the chart equally, your trading will start to reflect the true flow of smart money.
Wait for time, wait for price, then strike.
___________________________________
Thanks for your support!
If you found this guide helpful or learned something new, drop a like 👍 and leave a comment, I’d love to hear your thoughts! 🚀
Make sure to follow me for more price action insights, free indicators, and trading strategies. Let’s grow and trade smarter together! 📈
What Is SMT Divergence, and How Can You Use It in Trading?What Is SMT Divergence, and How Can You Use It in Trading?
SMT divergence, or Smart Money Technique divergence, is a concept used by traders to analyse imbalances in correlated markets. By identifying when price movements deviate between related instruments, traders can uncover potential shifts in market momentum, often linked to institutional activity. This article explores what SMT divergence is, how SMT divergence trading works, and its practical applications.
What Is SMT Divergence?
SMT divergence, short for Smart Money Technique divergence, refers to a specific type of price discrepancy between two correlated financial instruments. Part of the Inner Circle Trader (ICT) methodology, this divergence is often interpreted as a sign of institutional or "smart money" activity, as it highlights potential inefficiencies or imbalances in the market.
Here’s how an ICT SMT divergence works: correlated instruments—like EUR/USD and GBP/USD in forex, or major stock indices like the S&P 500 and NASDAQ—typically move in the same direction under normal market conditions. SMT divergence occurs when one instrument makes a higher high or lower low, while the other fails to follow suit. This inconsistency suggests that buying or selling pressure may be uneven across these markets, often caused by larger market participants adjusting their positions.
For example, if EUR/USD forms a new high, while GBP/USD lags behind and fails to break its previous high. This divergence could indicate waning momentum in one pair, hinting at a potential reversal or shift in the overall market structure. Traders analysing SMT divergence often see these moments as key opportunities to assess whether institutional players might be involved.
To identify an SMT divergence, you can monitor two correlated assets’ charts and observe discrepancies. Also, there are SMT divergence indicators for MT4, MT5, and TradingView available online that can automate the process.
The Core Components of SMT Divergence
SMT divergence relies on three key components: correlated instruments, divergence between price movements, and the involvement of institutional players. Understanding these elements is crucial for applying this concept.
1. Correlated Instruments
At the heart of SMT divergence is the relationship between correlated markets. These are instruments that typically move in tandem due to shared economic drivers. For instance, in forex, pairs like EUR/USD and GBP/USD often exhibit similar trends because they’re influenced by the strength of the US dollar, as well as their close regional ties and trade relationships. In equities, indices like the Nasdaq 100 and S&P 500 often align because they reflect broader market sentiment and contain overlapping stocks.
2. Divergence in Price Movements
The divergence occurs when these typically correlated instruments fail to move in sync. For example, one instrument may reach a higher high, while the other stalls or even reverses. This mismatch is more than just noise—it can signal a deeper imbalance in the market, often linked to uneven supply and demand dynamics. It’s these price discrepancies that traders scrutinise to identify potential turning points.
3. Institutional Activity
One of the reasons SMT divergence is so closely watched is its potential link to smart money behaviour. Institutions often use correlated instruments to mask their actions, creating subtle imbalances that only become apparent through careful analysis. For instance, when one correlated pair lags, it might reflect deliberate accumulation or distribution by larger players.
How Traders Analyse SMT Divergence
Analysing SMT divergence helps in understanding the nuanced relationship between correlated instruments and interpreting these imbalances correctly. Unlike leading correlations—such as oil influencing the Canadian dollar—SMT divergence doesn’t rely on one asset consistently driving the other. Instead, it focuses on shifts in momentum where neither instrument is the leader, but their combined behaviour hints at potential market moves.
Identifying Divergence
Traders start by observing price action in two correlated instruments or timeframes. SMT divergence becomes apparent when one instrument forms a higher high or lower low, while the other fails to do so. For example, if EUR/USD makes a higher high, but GBP/USD stalls below its previous peak, this inconsistency could signal fading bullish momentum in the broader market. The key is that neither asset leads; instead, the divergence itself provides the signal.
Some common correlations traders use include:
- Forex Pairs:
EUR/USD and GBP/USD
USD/JPY and USD/CHF
DXY and USD/CAD
- Cryptocurrencies*:
BTC/USD and ETH/USD
- Equity Indices:
S&P 500 and NASDAQ
FTSE 100 and DAX
- Treasuries:
US 10-Year Treasury Yield and USD/JPY
- Commodities:
Brent Crude and WTI Crude Oil
Interpreting Divergence at Extremes
SMT divergence is particularly significant when it occurs at market highs or lows. When divergence appears at highs—such as one instrument making a higher high while the other fails—it often signals a potential bearish reversal in the stronger instrument. Conversely, at lows, if one makes a lower low while the other holds firm, it may indicate a potential bullish reversal in the weaker one. This imbalance highlights where momentum might shift.
Adding Context
Traders rarely rely on an SMT divergence strategy alone. They often look for supporting evidence, such as volume analysis, market structure shifts, or order flow data, to confirm the signal. For instance, divergence combined with signs of institutional selling near a high could strengthen the case for a bearish move.
SMT Divergence in Different Market Conditions
SMT divergence behaves differently depending on market conditions, offering traders insights that vary between trending and ranging environments. Its effectiveness hinges on the context in which it appears, so understanding how it adapts to different scenarios is key.
Trending Markets
In trending markets, SMT divergence often signals potential reversals or pauses in momentum. For example, in a strong uptrend, divergence at a new high (where one correlated instrument makes a higher high while the other does not) can indicate waning buying pressure. This inconsistency might suggest that institutional players are beginning to reduce their positions or shift market direction.
A similar principle applies in downtrends: divergence at a fresh low, where one instrument breaks lower while the other doesn’t, could signal that bearish momentum is losing steam. Traders often use these moments to reassess their analysis and consider the possibility of a reversal or pullback within the trend.
Ranging Markets
In a range-bound environment, SMT divergence takes on a different role. Rather than hinting at trend reversals, it often highlights potential breakouts or false moves. For instance, during a consolidation phase, if one correlated instrument makes a sharp move outside the range while the other stays contained, it may signal that the breakout is unsustainable and a reversal back into the range is likely.
Alternatively, if both instruments diverge significantly at the edges of the range, it could suggest that smart money is accumulating or distributing positions in preparation for a breakout.
Different Asset Classes
SMT divergence isn’t limited to one market type. In forex, it often reveals imbalances caused by macroeconomic drivers like central bank policies. In equities, it can signal sector rotation or institutional adjustments. Commodities, particularly oil or gold, may show divergence influenced by supply and demand dynamics.
Limitations and Common Misconceptions
While SMT divergence is a powerful tool for analysing market imbalances, it’s important to understand its limitations and avoid common misconceptions. Misinterpreting divergence can lead to flawed decisions, especially if it’s viewed in isolation or without proper context.
Limitations
- False Signals: Not all divergences indicate institutional activity or meaningful shifts in the market. Low liquidity or erratic price movements can create divergence that doesn’t hold significance.
- Context Dependency: SMT divergence requires a solid understanding of market conditions. Its reliability decreases in highly volatile or choppy environments where correlations break down temporarily.
- Not a Standalone Tool: Relying solely on SMT divergence can be risky. Traders use it alongside other forms of analysis, such as market structure or volume data.
Common Misconceptions
- Always Linked to Institutional Activity: Not every instance of SMT divergence involves smart money. Divergences can also result from retail trading activity or macroeconomic events.
- Predicting Market Direction: SMT divergence doesn’t guarantee outcomes; it highlights imbalances. Further analysis is needed to evaluate whether the market will reverse, continue, or consolidate.
- Universal Applicability: While it works across various markets, not all instruments are equally suitable for SMT divergence due to differences in liquidity or drivers.
Practical Applications of SMT Divergence
SMT divergence is a versatile analytical method that traders use to refine their strategies and deepen their understanding of market dynamics. Here’s how it’s typically applied in practice:
Identifying Market Turning Points
One of the most common uses of SMT divergence is spotting potential reversals. When divergence appears at key highs or lows, it often signals that momentum is shifting. When combined with other common trading tools, such as support and resistance, as well as ICT methodology concepts like order blocks and fair value gaps, this can be used to time entries or adjust risk exposure.
Potentially Enhancing Risk Management
SMT divergence can potentially enhance risk management by offering early warnings about changes in market conditions. If divergence aligns with other factors—such as weakening volume or significant resistance/support levels—it can serve as a signal to tighten stops or reduce position sizes, depending on the trader’s broader approach.
At the same time, it can also provide clear boundaries for setting stop losses. If a trader has confidence that a reversal in one asset is likely due to an SMT divergence, then a stop loss can be placed immediately after the maximum or minimum of the divergence.
The Bottom Line
The SMT divergence is a valuable tool for understanding market imbalances and spotting potential turning points. By combining it with other analysis methods, traders can gain deeper insights into price action.
FAQ
What Does Divergence Mean in Trading?
Divergence in trading refers to a mismatch between the price action of an asset and a technical indicator or between two correlated instruments. It often signals a potential change in trend, as the imbalance suggests a shift in market momentum.
What Is SMT in Trading?
SMT in trading stands for Smart Money Technique. SMT divergence is one of the ICT trading concepts. It focuses on identifying market imbalances that may reflect the activity of institutional traders, seen through divergence between correlated instruments.
What Does SMT Divergence Mean?
The SMT divergence meaning refers to an occasion when two correlated instruments fail to move in sync. One can make a higher high while the other does not or one can make a lower low while the other doesn’t. This indicates potential smart money involvement and signals a possible trend shift.
What Is an Example of SMT Divergence?
A common example is in forex, where EUR/USD forms a higher high, but GBP/USD does not. This divergence could suggest fading bullish momentum, signalling a possible reversal in EUR/USD.
What Is the Strongest Divergence Indicator?
While SMT divergence itself is powerful, traders often combine it with indicators like RSI or volume profiles for added confirmation. The strongest signals come from divergence paired with a broader market context.
*Important: At FXOpen UK, Cryptocurrency trading via CFDs is only available to our Professional clients. They are not available for trading by Retail clients. To find out more information about how this may affect you, please get in touch with our team.
This article represents the opinion of the Companies operating under the FXOpen brand only. It is not to be construed as an offer, solicitation, or recommendation with respect to products and services provided by the Companies operating under the FXOpen brand, nor is it to be considered financial advice.
NZD_USD REBOUND AHEAD|LONG|
✅NZD_USD is trading in an
Uptrend and the pair is making
A local correction in a way
Which also resembles a bullish
Wedge so after the retest of the
Horizontal support around 0.5917
A local bullish rebound
Is to be expected
LONG🚀
✅Like and subscribe to never miss a new idea!✅
Disclosure: I am part of Trade Nation's Influencer program and receive a monthly fee for using their TradingView charts in my analysis.
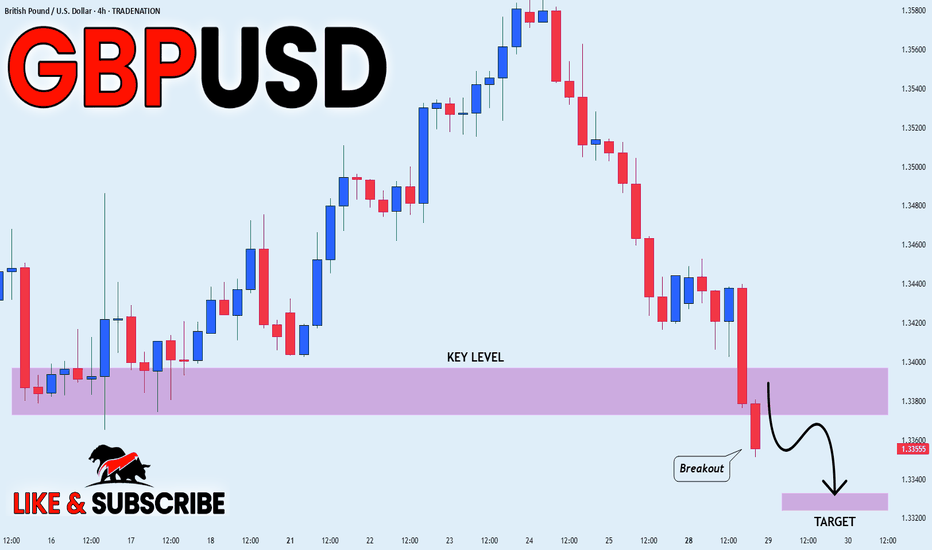
GBP-CAD Will Grow! Buy!
Hello,Traders!
GBP-CAD is trading in an
Uptrend and the pair
Made a bullish breakout
And a pullback so affter
The retest of the broken
Falling resistance which
Is now a support we will
Be expecting a further
Bullish move up
Buy!
Comment and subscribe to help us grow!
Check out other forecasts below too!
Disclosure: I am part of Trade Nation's Influencer program and receive a monthly fee for using their TradingView charts in my analysis.
GBP_AUD BULLISH BREAKOUT|LONG|
✅GBP_AUD is going up now
And the pair made a bullish
Breakout of the key horizontal
Level around 2.0940 so as the
Breakout is confirmed we will
Be expecting a further
Bullish continuation
LONG🚀
✅Like and subscribe to never miss a new idea!✅
Disclosure: I am part of Trade Nation's Influencer program and receive a monthly fee for using their TradingView charts in my analysis.
NZD-JPY Potential Long! Buy!
Hello,Traders!
NZD-JPY is going down
Now but the pair will soon
Hit a horizontal support
Level around 84.000 from
Where we will be expecting
A local bullish rebound
And a further move up
Buy!
Comment and subscribe to help us grow!
Check out other forecasts below too!
Disclosure: I am part of Trade Nation's Influencer program and receive a monthly fee for using their TradingView charts in my analysis.
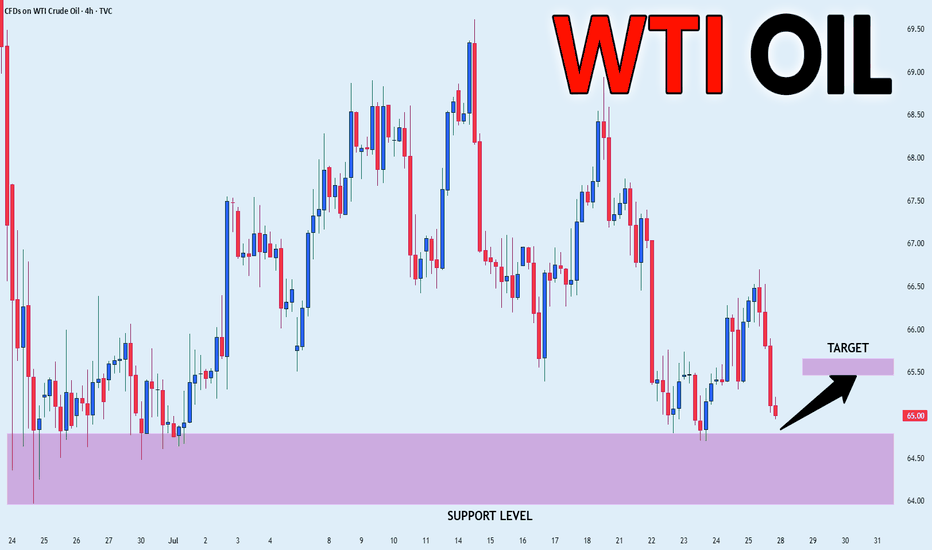
US30 LOCAL SHORT|
✅DOW JONES is going up now
But a strong resistance level is ahead at 40,947
Thus I am expecting a pullback
And a move down towards the target of 40,314
SHORT🔥
✅Like and subscribe to never miss a new idea!✅
Disclosure: I am part of Trade Nation's Influencer program and receive a monthly fee for using their TradingView charts in my analysis.
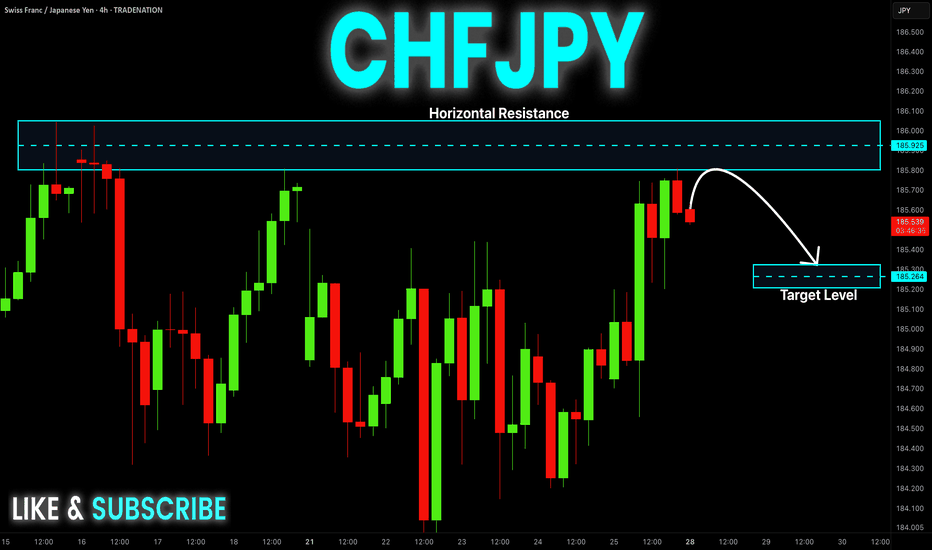
NZD-USD Long From Support! Buy!
Hello,Traders!
NZD-USD is making a local
Bearish correction but will
Soon hit a horizontal support
Around 0.5915 from where
We will be expecting a
Local bullish rebound
Buy!
Comment and subscribe to help us grow!
Check out other forecasts below too!
Disclosure: I am part of Trade Nation's Influencer program and receive a monthly fee for using their TradingView charts in my analysis.
Bitcoin - Major Daily Imbalance and Possible Move to $105k?Bitcoin already broke out of the bearish structure a while back, and honestly, that was the first major shift everyone should have been paying attention to. Ever since that breakout, we have been building bullish structure on the higher timeframes, higher highs, higher lows, and overall strong momentum to the upside. This gave the bulls a clear advantage, and so far, nothing has really changed that bigger picture.
Consolidation Structure
Now, looking at the current price action, something important stands out. During the last big push up, Bitcoin left behind a massive daily imbalance zone. It is way too big to just leave open like that. Markets hate inefficiencies, especially ones of that size, and more often than not, these kinds of imbalance zones get filled at some point.
Because of that, I am fully expecting price to come down, revisit this imbalance area, and fill it properly before making any serious move higher. It is a natural thing for the market to do, clean up inefficiencies, grab liquidity, and then continue the main trend if the structure holds.
Bullish/Bearish Scenarios
The most important thing to watch here is how Bitcoin reacts once it gets into the imbalance zone. If we dip into it and then start seeing bullish reactions, I will be looking for confirmation that the bullish structure is still intact. Specifically, if we can avoid a daily candle close below the bottom of that imbalance, the bullish case remains valid.
However, if we get a full daily close below the imbalance, that would be a strong warning sign. That would tell me that the bulls lost control and we could be looking at deeper downside or a shift back into bearish conditions.
But as long as that does not happen, I am still looking for the market to respect the structure. A dip into the imbalance, hold, and then continuation higher, that is the ideal scenario.
Price Target and Expectations
If we get the reaction I am looking for after filling the imbalance, I think Bitcoin has a real shot at rallying towards $105,000. That level lines up perfectly with a strong resistance area on the chart, and it would make sense for price to reach for it if the momentum stays bullish.
Now, reaching $105,000 will not be easy. That is going to be a major test for the market. There will likely be heavy selling pressure around there. But if the trend stays strong and we keep putting in bullish structures even as we approach that resistance, it is definitely possible to break through eventually.
Current Stance
Right now, I am being patient. I am not chasing the current move higher. I am waiting for price to come back down into the imbalance zone. If we get a proper retest and hold, that is where I will be looking for my entries, targeting the move towards $105,000.
No daily close below the imbalance zone = bullish continuation plan still in play,
Daily close below = reassess everything and possibly step aside.
Conclusion
To sum it up, Bitcoin already shifted bullish a while ago with the structure break. Now it is just about cleaning up the inefficiencies it left behind during the move up. If the market does what it usually does, fill the imbalance and maintain bullish structure, then the setup towards $105,000 is very much alive.
Patience is key here. Let the market come to us. No need to force anything.
___________________________________
Thanks for your support!
If you found this idea helpful or learned something new, drop a like 👍 and leave a comment, I’d love to hear your thoughts! 🚀
Make sure to follow me for more price action insights, free indicators, and trading strategies. Let’s grow and trade smarter together! 📈
AUD_USD GROWTH AHEAD|LONG|
✅AUD_USD is trading in an
Uptrend and the pair is
Consolidating above the
Horizontal support level
Around 0.6371 and we are
Already seeing a bullish
Rebound from the level
So we are bullish biased
And we will be expecting
The pair to go further
Up this week
LONG🚀
✅Like and subscribe to never miss a new idea!✅
Disclosure: I am part of Trade Nation's Influencer program and receive a monthly fee for using their TradingView charts in my analysis.
GBP-NZD Resistance Ahead! Sell!
Hello,Traders!
GBP-NZD went up sharply
From the support cluster
Below just as I predicted
But now the pair is about
To retest a horizontal resistance
Around 2.2620 from where
A local bearish correction
Will be expected
Sell!
Comment and subscribe to help us grow!
Check out other forecasts below too!
Disclosure: I am part of Trade Nation's Influencer program and receive a monthly fee for using their TradingView charts in my analysis.
AUD-USD Will Keep Growing! Buy!
Hello,Traders!
AUD-USD started the trading
Week with a strong bullish
Move up from the horizontal
Support of 0.6371 while trading
In an uptrend so we are bullish
Biased mid-term and we will
Be expecting a further bullish
Continuation, but its best to
Wait and see how the price
Interacts with the local
Key level of 0.6439 as
We might see a local
Pullback from this supply
Area giving us a better
Entry price for the long
Buy!
Comment and subscribe to help us grow!
Check out other forecasts below too!
Disclosure: I am part of Trade Nation's Influencer program and receive a monthly fee for using their TradingView charts in my analysis.
CHF_JPY GROWTH AHEAD|LONG|
✅CHF_JPY made a retest
Of the horizontal support
Around 172.500 and we are
Already seeing a powerful
Rebound so we are bullish
Biased and we will be
Expecting a further move up
LONG🚀
✅Like and subscribe to never miss a new idea!✅
Disclosure: I am part of Trade Nation's Influencer program and receive a monthly fee for using their TradingView charts in my analysis.
NZD-JPY Short From Falling Resistance! Sell!
Hello,Traders!
NZD-JPY is going up
And will soon hit a falling
Resistance line from where
We will be expecting a
Local bearish pullback
And a move down
Sell!
Comment and subscribe to help us grow!
Check out other forecasts below too!
Disclosure: I am part of Trade Nation's Influencer program and receive a monthly fee for using their TradingView charts in my analysis.
GBP_USD SWING SHORT|
✅GBP_USD has retested a key resistance level around 1.3400
And as the pair is already making a bearish pullback
A move down to retest the demand level below at 1.3228 is likely
SHORT🔥
✅Like and subscribe to never miss a new idea!✅
Disclosure: I am part of Trade Nation's Influencer program and receive a monthly fee for using their TradingView charts in my analysis.
EUR-USD Swing Long! Buy!
Hello,Traders!
EUR-USD is trading in an
Uptrend and the pair is
Making a bearish correction
So after it hits the horizontal
Support area around 1.1280
We will be expecting a
Bullish move up on Monday
Buy!
Comment and subscribe to help us grow!
Check out other forecasts below too!
Disclosure: I am part of Trade Nation's Influencer program and receive a monthly fee for using their TradingView charts in my analysis.
SILVER Local Long! Buy!
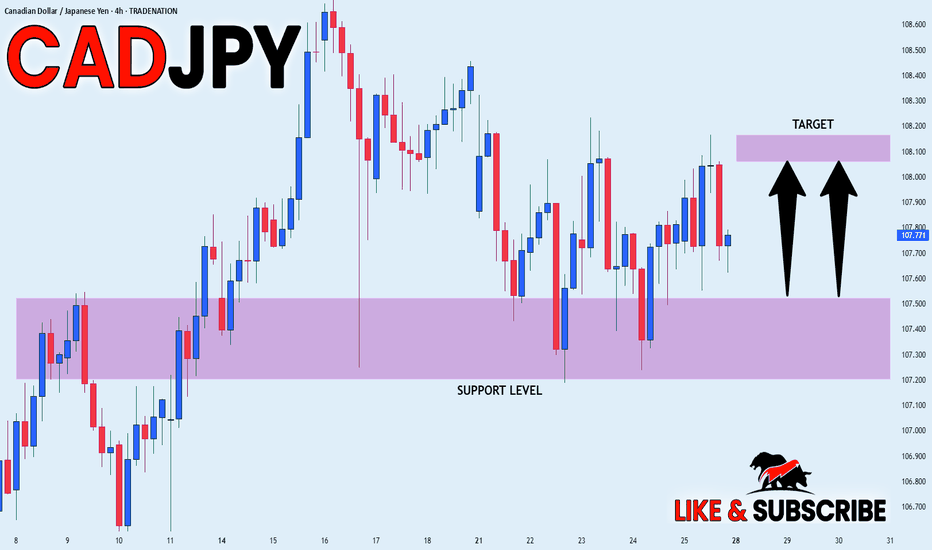
Hello,Traders!
SILVER is trading in a local
Uptrend and the price made
A retest of the horizontal
Support level around 32.83$
From where we will be
Expecting a rebound and
A move up on Monday
Buy!
Comment and subscribe to help us grow!
Check out other forecasts below too!
Disclosure: I am part of Trade Nation's Influencer program and receive a monthly fee for using their TradingView charts in my analysis.
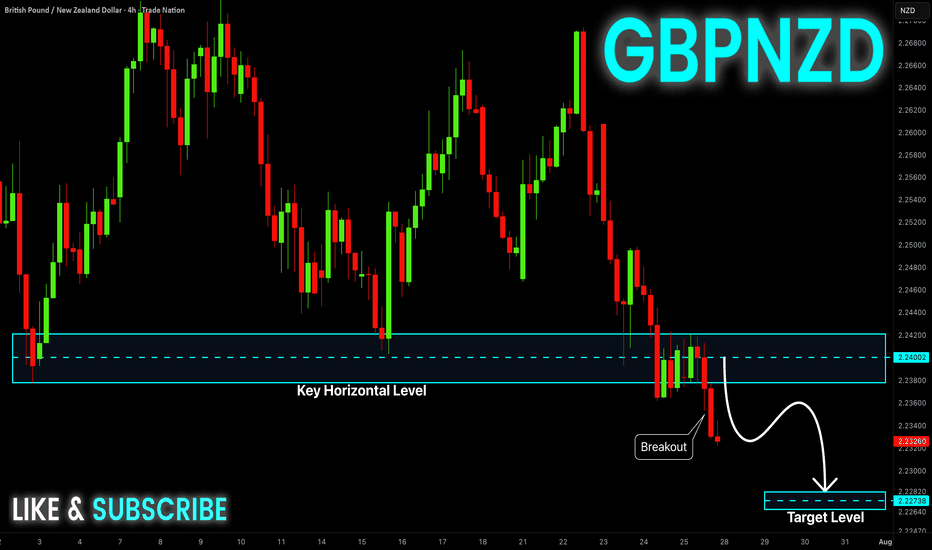
GOLD WILL GO FURTHER UP|LONG|
✅GOLD fell again to retest the support
But it is a strong key level
So as we are seeing a bullish
Rebound already I think that there is a high chance
That we will see a bullish rebound and a move up
LONG🚀
✅Like and subscribe to never miss a new idea!✅
Disclosure: I am part of Trade Nation's Influencer program and receive a monthly fee for using their TradingView charts in my analysis.
GBP-JPY Potential Short! Sell!
Hello,Traders!
GBP-JPY keeps growing
From the lows just as we
Expected but the pair will
Soon hit a horizontal resistance
Of 192.500 and from there
A local bearish pullback
It likely to follow
Sell!
Comment and subscribe to help us grow!
Check out other forecasts below too!
Disclosure: I am part of Trade Nation's Influencer program and receive a monthly fee for using their TradingView charts in my analysis.
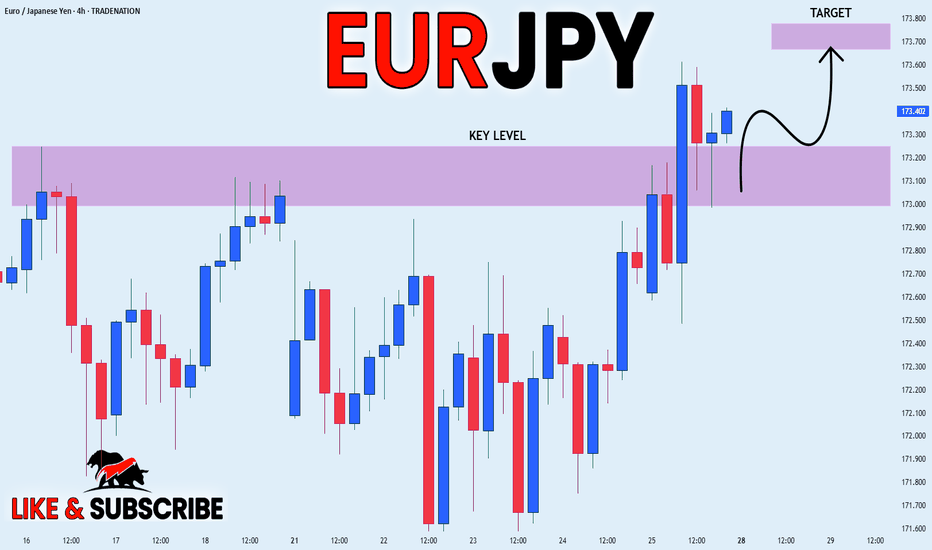
DAX WILL FALL|SHORT|
✅DAX has been growing recently
And the index seems locally overbought
So as the pair is approaching a horizontal resistance of 22,444
Price decline is to be expected
SHORT🔥
✅Like and subscribe to never miss a new idea!✅
Disclosure: I am part of Trade Nation's Influencer program and receive a monthly fee for using their TradingView charts in my analysis.
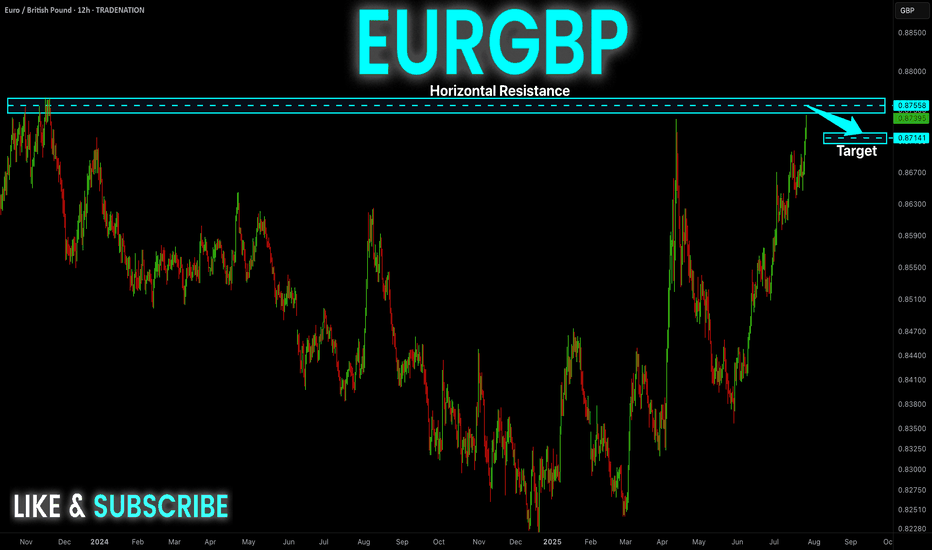
GBP_CHF CORRECTION AHEAD|SHORT|
✅GBP_CHF has retested a nice key resistance level of 1.1100
And as the pair is already making a bearish pullback
A move down to retest the demand level below at 1.0950 is likely
SHORT🔥
✅Like and subscribe to never miss a new idea!✅
Disclosure: I am part of Trade Nation's Influencer program and receive a monthly fee for using their TradingView charts in my analysis.