EUR_GBP CORRECTION AHEAD|SHORT|
✅EUR_GBP surged again to retest the resistance of 0.8473
But it is a strong key level
So I think that there is a high chance
That we will see a bearish pullback and a move down
SHORT🔥
✅Like and subscribe to never miss a new idea!✅
Smartmoneyconcept

SILVER Bullish Breakout! Buy!
Hello,Traders!
SILVER is trading in an uptrend
And the price made a bullish
Breakout of the key horizontal
Level of 3266$ and the brekaout
Is confirmed so we are bullish
Biased and we will be expecting
A further bullish continuation
Buy!
Comment and subscribe to help us grow!
Check out other forecasts below too!
Disclosure: I am part of Trade Nation's Influencer program and receive a monthly fee for using their TradingView charts in my analysis.

GOLD SHORT FROM RESISTANCE|
✅GOLD will soon retest a key resistance level of 2930$
So I think that the price will make a pullback
And go down to retest the demand level below at 2911$
SHORT🔥
✅Like and subscribe to never miss a new idea!✅

GBP_USD WILL GO UP|LONG|
✅GBP_USD is trading in an
Uptrend and the pair made
A bullish breakout of the key
Horizontal level of 1.2850
Which is now a support
Then made a retest and is going up
Now so we are bullish biased
And we will be expecting a
Further move up
LONG🚀
✅Like and subscribe to never miss a new idea!✅

BITCOIN Great Investment Opportunity! Buy!
Hello,Traders!
BITCOIN keeps falling down
In a strong correction move
But the coin will soon hit a
Massive key horizontal
Demand level of 72,500$
From where a bullish
Rebound and a move up
Is likely to happen
Buy!
Comment and subscribe to help us grow!
Check out other forecasts below too!
Disclosure: I am part of Trade Nation's Influencer program and receive a monthly fee for using their TradingView charts in my analysis.

RIPPLE MASSIVE LONG|
✅RIPPLE will be retesting a support level soon of 2.00$
From where I am expecting a bullish reaction
With the price going up but we need
To wait for a reversal pattern to form
Before entering the trade, so that we
Get a higher success probability of the trade
LONG🚀
✅Like and subscribe to never miss a new idea!✅

EUR_AUD WIlL KEEP GROWING|LONG|
✅EUR_AUD made a bullish
Breakout of the key horizontal
Level of 1.7162 and the breakout
Is confirmed so we are bullish
Biased and we will be expecting
A further move up
LONG🚀
✅Like and subscribe to never miss a new idea!✅

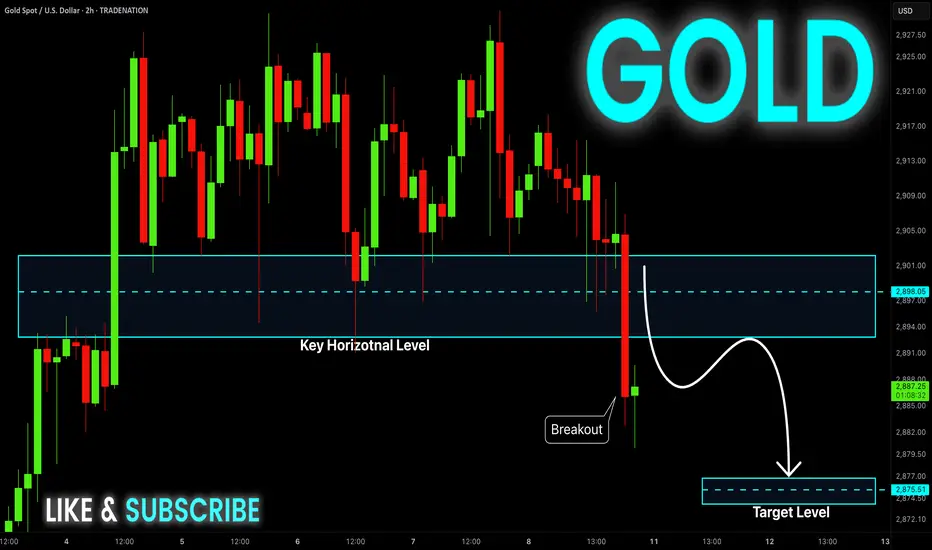
GOLD Risky Short! Sell!
Hello,Traders!
GOLD made a bearish
Breakout of the key
Horizontal level of 2900$
And the breakout is confirmed
So we are locally bearish
Biased and we will be
Expecting a further move down
Sell!
Comment and subscribe to help us grow!
Check out other forecasts below too!
Disclosure: I am part of Trade Nation's Influencer program and receive a monthly fee for using their TradingView charts in my analysis.
CAD_CHF SWING LONG|
✅CAD_CHF is going down now
But a strong support level is ahead at 0.6060
Thus I am expecting a rebound
And a move up towards the target at 0.6123
LONG🚀
✅Like and subscribe to never miss a new idea!✅

EUR-AUD Bullish Breakout! Buy!
Hello,Traders!
EUR-AUD is trading in an
Uptrend and the pair made
Made a bullish breakout
Of the key horizontal level
Of 1.7145 which is now
A support then made a
Bullish rebound so we are
Bullish biased and we
Will be expecting a
Further move up
Buy!
Comment and subscribe to help us grow!
Check out other forecasts below too!
Disclosure: I am part of Trade Nation's Influencer program and receive a monthly fee for using their TradingView charts in my analysis.

NATGAS BULLISH BREAKOUT|
✅NATGAS is trading in an
Uptrend and the price made
A strong bullish breakout
Of the key level of 4.400$
Which is now a support
So we will be expecting
A further bullish move up
LONG🚀
✅Like and subscribe to never miss a new idea!✅

GBP-USD Will Keep Growing! Buy!
Hello,Traders!
GBP-USD is trading in an
Uptrend and the pair broke
The key horizontal level
Of 1.2855 which is now
A support and the breakout
Is confirmed so we are
Bullish biased and we
Will be expecting a
Further bullish continuation
Buy!
Comment and subscribe to help us grow!
Check out other forecasts below too!
Disclosure: I am part of Trade Nation's Influencer program and receive a monthly fee for using their TradingView charts in my analysis.

AUD-CHF Local Long! Buy!
Hello,Traders!
AUD-CHF went down and
The pair made a retest of the
Horizontal support level
Of 0.5514 from where
We are already seeing a
Bullish rebound and we
Will be expecting a local
Bullish rebound
Buy!
Comment and subscribe to help us grow!
Check out other forecasts below too!
Disclosure: I am part of Trade Nation's Influencer program and receive a monthly fee for using their TradingView charts in my analysis.

NZD_CAD POTENTIAL LONG|
✅NZD_CAD is trading in a
Local uptrend and the made
A bullish breakout of the falling
Resistance line which is now
A support and the pair made a
Retest of the line and is already
Making a bullish rebound
So we will be expecting a
Further bullish move up
LONG🚀
✅Like and subscribe to never miss a new idea!✅

EUR_GBP RISKY LONG|
✅EUR_GBP is trading in an
Uptrend and the pair will soon
Retest a horizontal support
Of 0.8370 from where we
Will be expecting a local
Bullish rebound
LONG🚀
✅Like and subscribe to never miss a new idea!✅

NZD-USD Risky Long! Buy!
Hello,Traders!
NZD-USD made a retest
Of the horizontal support
Level 0.5687 and we are
Already seeing a local
Bullish reaction so we
Are locally bullish baised
And we will be expecting
A further bullish move up
Buy!
Comment and subscribe to help us grow!
Check out other forecasts below too!

BTCUSD possible bullish returnFollowing a strong bearish presence in recent days of BTCUSD, it is anticipated that there will be bullish return in BTC in the HTF demand, Bullish failure in the HTF demand as marked in the chart may land bitcoin price to $66,000. Liquidity in the chart placed at $86,230 ia the the reason to watch for bullish return in the zone. I have two entry module in the zone and i will watch for possible buy trade in BTCUSD.

NZD_USD LOCAL LONG|
✅NZD_USD will soon retest a key support level of 0.5690
So I think that the pair will make a rebound
And go up to retest the supply level above at 0.5730
LONG🚀
✅Like and subscribe to never miss a new idea!✅

DXY Will Go UP! Buy!
Hello,Traders!
DXY keeps falling down
But the index will soon
Hit a horizontal support
Level of 103.610 and
After the retest a local
Bullish correction
Will be expected
Buy!
Comment and subscribe to help us grow!
Check out other forecasts below too!
Disclosure: I am part of Trade Nation's Influencer program and receive a monthly fee for using their TradingView charts in my analysis.

EUR-USD Correction Ahead! Sell!
Hello,Traders!
EUR-USD is trading in an
Uptrend and the pair is
Locally overbought so after
The retest of the horizontal
Resistance level of 1.0942
We will be expecting a local
Bearish correction
Sell!
Comment and subscribe to help us grow!
Check out other forecasts below too!
Disclosure: I am part of Trade Nation's Influencer program and receive a monthly fee for using their TradingView charts in my analysis.

EUR-CHF Local Long! Buy!
Hello,Traders!
EUR-CHF is retesting a
Horizontal support level
Of 0.9518 while trading
In an uptrend so we are
Bullish biased and we
Will be expecting a bullish
Rebound and a move up
Buy!
Comment and subscribe to help us grow!
Check out other forecasts below too!
Disclosure: I am part of Trade Nation's Influencer program and receive a monthly fee for using their TradingView charts in my analysis.

USD_CHF SWING LONG|
✅USD_CHF is approaching a demand level of 0.8704
So according to our strategy
We will be looking for the signs of the reversal in the trend
To jump onto the bullish bandwagon just on time to get the best
Risk reward ratio for us
LONG🚀
✅Like and subscribe to never miss a new idea!✅

EUR_CHF BULLISH BIAS|LONG|
✅EUR_CHF fell again to retest the support of 0.9500
But it is a strong key level
So I think that there is a high chance
We will see a bullish rebound and a move up
LONG🚀
✅Like and subscribe to never miss a new idea!✅
