USD-JPY Will Keep Growing! Buy!
Hello,Traders!
USD-JPY is trading in an
Uptrend along the rising
Support line and the pair
Already made a bullish
Rebound and is consolidating
In a local range so as we
Are bullish biased we will
Be expecting a further
Bullish move up
Buy!
Comment and subscribe to help us grow!
Check out other forecasts below too!
Disclosure: I am part of Trade Nation's Influencer program and receive a monthly fee for using their TradingView charts in my analysis.
SMC-ICT

EUR-AUD Strong Uptrend! Buy!
Hello, Traders!
EUR-AUD is trading along
The rising support line in a
Strong uptrend so we we are
Bullish biased and as the pair
Is going down to retest the
Support we will be expecting
A rebound and a move up
Buy!
Comment and subscribe to help us grow!
Check out other forecasts below too!
Disclosure: I am part of Trade Nation's Influencer program and receive a monthly fee for using their TradingView charts in my analysis.

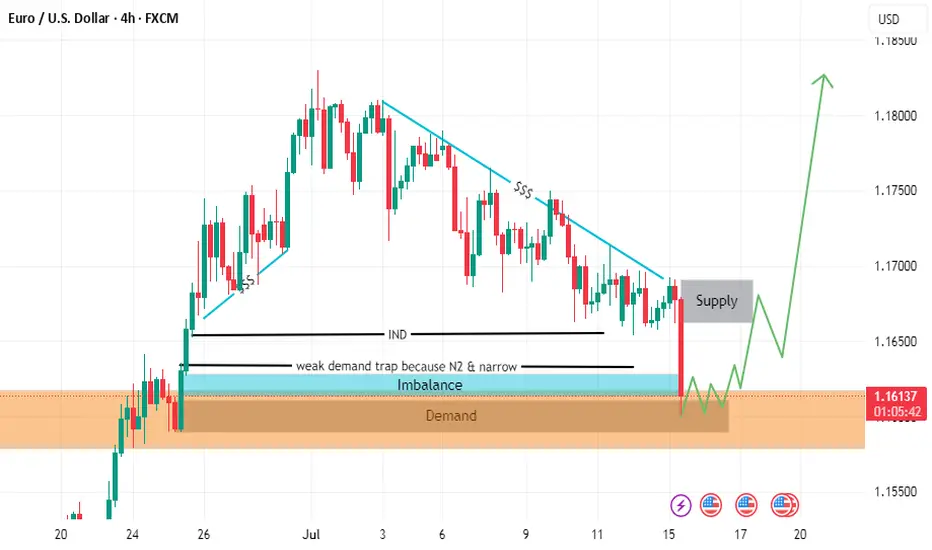
EURUSD long Lion SETUPhello everyone
the price is in a strong demand area
as liquidity has been withdrawn
and the fair value gap has been filled
but we are waiting for formation pattern on a smaller frame in order to enter an upward wave.
we also have resistance area
so in short. I expect an upside go upppp
GOLD LONG FROM RISING SUPPORT|
✅GOLD is trading in an uptrend
And the bullish bias is confirmed
By the rebound we are seeing
After the price retested the support
So I think the growth will continue
LONG🚀
✅Like and subscribe to never miss a new idea!✅
Disclosure: I am part of Trade Nation's Influencer program and receive a monthly fee for using their TradingView charts in my analysis.

EUR-GBP Long From Rising Support! Buy!
Hello,Traders!
EUR-GBP is trading in an
Uptrend along the rising
Support line and the pair
Is going down now so after
The retest we will be
Expecting a bullish rebound
And a move up
Buy!
Comment and subscribe to help us grow!
Check out other forecasts below too!
Disclosure: I am part of Trade Nation's Influencer program and receive a monthly fee for using their TradingView charts in my analysis.

AUD-USD Local Short! Sell!
Hello,Traders!
AUD-JPY is making a bullish
Rebound and the pair is
Making a retest of the key
Horizontal resistance of 0.6497
From where we will be
Expecting a local bearish correction
Sell!
Comment and subscribe to help us grow!
Check out other forecasts below too!
Disclosure: I am part of Trade Nation's Influencer program and receive a monthly fee for using their TradingView charts in my analysis.

EUR_NZD LONG FROM RISING SUPPORT|
✅EUR_NZD is trading in an uptrend
Along the rising support line
Which makes me bullish biased
And the pair is about to retest the rising support
Thus, a rebound and a move up is expected
With the target of retesting the level above at 1.9544
LONG🚀
✅Like and subscribe to never miss a new idea!✅
Disclosure: I am part of Trade Nation's Influencer program and receive a monthly fee for using their TradingView charts in my analysis.

NZD-USD Will Go Down! Sell!
Hello,Traders!
NZD-USD already made a retest
Of the horizontal resistance
Of 0.5992 from where we
Are seeing a bearish reaction
And we will be expecting a
Further bearish move down
Sell!
Comment and subscribe to help us grow!
Check out other forecasts below too!
Disclosure: I am part of Trade Nation's Influencer program and receive a monthly fee for using their TradingView charts in my analysis.

AUD-NZD Rebound Expected! Buy!
Hello,Traders!
AUD-NZD is making a retest
Of the horizontal support
Level of 1.0909 and as the
Pair is trading in an uptrend
We will be expecting a
Local bullish rebound
Buy!
Comment and subscribe to help us grow!
Check out other forecasts below too!
Disclosure: I am part of Trade Nation's Influencer program and receive a monthly fee for using their TradingView charts in my analysis.

NZD_USD POTENTIAL SHORT|
✅NZD_USD is going up to retest
A horizontal resistance of 0.5990
Which makes me locally bearish biased
And I think that we will see a pullback
And a move down from the level
Towards the target below at 0.5947
SHORT🔥
✅Like and subscribe to never miss a new idea!✅
Disclosure: I am part of Trade Nation's Influencer program and receive a monthly fee for using their TradingView charts in my analysis.

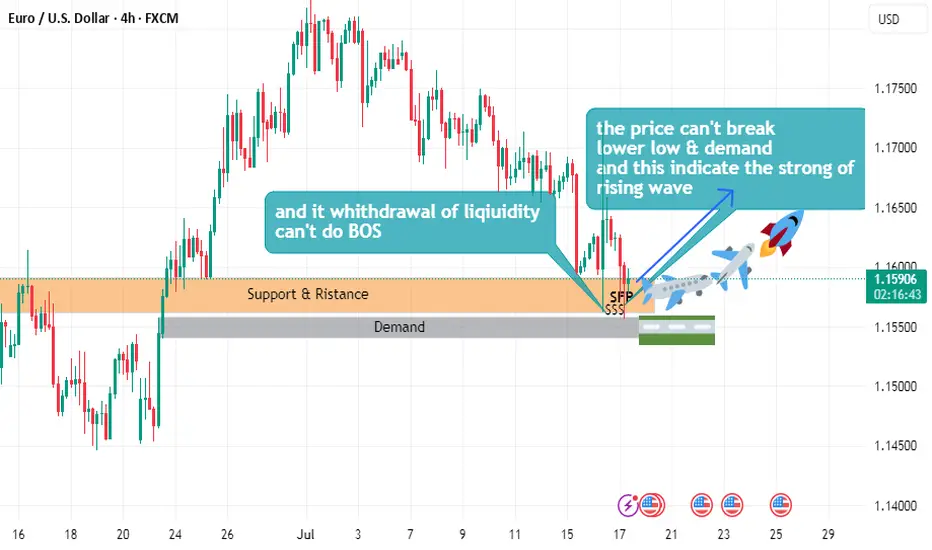
EURUSD buy plane Setuphello
the price can't break lower low
and can't demand
and this indicate the strong of uptrend wave
and it withdrawal of liquidity
and can't do beak of structure
EUR-GBP Long From Rising Support! Buy!
Hello,Traders!
EUR-GBP is trading in an
Uptrend along the rising
Support line and the pair
Is going down now so after
The retest we will be
Expecting a bullish rebound
And a move up
Buy!
Comment and subscribe to help us grow!
Check out other forecasts below too!
Disclosure: I am part of Trade Nation's Influencer program and receive a monthly fee for using their TradingView charts in my analysis.

EUR_JPY WILL GO UP|LONG|
✅EUR_JPY is trading along the rising support line
And as the pair is going up now
After the retest of the line
I am expecting the price to keep growing
To retest the supply levels above at 173.166
LONG🚀
✅Like and subscribe to never miss a new idea!✅
Disclosure: I am part of Trade Nation's Influencer program and receive a monthly fee for using their TradingView charts in my analysis.

EUR-NZD Will Keep Growing! Buy!
Hello,Traders!
EUR-NZD is trading in a
Strong uptrend and the
Pair made a bullish breakout
Of the key horizontal level
Of 1.9580 so we are bullish
Biased and we will be expecting
A further bullish move up
Buy!
Comment and subscribe to help us grow!
Check out other forecasts below too!
Disclosure: I am part of Trade Nation's Influencer program and receive a monthly fee for using their TradingView charts in my analysis.

ETHEREUM WILL KEEP GROWING|LONG|
✅ETHEREUM is trading in a
Strong uptrend and the coin
Broke the important horizontal level
Of 3000$ which is now a support
And we are very bullish biased
And we think that ETH will
Reach at least the previous ATH
Of just short of 5000$ but the
First target is to reach and break
A resistance level of 4100$
LONG🚀
✅Like and subscribe to never miss a new idea!✅
Disclosure: I am part of Trade Nation's Influencer program and receive a monthly fee for using their TradingView charts in my analysis.

GBP-CHF Local Short! Sell!
Hello,Traders!
GBP-CHF made a retest of
The wide horizontal resistance
Of 1.0780 and we are already
Seeing a bearish pullback
So as the pair is trading in a
Downtrend we will be expecting
A further bearish move down
Sell!
Comment and subscribe to help us grow!
Check out other forecasts below too!
Disclosure: I am part of Trade Nation's Influencer program and receive a monthly fee for using their TradingView charts in my analysis.

NZD_CAD LOCAL LONG|
✅NZD_CAD is set to retest a
Strong support level below at 0.8114
After trading in a local downtrend for some time
Which makes a bullish rebound a likely scenario
With the target being a local resistance above at 0.8145
LONG🚀
✅Like and subscribe to never miss a new idea!✅
Disclosure: I am part of Trade Nation's Influencer program and receive a monthly fee for using their TradingView charts in my analysis.

NZD-JPY Long From Rising Support! Buy!
Hello,Traders!
NZD-JPY keeps trading in
An uptrend along the rising
Support line and the pair made
A quick retest and we are seeing
A rejection so we are bullish
Biased and we will be expecting
A further bullish move up
Buy!
Comment and subscribe to help us grow!
Check out other forecasts below too!
Disclosure: I am part of Trade Nation's Influencer program and receive a monthly fee for using their TradingView charts in my analysis.

GOLD LONG FROM RISING SUPPORT|
✅GOLD is trading in an uptrend
Which makes me bullish biased
And the price is retesting the rising support
Thus, a rebound and a move up is expected
With the target of retesting the level above at 3,350$
LONG🚀
✅Like and subscribe to never miss a new idea!✅
Disclosure: I am part of Trade Nation's Influencer program and receive a monthly fee for using their TradingView charts in my analysis.

EURJPY POSSIBLE EXPECTED MOVEIn this analysis we're focusing on 1H time frame. Today I'm looking for a potential buy move from my marked key levels. This is a higher time frame analysis. Let's analyze more deeply into smaller timeframe and potential outcomes. Confirmation is very important.
Always use stoploss for your trade.
Always use proper money management and proper risk to reward ratio.
This is my analysis.
#EURJPY 1H Technical Analysis Expected Move.

XAUUSD ANALYSISOn gold currently we're analyzing 2H time frame. As we know that current trend was bullish. At this stage, I'm anticipating a retracement towards my Point of Interest (POI), where I’ll be looking for a clear bullish confirmation, ideally through candlestick structure or solid price action. Only upon receiving that confirmation will I consider entering a buy position.
This outlook is based on the higher time frame structure. For now, I'm observing patiently to see how price unfolds. Until the market sweeps the SSL liquidity, I will remain on the sidelines no entries until that key liquidity level has been taken. Confirmation is key.
Always use stoploss for your trade.
Always use proper money management and proper risk to reward ratio.
#XAUUSD 2H Technical Analysis Expected Move.

SILVER Support Ahead! Buy!
Hello,Traders!
SILVER is going down now
But the price is trading in a
Long-term uptrend so we are
Bullish biased and after the
Price retests of the horizontal
Support support below
Around 37.20$ we will be
Expecting a bullish rebound
Buy!
Comment and subscribe to help us grow!
Check out other forecasts below too!
Disclosure: I am part of Trade Nation's Influencer program and receive a monthly fee for using their TradingView charts in my analysis.

EUR_USD BEARISH BREAKOUT|SHORT|
✅EUR_USD was trading along
The rising support line but
Now we are seeing a strong bearish
Breakout and the breakout is
Confirmed so we are bearish
Biased and we will be expecting
A further bearish move down
After the potential pullback
SHORT🔥
✅Like and subscribe to never miss a new idea!✅
Disclosure: I am part of Trade Nation's Influencer program and receive a monthly fee for using their TradingView charts in my analysis.
