USDCAD's Opportunity Bell Is Ringing — Don’t Miss Out!Hey there, my valued friends!
I’ve prepared a fresh USDCAD analysis just for you.
📌 If the 1.37245 level breaks, the next target will be 1.38000.
Every single like you send my way is the biggest motivation behind sharing these analyses.
🙌 Huge thanks to each and every one of you who supports me!
Would you like to add a visual or a catchy headline to boost engagement even more? I can help with that too.
SMC

Mastering the Bollinger Bands- How to use it in trading?What is the Bollinger Bands
Bollinger Bands is a popular technical analysis tool developed by John Bollinger in the 1980s. It is designed to measure market volatility and provide signals for potential price reversals or trend continuations. The Bollinger Bands consist of three lines: a simple moving average in the middle, usually calculated over 20 periods, and two outer bands that are placed a set number of standard deviations above and below the moving average. These outer bands automatically adjust to market conditions, expanding and contracting based on price volatility. The indicator is widely used by traders to understand the relative highs and lows of a financial instrument in relation to recent price action.
What will be discussed?
- How does it work with the lower band and upper band?
- What does the narrowing mean?
- What does the widening mean?
- How to trade with the Bollingers Bands?
-------------------------
How does it work with the lower band and upper band?
The upper band and the lower band serve as dynamic levels of resistance and support. When the price of an asset touches or exceeds the upper band, it may be considered overbought, suggesting that a reversal or pullback could be near. Conversely, when the price approaches or breaks below the lower band, the asset may be viewed as oversold, indicating a potential rebound. These bands do not generate definitive buy or sell signals on their own but instead help traders assess market conditions. The interaction of price with the upper and lower bands often provides visual cues about the momentum and direction of the market, allowing for more informed decision-making.
-------------------------
What does the narrowing mean?
The narrowing of the Bollinger Bands occurs when the price becomes less volatile over time. This contraction indicates a period of consolidation or low market activity, where the price is trading in a tighter range. Narrowing bands are often interpreted as a signal that a significant price movement may be coming soon, as low volatility tends to precede high volatility. This phase is sometimes referred to as the "squeeze," and traders closely monitor it to anticipate breakout opportunities. The direction of the breakout, whether upward or downward, is not predicted by the narrowing itself but usually follows shortly after the bands have contracted.
-------------------------
What does the widening mean?
The widening of the Bollinger Bands reflects increasing market volatility. When the price starts to move rapidly either up or down, the bands spread further apart to accommodate this movement. This expansion typically confirms that a new trend is underway or that a breakout has occurred. The wider the bands become, the greater the degree of price fluctuation. During these times, traders may observe stronger momentum in the market, and the continuation of the move may be supported by the growing distance between the bands. However, extremely wide bands may also suggest that a reversal could be nearing, as the market can become overstretched in either direction.
-------------------------
How to trade with the Bollinger Bands?
Trading with Bollinger Bands involves using the bands to identify entry and exit points based on the behavior of price in relation to the upper and lower bands. One common approach is to buy when the price touches or breaks below the lower band and shows signs of bouncing back, and to sell when the price reaches or moves above the upper band and begins to retreat. Another strategy involves waiting for the bands to narrow significantly and then entering a trade in the direction of the breakout that follows. Traders often use Bollinger Bands in combination with other indicators such as RSI, MACD, or volume to confirm signals and reduce the risk of false breakouts. It is important to remember that Bollinger Bands are not predictive on their own but are most effective when used as part of a broader technical analysis framework.
-------------------------
Disclosure: I am part of Trade Nation's Influencer program and receive a monthly fee for using their TradingView charts in my analysis.
Thanks for your support.
- Make sure to follow me so you don't miss out on the next analysis!
- Drop a like and leave a comment!

Bitcoin - Power of 3 in play!The chart illustrates a classic application of the ICT concept known as the "Power of 3," a theory that outlines a common market behavior pattern consisting of three phases: consolidation, manipulation, and distribution. This model is often used by smart money traders to identify points where institutional players may be accumulating or offloading positions, typically by targeting retail liquidity.
Consolidation
In this scenario, Bitcoin has exhibited a prolonged period of consolidation, where price fluctuated within a defined range throughout most of June and into early July. This range-bound movement, highlighted in blue, represents the market gathering orders from both buyers and sellers, creating a liquidity pool on either side of the range. During this phase, market participants become uncertain about the next direction, while smart money positions itself for the next move.
Manipulation/sweeping liquidity
Recently, Bitcoin has broken out of this consolidation range in an upward move, which is now being interpreted as the manipulation phase. This move served to sweep the liquidity resting just above the established highs of the range. These highs were prime areas for stop-losses of short sellers and breakout entries of longs, making them attractive targets for institutional manipulation. The price push above this level, marked in green, appears to be a false breakout designed to trap breakout traders and trigger stops before a likely reversal.
Possible distribution phase
Following this manipulation phase, the chart suggests we are entering or have just begun the distribution phase, marked in red. Distribution in the context of the Power of 3 refers to the process where smart money offloads their positions onto unsuspecting buyers who entered during the manipulation. The anticipated outcome is a sustained move to the downside, aligning with the forecasted bearish structure shown on the right side of the chart.
Conclusion
In conclusion, the chart reflects a textbook ICT Power of 3 pattern in play on Bitcoin. After a lengthy period of sideways consolidation that built liquidity on both sides, Bitcoin executed an upward manipulation to capture liquidity above the range. Now, with the highs swept and buy-side liquidity taken, the market looks poised for distribution, signaling a probable downward move in the near term. Traders familiar with smart money concepts would view this as a high-probability reversal zone.
Disclosure: I am part of Trade Nation's Influencer program and receive a monthly fee for using their TradingView charts in my analysis.
Thanks for your support.
- Make sure to follow me so you don't miss out on the next analysis!
- Drop a like and leave a comment!

GOLD SWING LONG|
✅GOLD is trading in a strong
Long-term uptrend along the
Rising support line so we are
Bullish biased and after the price
Breakout of the local opening wedge
We we will be expecting a
Further bullish move up
LONG🚀
✅Like and subscribe to never miss a new idea!✅
Disclosure: I am part of Trade Nation's Influencer program and receive a monthly fee for using their TradingView charts in my analysis.

NZD-CHF Broken Wedge Pattern! Buy!
Hello,Traders!
NZD-CHF was trading in a
Narrowing bullish wedge pattern
And now we are finally seeing
A bullish breakout so we are
Bullish biased now and we
Will be expecting a further
Bullish move up after a
Local correction
Buy!
Comment and subscribe to help us grow!
Check out other forecasts below too!
Disclosure: I am part of Trade Nation's Influencer program and receive a monthly fee for using their TradingView charts in my analysis.

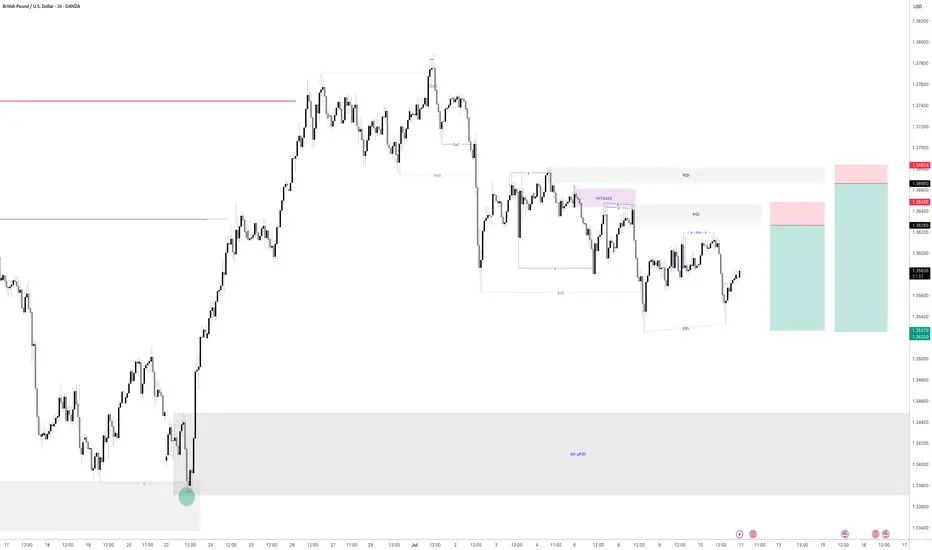
GBPUSD - 2 Selling opportunitiesLooking at GBPUSD
We have 2 opportunities to get short. Both have a build of liquidity before the areas of supply before them. This means we are looking for the early seller to get into the market before we get in so that all the early seller get stopped out.
As we can see the order flow on this is still bearish. So until the market shows me it want to go higher then we will remain bearish
Keep a close eye on this for tomorrow
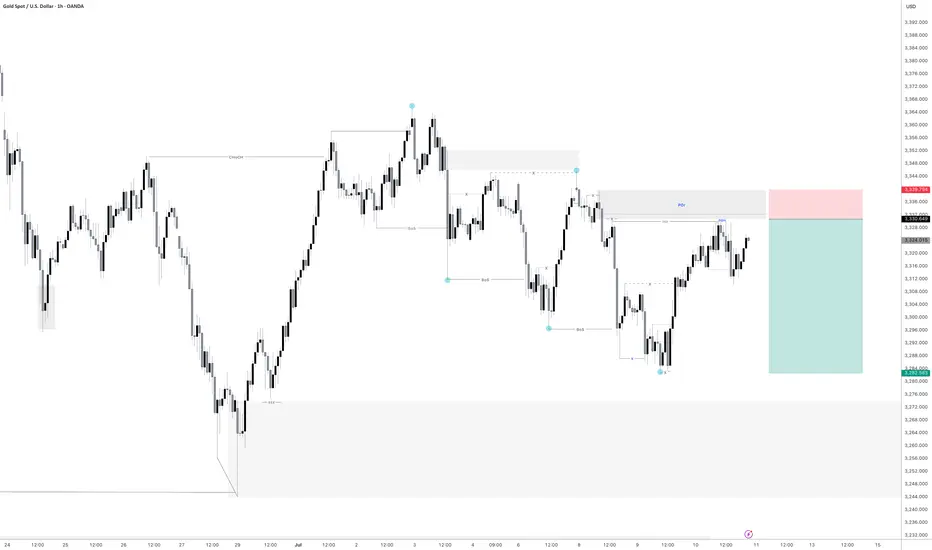
Gold - Sell inboundGold is looking very promising for another sell off. we are already showing signs that price has intent to move lower with some lower timeframe break of structure.
Just waiting for a manipulation now of the most recent highs put in before price moves lower.
Let's see if we get an entry tonight.
Bitcoin – Rejection Confirms Trap, Next Stop: $107kBitcoin attempted to take out the swing high around 110.5k but failed to clear the previous all-time high, resulting in a sharp rejection. This failure marks a significant turning point, suggesting a lack of bullish momentum at premium levels. The rejection came after a sweep of equal highs within a well-defined resistance zone, indicating a potential liquidity grab.
Highs Swept, But No Breakout
After dropping into support around the 107.5k region, price managed to push up and form a new swing high, but once again met heavy selling pressure after sweeping the prior equal highs. That sweep and the subsequent rejection give this structure the character of a classic liquidity trap, where smart money runs the highs only to reverse.
Weak Lows Below
The support zone has now been tapped multiple times, and the most recent low is structurally weak. It failed to produce a higher high, which makes it vulnerable to a clean stop hunt. Given this context, these lows are likely to be targeted next, as price seeks out sell-side liquidity resting beneath.
Expected Path Forward
I’m expecting further downside to unfold from here. The rejection from resistance, paired with the weak internal structure, suggests Bitcoin will take out the weak lows near 107.5k. Once those lows are swept, I expect a bullish reaction from the same demand zone, setting up a potential long opportunity back into the 109k–110k area. The plan is to look for signs of a reversal after the sweep, such as a 5M market structure shift or a fair value gap entry setup.
Liquidity Map and Trade Plan
The current price action is best viewed through the lens of liquidity. The highs were engineered to trap breakout buyers and then rejected. Now, the weak lows offer the next logical draw on liquidity. My focus is on short-term downside targeting that 107.2k–107.5k support region, followed by a potential bullish reversal setup once that liquidity is cleared.
Conclusion
This is a clean example of a failed breakout, followed by engineered liquidity moves in both directions. As long as price respects the current structure, my bias remains short into the weak lows, followed by a high-probability long setup once those lows are swept and the market shifts.
Disclosure: I am part of Trade Nation's Influencer program and receive a monthly fee for using their TradingView charts in my analysis.
___________________________________
Thanks for your support!
If you found this idea helpful or learned something new, drop a like 👍 and leave a comment, I’d love to hear your thoughts! 🚀

AUD_CAD WILL KEEP GROWING|LONG|
✅AUD_CAD is going up
Now and the pair made a bullish
Breakout of the key horizontal
Level of 0.8980 and the breakout
Is confirmed so we are bullish
Biased and we will be expecting
A further bullish move up
LONG🚀
✅Like and subscribe to never miss a new idea!✅
Disclosure: I am part of Trade Nation's Influencer program and receive a monthly fee for using their TradingView charts in my analysis.

EUR-USD Bullish Bias! Buy!
Hello,Traders!
EUR-USD is trading in an
Uptrend and the pair is
Making a local bearish correction
But we are bullish biased and
After the retest of the horizontal
Support of 1.1640
We will be expecting a further
Bullish move up
Buy!
Comment and subscribe to help us grow!
Check out other forecasts below too!
Disclosure: I am part of Trade Nation's Influencer program and receive a monthly fee for using their TradingView charts in my analysis.

RETRACEMENT AND CONTINUATION FOR FRIDAYS TRADEI anticipate that Friday's trade will either retrace to 1.17151 or break through the high, liquidating the 1.17495 level, and then move further below.


US30: Move Up Expected! Long!
My dear friends,
Today we will analyse US30 together☺️
The in-trend continuation seems likely as the current long-term trend appears to be strong, and price is holding above a key level of 44,393.91 So a bullish continuation seems plausible, targeting the next high. We should enter on confirmation, and place a stop-loss beyond the recent swing level.
❤️Sending you lots of Love and Hugs❤️

GOLD: Local Bullish Bias! Long!
My dear friends,
Today we will analyse GOLD together☺️
The market is at an inflection zone and price has now reached an area around 3,324.79 where previous reversals or breakouts have occurred.And a price reaction that we are seeing on multiple timeframes here could signal the next move up so we can enter on confirmation, and target the next key level of 3,330.13.Stop-loss is recommended beyond the inflection zone.
❤️Sending you lots of Love and Hugs❤️

EURUSD: Absolute Price Collapse Ahead! Short!
My dear friends,
Today we will analyse EURUSD together☺️
The price is near a wide key level
and the pair is approaching a significant decision level of 1.17309 Therefore, a strong bearish reaction here could determine the next move down.We will watch for a confirmation candle, and then target the next key level of 1.17241..Recommend Stop-loss is beyond the current level.
❤️Sending you lots of Love and Hugs❤️

SILVER: Will Go Down! Short!
My dear friends,
Today we will analyse SILVER together☺️
The recent price action suggests a shift in mid-term momentum. A break below the current local range around 36.619 will confirm the new direction downwards with the target being the next key level of 36.530 .and a reconvened placement of a stop-loss beyond the range.
❤️Sending you lots of Love and Hugs❤️

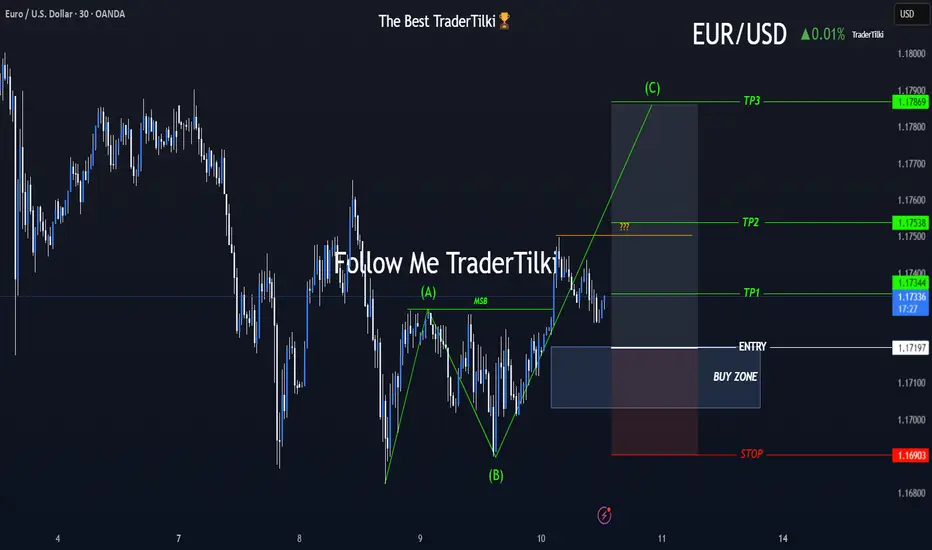
A New Chapter Begins with EURUSD’s ABC Wave Formation!🎯 Hey Guys,
I’ve prepared a fresh EURUSD analysis for you.
The market has shifted direction, and an ABC wave structure has emerged.
I’ve placed a Buy Limit order based on my entry level.
Below, you’ll find my detailed target zones and entry specifics:
🟩 Buy Limit Order: 1.17197
🟥 Stop Loss: 1.16903
📌 Targets:
🔹 TP1: 1.17344
🔹 TP2: 1.17538
🔹 TP3: 1.17869
📊 Risk/Reward Ratio: 2.27
Your likes and support are what keep me motivated to share these analyses consistently.
Huge thanks to everyone who shows love and appreciation! 🙏
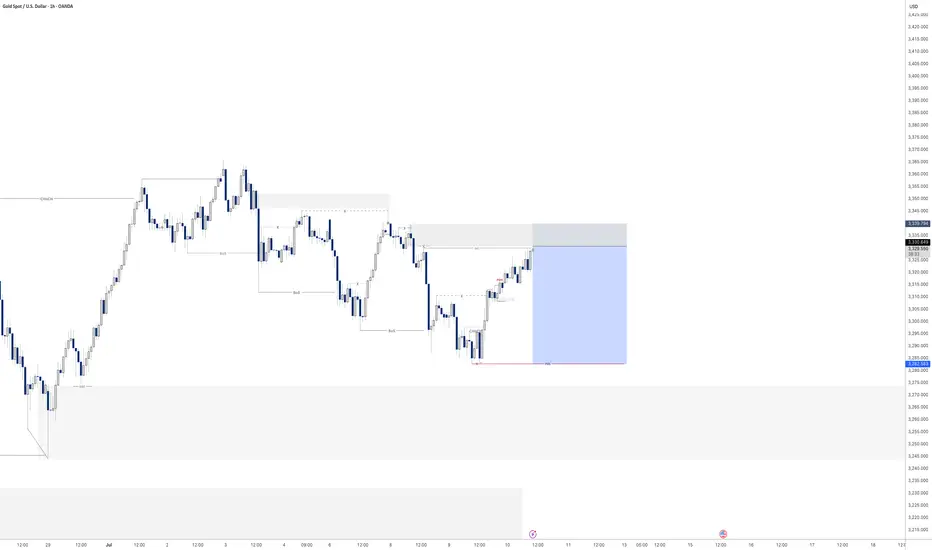
Gold - Sell before longer term buyLooking at gold we are a matter of a few pips away from entry. looking to play gold down till our larger 4H area of demand seeing as we have had a CHoCH to the upside.
There for i will be looking to take my sell position down to 3283.5 at a bare minimum as it was the previous structure level in which we turned around.
Lets see if we get tagged in. If not i will jump down to the lower TF and see if we can get a confirmation that price is going to turn from here.
POSSIBLE BEARISH MOVE SCENERIO Currently we're monitoring 30M time frame chart. I’m expecting a sell move from the P.O.I zone marked on the chart. Since today is the first day of the week, the market volume is a bit low. Now let's see when the price reaches our P.O.I zone, and once it does, how the price behaves. We'll be watching for any bearish signs or confirmations. We’ll only enter the trade after getting a proper bearish confirmation. We'll also wait for the NY session to open before making any decisions. Let's see how this trade setup plays out.
Let's delve deeper into these levels and potential outcomes.
Always use stoploss for your trade.
Always use proper money management and proper risk to reward ratio.
#GOLD 30M Technical Analysis Expected Move.

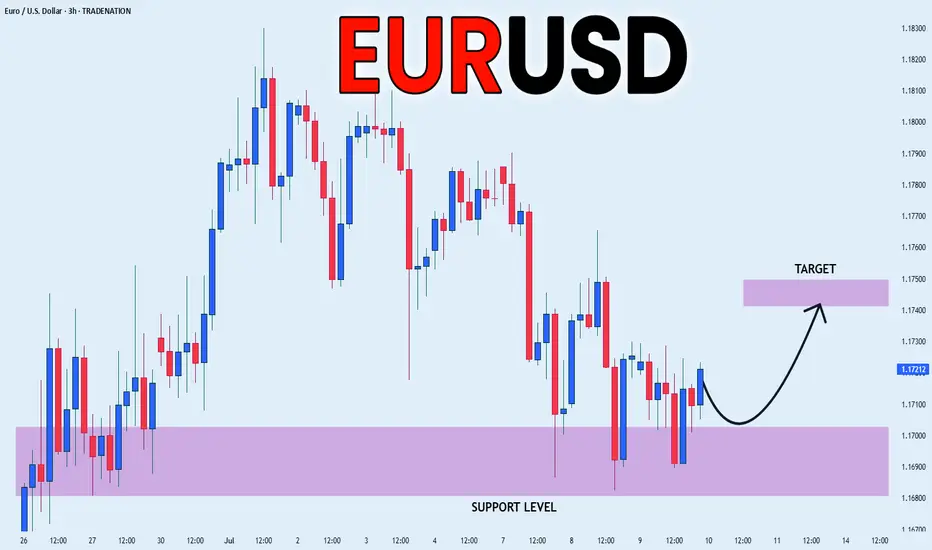
EUR_USD LOCAL REBOUND|LONG|
✅EUR_USD has retested a key support level of 1.1690
And as the pair is already making a bullish rebound
A move up to retest the supply level above at 1.1744 is likely
LONG🚀
✅Like and subscribe to never miss a new idea!✅
Disclosure: I am part of Trade Nation's Influencer program and receive a monthly fee for using their TradingView charts in my analysis.
NATGAS Support Ahead! Buy!
Hello,Traders!
NATGAS keeps falling but
The price will soon hit a
Horizontal support of 2.90$
From where we will be expecting
A local bullish rebound
Buy!
Comment and subscribe to help us grow!
Check out other forecasts below too!
Disclosure: I am part of Trade Nation's Influencer program and receive a monthly fee for using their TradingView charts in my analysis.

CAD_CHF STRONG SUPPORT|LONG|
✅CAD_CHF has been falling recently
And the pair seems locally oversold
So as the pair is approaching a
Horizontal support of 0.5790
Price growth is to be expected
LONG🚀
✅Like and subscribe to never miss a new idea!✅
Disclosure: I am part of Trade Nation's Influencer program and receive a monthly fee for using their TradingView charts in my analysis.

AUD-NZD Short From Resistance! Sell!
Hello,Traders!
AUD-NZD keeps growing
And the pair is overbought
So after it hits the horizontal
Resistance of 1.0921 from
Where we will be expecting
A local bearish correction
Sell!
Comment and subscribe to help us grow!
Check out other forecasts below too!
Disclosure: I am part of Trade Nation's Influencer program and receive a monthly fee for using their TradingView charts in my analysis.
