SILVER WILL FALL|SHORT|
✅SILVER is going up now
But a strong resistance level is ahead at 37,60$
Thus I am expecting a pullback
And a move down towards the target of 36,69$
SHORT🔥
✅Like and subscribe to never miss a new idea!✅
Disclosure: I am part of Trade Nation's Influencer program and receive a monthly fee for using their TradingView charts in my analysis.
SMC

CAD_JPY BEARISH BREKAOUT|SHORT|
✅CAD_JPY broke the key structure level of 107.400
While trading in an local downtrend
Which makes me bearish
And I think that after the retest of the broken level is complete
A rebound and bearish continuation will follow
SHORT🔥
✅Like and subscribe to never miss a new idea!✅
Disclosure: I am part of Trade Nation's Influencer program and receive a monthly fee for using their TradingView charts in my analysis.

GBP-AUD Growth Ahead! Buy!
Hello,Traders!
GBP-AUD made a retest
Of the horizontal support
Of 2.0420 and we are
Already seeing a bullish
Rebound so we will be
Expecting a further
Bullish move up
Buy!
Comment and subscribe to help us grow!
Check out other forecasts below too!
Disclosure: I am part of Trade Nation's Influencer program and receive a monthly fee for using their TradingView charts in my analysis.

EUR-AUD Bullish Breakout! Buy!
Hello,Traders!
EUR-AUD made a bullish
Breakout of the falling resistance
And the breakout is confirmed
So we are bullish biased
And we will be expecting
A further bullish move up
On Monday!
Buy!
Comment and subscribe to help us grow!
Check out other forecasts below too!
Disclosure: I am part of Trade Nation's Influencer program and receive a monthly fee for using their TradingView charts in my analysis.

GOLD: Target Is Down! Short!
My dear friends,
Today we will analyse GOLD together☺️
The market is at an inflection zone and price has now reached an area around 3,353.10 where previous reversals or breakouts have occurred.And a price reaction that we are seeing on multiple timeframes here could signal the next move down so we can enter on confirmation, and target the next key level of 3,335.20..Stop-loss is recommended beyond the inflection zone.
❤️Sending you lots of Love and Hugs❤️

CHF_JPY LOCAL SHORT|
✅CHF_JPY has been growing recently
And the pair seems locally overbought
So as the pair is approaching a
Horizontal resistance of 186.000
Price decline is to be expected
SHORT🔥
✅Like and subscribe to never miss a new idea!✅
Disclosure: I am part of Trade Nation's Influencer program and receive a monthly fee for using their TradingView charts in my analysis.

GOLD Local Short! Sell!
Hello,Traders!
GOLD made a retest
Of the horizontal resistance
Of 3313$ and we are already
Seeing a bearish reaction and
We will be expecting a further
Bearish move down
Sell!
Comment and subscribe to help us grow!
Check out other forecasts below too!
Disclosure: I am part of Trade Nation's Influencer program and receive a monthly fee for using their TradingView charts in my analysis.

EUR_CHF WILL KEEP FALLING|SHORT|
✅EUR_CHF broke the key
Structure level of 0.9295
While trading in an local downtrend
Which makes me bearish
And I think that after the retest of the
Broken level is complete
A rebound and bearish
Continuation will follow
SHORT🔥
✅Like and subscribe to never miss a new idea!✅
Disclosure: I am part of Trade Nation's Influencer program and receive a monthly fee for using their TradingView charts in my analysis.

USD_JPY RESISTANCE AHEAD|SHORT|
✅USD_JPY is going up now
But a strong resistance level is ahead at 151.232
Thus I am expecting a pullback
And a move down towards the target of 150.368
SHORT🔥
✅Like and subscribe to never miss a new idea!✅
Disclosure: I am part of Trade Nation's Influencer program and receive a monthly fee for using their TradingView charts in my analysis.

AUD-USD Will Go Down! Sell!
Hello,Traders!
AUD-USD is trading in a
Downtrend and the pair
Broke the key horizontal
Level of 0.6470 which is
Now a resistance then
Made a retest and a
Confident pullback which
Reinforces our bearish
Bias and makes us expect
A further bearish move down
Sell!
Comment and subscribe to help us grow!
Check out other forecasts below too!
Disclosure: I am part of Trade Nation's Influencer program and receive a monthly fee for using their TradingView charts in my analysis.

EUR-USD Bearish Breakout! Sell!
Hello,Traders!
EUR-USD made a bearish
Breakout of the key horizontal
Level of 1.1460 then made
A retest and a pullback so
We are bearish biased and
We will be expecting a
Further bearish continuation
Sell!
Comment and subscribe to help us grow!
Check out other forecasts below too!
Disclosure: I am part of Trade Nation's Influencer program and receive a monthly fee for using their TradingView charts in my analysis.

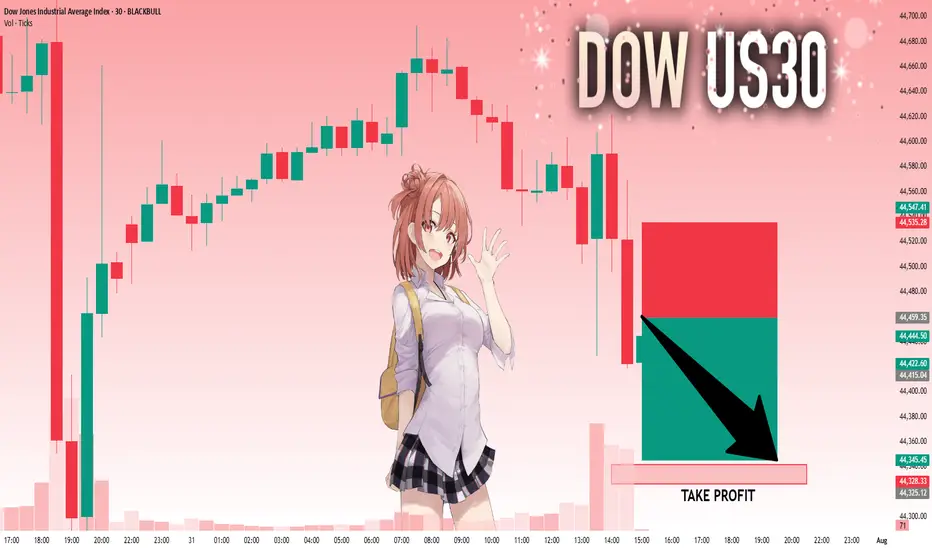
US30: Absolute Price Collapse Ahead! Short!
My dear friends,
Today we will analyse US30 together☺️
The in-trend continuation seems likely as the current long-term trend appears to be strong, and price is holding below a key level of 44,459.35 So a bearish continuation seems plausible, targeting the next low. We should enter on confirmation, and place a stop-loss beyond the recent swing level.
❤️Sending you lots of Love and Hugs❤️
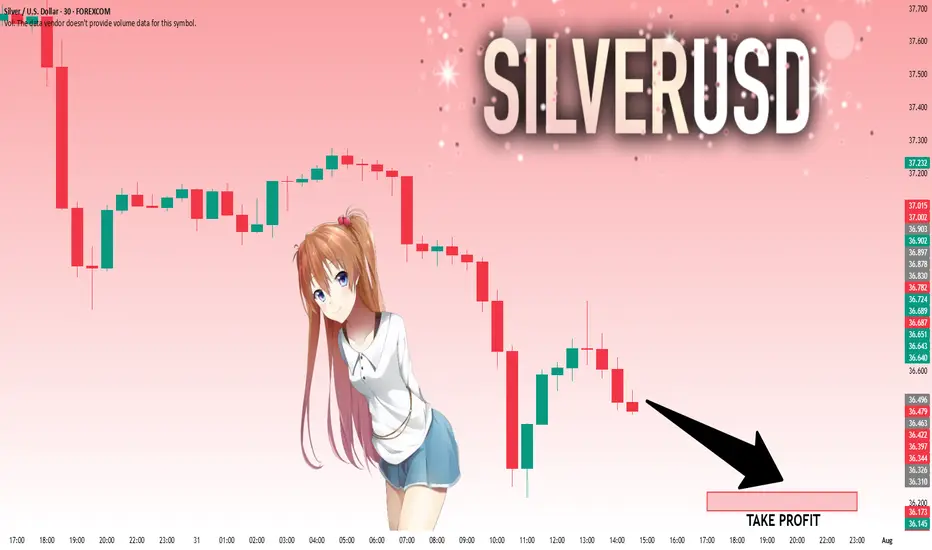
SILVER: Will Go Down! Short!
My dear friends,
Today we will analyse SILVER together☺️
The market is at an inflection zone and price has now reached an area around 36.490 where previous reversals or breakouts have occurred.And a price reaction that we are seeing on multiple timeframes here could signal the next move down so we can enter on confirmation, and target the next key level of 36.231..Stop-loss is recommended beyond the inflection zone.
❤️Sending you lots of Love and Hugs❤️
EURUSD: The Market Is Looking Up! Long!
My dear friends,
Today we will analyse EURUSD together☺️
The price is near a wide key level
and the pair is approaching a significant decision level of 1.14350 Therefore, a strong bullish reaction here could determine the next move up.We will watch for a confirmation candle, and then target the next key level of 1.14588.Recommend Stop-loss is beyond the current level.
❤️Sending you lots of Love and Hugs❤️

GOLD: Strong Bullish Sentiment! Long!
My dear friends,
Today we will analyse GOLD together☺️
The recent price action suggests a shift in mid-term momentum. A break above the current local range around 3,296.556 will confirm the new direction upwards with the target being the next key level of 3,310.375 and a reconvened placement of a stop-loss beyond the range.
❤️Sending you lots of Love and Hugs❤️

BTC vs ETH: Lil Bro not waiting on nobody?!As BTC is stuck trying to convince everyone to stay long, ETH is using its bullish orderblocks really well...shorts are showing signs of letting go in these ranges.
Would like to hear your take!

Gold Market Update: Major Support at and Supply atGold is recovering after a strong drop from the previous range high. Price is approaching a 4H Order Block near the 3300–3310 zone, which may act as a supply area. A minor liquidity zone has just been tapped, suggesting a potential short-term rejection.
The major support lies at 3269, which sparked the recent bullish move. If price rejects from the OB zone, a pullback toward this support is likely. However, a clean break and hold above the OB may signal further upside.
📌 Key Levels:
Supply Zone: 3300–3310
Support: 3269
🧠 Wait for clear confirmation before executing trades.

Short Breakdown of Cardano (ADAUSDT) weekly/daily technicalsLooked over this for a friend. Rowland I would love your feedback in the comments 🫡
I will see my biggest expectation is for this to make it's way into the weekly imbalance range below the weekly Mother Candle we are existing within. The entire crypto market seems to want to revisit some key lows to correct some inefficiently delivered rally ranges (meaning too many pending orders left behind due to price not coming back to grab them, happens when HUGE money places--attempts to place/fill--bulk orders).
We are getting what I think is a temporary bullish correction due to taking of profits at key lows. It is my belief/observation that after correcting the newly minted bearish range (grabbing pending shorts above daily highs--turtle soup I think they call it), we will be able to drive down into the bullish imbalance weekly candle's range.
Let's see how we go! 😈

USOIL GROWTH AHEAD|
✅CRUDE OIL broke the key
Structure level of 69.50$
While trading in an local uptrend
Which makes me bullish biased
And I think that after the retest of the broken level is complete
A rebound and bullish continuation will follow
LONG🚀
✅Like and subscribe to never miss a new idea!✅
Disclosure: I am part of Trade Nation's Influencer program and receive a monthly fee for using their TradingView charts in my analysis.

NATGAS Free Signal! Buy!
Hello,Traders!
NATGAS went down and
Almost reached the horizontal
Support of 3.014$ from where
We can enter a long trade
With the Take Profit of 3.066$
And the Stop Loss of 2.981$
Buy!
Comment and subscribe to help us grow!
Check out other forecasts below too!
Disclosure: I am part of Trade Nation's Influencer program and receive a monthly fee for using their TradingView charts in my analysis.

USD_CHF LOCAL SHORT|
✅USD_CHF price went up sharply
But a strong resistance level was hit at 0.8152
Thus, as a pullback is already happening
And a move down towards the
Target of 0.8113 shall follow
SHORT🔥
✅Like and subscribe to never miss a new idea!✅
Disclosure: I am part of Trade Nation's Influencer program and receive a monthly fee for using their TradingView charts in my analysis.

EURUSD market structure analysis on M15, H1 timeframesH1 Timeframe – Main Trend: BULLISH
🟢 Current Situation:
The H1 structure is showing a clear sequence of Higher Highs (HH) and Higher Lows (HL) ⇒ indicating an uptrend.
The market is currently in a retracement phase following the last bullish impulse.
Price is approaching a demand zone from a previous structure, where buy orders may be stacked.
📉 M15 Timeframe – Main Trend: BEARISH (within H1 pullback)
🔍 Current Observations:
While H1 is in a retracement, M15 shows a clear bearish market structure (Lower Lows – Lower Highs).
However:
Price has tapped into the H1 demand zone.
A liquidity grab (sweep of highs/lows) just occurred on M15.
This was followed by a Break of Structure (BOS) to the upside ⇒ signaling potential absorption of sell-side liquidity and a reversal in alignment with the higher timeframe (H1).

USD-JPY Will Keep Growing! Buy!
Hello,Traders!
USD-JPY keep growing and
The pair made a bullish breakout
Of the key horizontal level
Of 149.181 and the pair is
Already retesting the new
Support and we will be
Expecting a further
Bullish move up
Sell!
Comment and subscribe to help us grow!
Check out other forecasts below too!
Disclosure: I am part of Trade Nation's Influencer program and receive a monthly fee for using their TradingView charts in my analysis.
