CAD-CHF Bullish Rebound Ahead! Buy!
Hello,Traders!
CAD-CHF fell down sharply
And the pair was oversold
So we are not surprised to
See a bullish rebound from
The strong horizontal support
Around 0.5830 level and we
Think that we are likely
To see a further bullish move up
Buy!
Comment and subscribe to help us grow!
Check out other forecasts below too!
Disclosure: I am part of Trade Nation's Influencer program and receive a monthly fee for using their TradingView charts in my analysis.
SMC

Bitcoin - Bears Take Control, Reversal Coming?After an aggressive bullish rally, Bitcoin has filled a clean 1H imbalance zone near 108K and swept short-term liquidity above recent 1H highs. The move into premium pricing saw clear signs of rejection, with a strong bearish reaction directly inside the imbalance area. This reaction confirms the area as a valid supply zone and signals that bulls may have exhausted their momentum in the short term.
Liquidity Sweep and Rejection
The sweep of prior highs was sharp and quick, lacking follow-through, and was immediately followed by rejection wicks and a drop in momentum. This kind of price action typically hints at engineered liquidity grabs, where smart money drives price into inefficiencies to fill orders before reversing direction. That liquidity sweep, paired with the fill of the 1H FVG, increases the probability that this high is now set in place for a short-term reversal.
Key Short-Term Level to Watch
The immediate level of interest lies at the most recent low before the rally, marked clearly as a potential short-term support. This low often acts as a magnet post-sweep, as price retraces to test if there’s real buyer interest left or not. If this low fails to hold, the bearish momentum could accelerate into the nearby 4H Fair Value Gap around the 102.5K–101.9K area.
Fair Value Gap and Lower Target
That 4H FVG has not yet been filled, and there’s also a small unmitigated imbalance sitting just above it. If price drops into this zone and still fails to show strong buyer interest, the path opens toward a more significant downside move. The final downside target sits near 98K, highlighted by a higher timeframe demand area and major structure level. This zone would only come into play if all intermediate support levels break cleanly.
Bearish Roadmap
Short-term, I expect a retest of the recent low, followed by a possible reaction. But if that reaction fails and momentum stays bearish, the 4H FVG fill becomes highly likely. A break below that would shift control decisively to sellers, with 98K as the next major liquidity pocket to target. This move would also clean out most of the inefficiencies left behind by the recent aggressive bullish move.
Conclusion
The rejection from the 1H imbalance and liquidity sweep suggest Bitcoin’s recent rally may be done for now. Until we reclaim the 1H FVG and break above recent highs with strength, the bias is bearish. If the key low breaks, I’ll be watching how price reacts inside the FVG zone. A weak reaction could open up the flush toward the 98K level for a larger liquidity draw.
___________________________________
Thanks for your support!
If you found this idea helpful or learned something new, drop a like 👍 and leave a comment, I’d love to hear your thoughts! 🚀

US30 - ShortLooking for the Short on US30 final pull back before we see extension to the upside 45,000.

US100 - Liquidity sweep above the ATHIntroduction
The US100 has been exhibiting a strong upward trend on the daily timeframe ever since the sharp correction in early April. This sustained bullish momentum culminated in a break above the previous all-time high (ATH) earlier today. However, this breakout may not be entirely convincing just yet, as there are signs of a potential short-term reversal. The move above the ATH could represent a liquidity sweep, where price action briefly pushes past a key level before retracing, possibly trapping late buyers.
Liquidity Sweep
On the daily chart, the US100 did succeed in breaching the previous ATH, but the breakout appears to have been short-lived. Price quickly reversed after the new high was printed, leaving behind only a wick above the ATH. This type of price action forms what is commonly referred to as a swing failure pattern, a scenario where the market tests liquidity above a key level before turning back down. Such a pattern often signals upcoming weakness, especially when the breakout lacks strong follow-through or volume support.
4H Fair Value Gap (FVG)
During the most recent leg up, the US100 left behind an unfilled fair value gap (FVG) on the 4-hour timeframe. This imbalance zone, created when price moves too quickly in one direction without enough time for buyers and sellers to match orders evenly, often acts as a magnet for price to return to. In the context of the current market structure, this 4H FVG could provide a meaningful support level if the index does experience a pullback. Should the index find support here and show signs of renewed buying interest, the broader uptrend is likely to continue. However, if this zone fails to hold, we may see a deeper retracement toward lower support levels.
Conclusion
While the US100 remains in a strong and well-defined uptrend on the higher timeframes, the recent price action above the ATH introduces the possibility of a short-term pullback. The appearance of a swing failure pattern and the presence of an untested 4H FVG suggest that some corrective movement could unfold in the near term. That said, the FVG presents a key area to watch for bullish continuation. If buyers step in at this imbalance zone, the index could resume its upward trajectory, reaffirming the strength of the current trend.
Disclosure: I am part of Trade Nation's Influencer program and receive a monthly fee for using their TradingView charts in my analysis.
Thanks for your support.
- Make sure to follow me so you don't miss out on the next analysis!
- Drop a like and leave a comment!

DXY: Strong Bullish Sentiment! Long!
My dear friends,
Today we will analyse DXY together☺️
The price is near a wide key level
and the pair is approaching a significant decision level of 96.899 Therefore, a strong bullish reaction here could determine the next move up.We will watch for a confirmation candle, and then target the next key level of 97.077.Recommend Stop-loss is beyond the current level.
❤️Sending you lots of Love and Hugs❤️

SILVER: Bulls Are Winning! Long!
My dear friends,
Today we will analyse SILVER together☺️
The recent price action suggests a shift in mid-term momentum. A break above the current local range around 36.463 will confirm the new direction upwards with the target being the next key level of 36.640 and a reconvened placement of a stop-loss beyond the range.
❤️Sending you lots of Love and Hugs❤️

EURUSD: Next Move Is Down! Short!
My dear friends,
Today we will analyse EURUSD together☺️
The in-trend continuation seems likely as the current long-term trend appears to be strong, and price is holding below a key level of 1.17021 So a bearish continuation seems plausible, targeting the next low. We should enter on confirmation, and place a stop-loss beyond the recent swing level.
❤️Sending you lots of Love and Hugs❤️

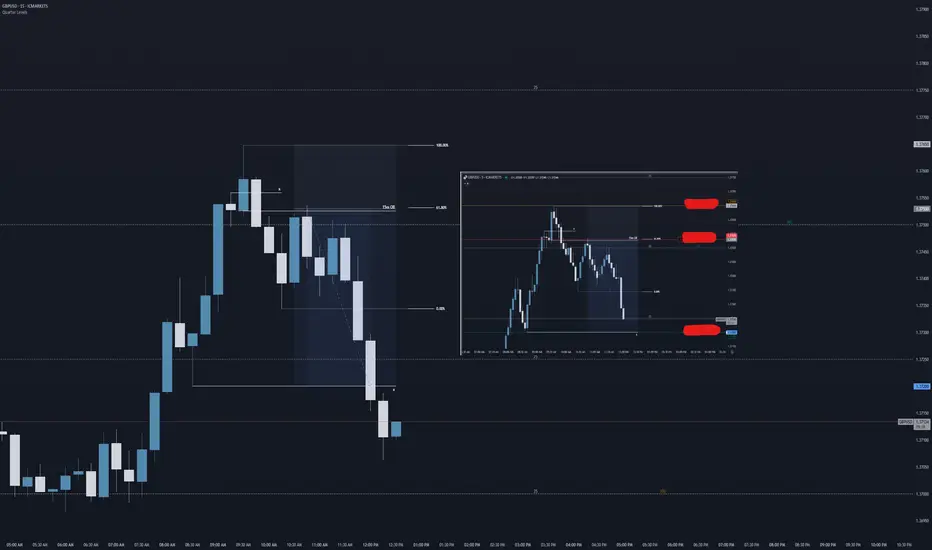
GU Sniper Trade ReviewTook this extremely precise trade this morning on GBP/USD off the 15 minute chart.
We're trading at price highs from 2022, due to all the current fundamentals (which needs to be a topic for another day).
But price showed some really good bearish confluences for a nice session based trade.
Entry was based on the below technical analysis logic:
- 15m order block
- 61.8% FIB retracement (golden ratio)
- 1.375 key price level ( the secret sauce ;) )
I set a conservative TP off a previous 5m structure low and SL was simply set at the current structure high.
This resulted in a 1:3RR trade setup.
Aman | SMC Wolf FX
p.s. i'm currently taking on students who are wanting to learn the way I trade with precision (check out my signature)
GOLD: Target Is Down! Short!
My dear friends,
Today we will analyse GOLD together☺️
The market is at an inflection zone and price has now reached an area around 3,342.22 where previous reversals or breakouts have occurred.And a price reaction that we are seeing on multiple timeframes here could signal the next move down so we can enter on confirmation, and target the next key level of 3,336.36..Stop-loss is recommended beyond the inflection zone.
❤️Sending you lots of Love and Hugs❤️

GBP_USD WILL KEEP GROWING|LONG|
✅GBP_USD broke the key structure level of 1.3620
While trading in an local uptrend
Which makes me bullish biased
And I think that after the retest of the broken level is complete
A rebound and bullish continuation will follow
LONG🚀
✅Like and subscribe to never miss a new idea!✅
Disclosure: I am part of Trade Nation's Influencer program and receive a monthly fee for using their TradingView charts in my analysis.

EUR_USD BULLISH BREAKOUT|LONG|
✅EUR_USD is going up
Now and the pair made a bullish
Breakout of the key horizontal
Level of 1.1630 and the breakout
Is confirmed so we are bullish
Biased and we will be expecting
A further bullish move up
LONG🚀
✅Like and subscribe to never miss a new idea!✅
Disclosure: I am part of Trade Nation's Influencer program and receive a monthly fee for using their TradingView charts in my analysis.

XAUUSD – Sniper Entry Plan June 26, 2025👋 Hello traders,
Gold is currently consolidating after recent downside liquidity sweeps, and Thursday brings high-impact USD catalysts. Let’s break it down and build a precise plan for sniper entries around these volatile zones. We’re trading structure, not noise — eyes on the prize. 🎯
🔸 HTF Outlook (D1 → H4 → H1)
🌐 Macro & Geopolitical Context
Markets are bracing for:
USD Unemployment Claims (Forecast: 244K, previous: 245K)
Final GDP q/q and Durable Goods Orders
Fed speakers (Barkin, Barr, Harker)
Stronger-than-expected data could reinforce USD bullish sentiment, sending gold down. Weaker reports + dovish Fed = bullish pressure on gold.
🗺️ Daily Bias: Neutral to Bullish
Price is ranging above a key CHoCH low + Daily OB (3272–3288)
Strong bullish continuation only confirmed with a break above 3370–3384
FIBO: 50% retracement of the last swing is near 3310, giving structure to Buy Zone 1
Bias: Bullish as long as 3272 holds — PA supports HL structure above imbalance
🕓 H4 Bias: Bearish Pullback
CHoCH at 3384 → clean Lower High + price failed to close above premium FVG
Pullback testing EMA 50/100 + FVG at 3345
FIBO extension zone at 161.8% aligns near 3288 = reactive downside target
Bias: Reactive bearish under 3352. If 3370 breaks cleanly → short invalid.
🕐 H1 Bias: Bullish Short-Term
CHoCH → HL printed at 3310 → higher lows forming toward supply
EMA 21/50 crossed to the upside, RSI mid-range (50–60)
PA structure showing ascending triangle under resistance
Bias: Bullish continuation valid toward 3352–3370, unless breakdown under 3308
🔸 LTF Precision (M30 → M15)
🔹 Sell Zone 1 – 3352–3345
H1 OB + M15 FVG + upper range sweep
RSI expected to peak near 70 → potential divergence
FIBO: 78.6% retracement of previous bearish leg
PA: Watch for M15 liquidity sweep + bearish engulfing
🔸 Entry: Wait for break/retest → confirmation on M5–M15 BOS
🔹 Sell Zone 2 – 3370–3384
HTF premium imbalance zone + weak high above
RSI likely in exhaustion zone
FIBO extension 1.272–1.618 completes inside this supply
PA: Only enter after stop hunt wick + clear CHoCH (M5)
🔸 Entry: Reactive fade after liquidity trap
🔸 Buy Zone 1 – 3308–3313
H1 CHoCH + OB + EQ zone
RSI bounce zone (30–40)
FIBO 50–61.8% retracement of bullish swing
PA: Watch for M15 bullish engulfing or double bottom formation
🔸 Entry: Only on structure break + retest confirmation
🔸 Buy Zone 2 – 3288–3272
Daily OB + HTF FVG + massive imbalance
RSI expected to overshoot under 30
FIBO: 1.618 extension from previous M15 bullish leg
PA: High-RR reversal zone if flushed by NY open
🔸 Entry: Enter only after M5 CHoCH or strong engulfing near the OB
⚖️ Decision Zone – 3333–3336
Previous supply turned EQ zone
PA shows indecision — do not enter here
Useful for monitoring if price holds support or rejects
🔸 Trade Scenarios
🟢 Bullish Scenario
If USD data is weak:
Flush to 3308 or 3288
Confirm HL formation → sniper buy from OB → aim 3345+, possibly 3370 sweep
🔴 Bearish Scenario
If USD prints strong:
Price spikes into 3352 or 3370 zones → rejection + BOS
Sniper short entry → targets 3310 → 3288
🔸 Final Plan & Action Points
✅ Patience is key during news. Let structure confirm.
✅ Track price behavior near 14:30 CEST, avoid instant spikes.
✅ Best sniper RR zones:
🔹 Sell from 3352 or 3370
🔸 Buy from 3308 or 3288
📊 Precision matters. Structure wins.
👍 Like this if it helped you map the move, and 🔔 follow for tomorrow’s sniper entry.
— GoldFxMinds
Disclosure: I am part of TradeNation's Influencer program and receive a monthly fee for using their TradingView charts in my analyses and educational articles.

AUD-NZD Long From Rising Support! Buy!
Hello,Traders!
AUD-NZD went down but
Will soon retest a rising
Support line from where
We will be expecting a
Bullish rebound and a move up
Buy!
Comment and subscribe to help us grow!
Check out other forecasts below too!
Disclosure: I am part of Trade Nation's Influencer program and receive a monthly fee for using their TradingView charts in my analysis.

AUD_JPY LOCAL SHORT|
✅AUD_JPY made a retest of the
Strong horizontal resistance level of 94.800
And as you can see the pair is already
Making a local pullback from
The level which sends a clear
Bearish signal to us therefore
We will be expecting a
Further bearish correction
SHORT🔥
✅Like and subscribe to never miss a new idea!✅
Disclosure: I am part of Trade Nation's Influencer program and receive a monthly fee for using their TradingView charts in my analysis.

EUR-CAD Bullish Breakout! Buy!
Hello,Traders!
EUR-CAD is trading in an
Uptrend and the pair made
A bullish breakout of the key
Horizontal level of 1.5936 so we
Are bullish biased and we
Will be expecting a further
Bullish move up
Buy!
Comment and subscribe to help us grow!
Check out other forecasts below too!
Disclosure: I am part of Trade Nation's Influencer program and receive a monthly fee for using their TradingView charts in my analysis.

EURUSD - Bears Preparing a Bearish Shift in StructureEURUSD has been pushing higher over the past few sessions, reaching into a key liquidity zone. On the 4H chart, we’ve now seen a very clean sweep of previous swing highs, which completes the first step needed for a potential reversal. This sweep acted as a buy-side liquidity run, taking out resting orders before showing early signs of exhaustion.
Liquidity Sweep and Structural Confirmation
The sweep of the highs marked a potential turning point, but for this setup to gain validity, we need to see confirmation through structure. That confirmation would come from a decisive 4H close below the red mitigation zone. This area aligns with a small demand that previously pushed price up, so a close below would mark a clean break in bullish order flow and confirm a bearish structure shift.
Downside Expectations and Key Levels
If the structure shift is confirmed, I expect EURUSD to move lower toward the fair value gap around 1.14600 to 1.14400. This FVG could provide temporary support, and we may see some reaction there. However, due to the size of the imbalance and the overall context, price has the potential to continue lower through that level.
Interim Reactions and Minor Scenarios
There is a chance price reacts to the FVG and pulls back before continuing lower. Any bounce from this zone would likely be short-term unless it leads to a clear market structure shift back to the upside. If price fails to hold above the FVG, the deeper support zone below near 1.13800 would become the next logical target.
Trigger Point for Bearish Bias
The most important trigger for this trade is a 4H close below the red box. Without that, the bullish structure technically remains intact. Once that level is broken, I will consider the sweep and break combination a completed reversal signal, targeting the FVG and beyond.
Conclusion
This setup follows a textbook liquidity grab followed by a potential structure break. Patience is key here, as I’m waiting for confirmation before taking action. If price closes below the red zone, I’ll be actively looking for shorts targeting the 1.14600 region, with room to extend lower depending on how price reacts at the FVG.
Disclosure: I am part of Trade Nation's Influencer program and receive a monthly fee for using their TradingView charts in my analysis.
___________________________________
Thanks for your support!
If you found this idea helpful or learned something new, drop a like 👍 and leave a comment, I’d love to hear your thoughts! 🚀

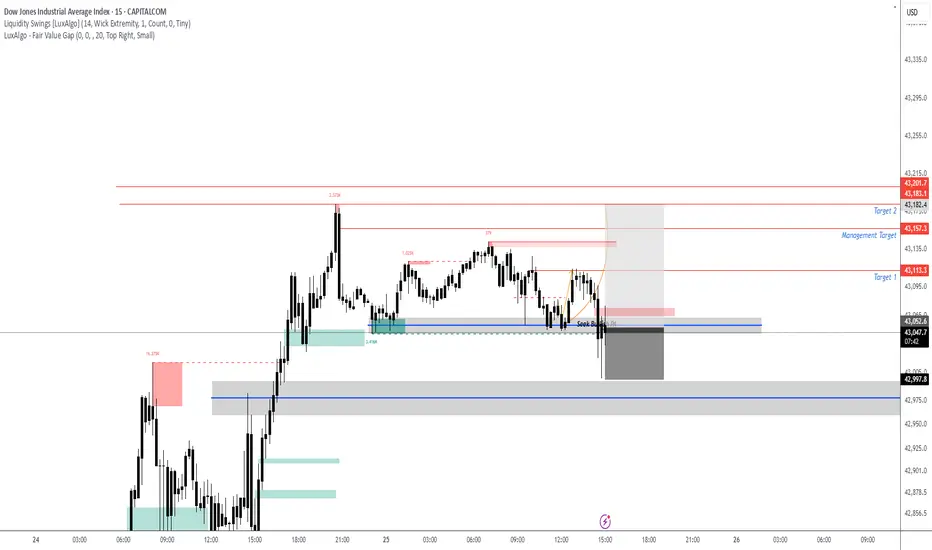
US30 - Entries ActiveAs anticipated got the sweep below then break above our area with a U shape formation. Looking to the upside.
DAX: Move Down Expected! Short!
My dear friends,
Today we will analyse DAX together☺️
The price is near a wide key level
and the pair is approaching a significant decision level of 23,509.95 Therefore, a strong bearish reaction here could determine the next move down.We will watch for a confirmation candle, and then target the next key level of 23,438.51..Recommend Stop-loss is beyond the current level.
❤️Sending you lots of Love and Hugs❤️

GOLD: Local Bullish Bias! Long!
My dear friends,
Today we will analyse GOLD together☺️
The recent price action suggests a shift in mid-term momentum. A break above the current local range around 3,314.13 will confirm the new direction upwards with the target being the next key level of 3,322.84 and a reconvened placement of a stop-loss beyond the range.
❤️Sending you lots of Love and Hugs❤️

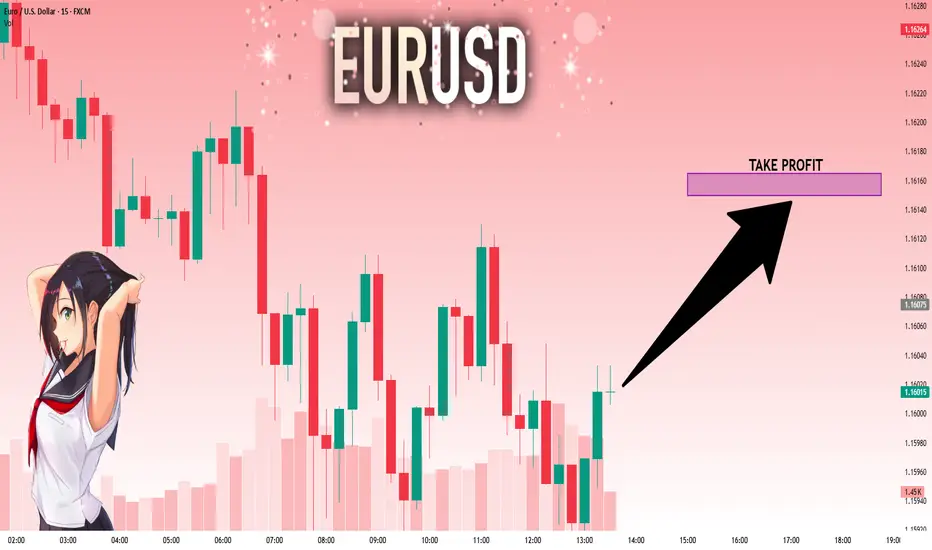
EURUSD: Strong Growth Ahead! Long!
My dear friends,
Today we will analyse EURUSD together☺️
The in-trend continuation seems likely as the current long-term trend appears to be strong, and price is holding above a key level of 1.16017 So a bullish continuation seems plausible, targeting the next high. We should enter on confirmation, and place a stop-loss beyond the recent swing level.
❤️Sending you lots of Love and Hugs❤️
SILVER: Will Go Down! Short!
My dear friends,
Today we will analyse SILVER together☺️
The market is at an inflection zone and price has now reached an area around 35.768 where previous reversals or breakouts have occurred.And a price reaction that we are seeing on multiple timeframes here could signal the next move down so we can enter on confirmation, and target the next key level of 35.645..Stop-loss is recommended beyond the inflection zone.
❤️Sending you lots of Love and Hugs❤️

US30 - Final Push before PullbackPotentially another push to upper levels of supply potentially 43,150-43,200. Can see this retest before seeing a potential pull back based off larger time frame.

EURUSD - Looking to the upside retest of SupplyLooking to the upside, first lets get that push to lower level of liquidity swing then a push to the upside. Only on bullish confirmation at our highlighted level. I think we have one more retest before catching a potential short (pullback) on the larger time frame. Long term target for EURUSD is 1.200.
