AUD_USD LONG FROM RISING SUPPORT|
✅AUD_USD is trading along
The rising support line
And as the pair will soon retest it
I am expecting the price to go up
To retest the supply levels above 0.6460
LONG🚀
✅Like and subscribe to never miss a new idea!✅
Disclosure: I am part of Trade Nation's Influencer program and receive a monthly fee for using their TradingView charts in my analysis.
SMC

EUR/USD - Is the uptrend about to end?The EUR/USD currency pair has demonstrated a consistent uptrend on the 4-hour chart for approximately two weeks. This sustained bullish momentum has captured the attention of traders and analysts alike, who are now questioning whether the pair can maintain its upward trajectory or if a retracement is imminent as it approaches significant resistance levels.
Rising wedge
A closer examination of the price action reveals that EUR/USD has been advancing within a rising wedge formation. This technical pattern is generally considered bearish, as it often precedes a reversal or a breakdown rather than a continued rally. Rising wedges are characterized by converging trendlines, with price making higher highs and higher lows at a diminishing rate, which typically signals waning bullish momentum and a potential for sellers to regain control.
Strong resistance
Recently, the pair encountered a notable resistance zone around the 1.141 level. Upon reaching this area, EUR/USD faced a rejection, resulting in a pullback from its recent highs. While there is a possibility that the pair could make another attempt to test this resistance, the initial rejection suggests that the upward move may be losing steam. As a result, the likelihood of a retracement has increased, especially given the bearish implications of the rising wedge pattern.
Support/target zone
If the pair does indeed correct lower, a logical target for a cooldown would be the green support zone near 1.127. This level has previously acted as a strong support area, and it could serve as a foundation for buyers to step in once more, potentially setting the stage for another move higher. Until the resistance at 1.141 is decisively broken, caution is warranted, and a period of consolidation or a pullback towards support appears increasingly probable.
Thanks for your support.
- Make sure to follow me so you don't miss out on the next analysis!
- Drop a like and leave a comment!

EURUSD: Strong Bearish Sentiment! Short!
My dear friends,
Today we will analyse EURUSD together☺️
The recent price action suggests a shift in mid-term momentum. A break below the current local range around 1.13300 will confirm the new direction downwards with the target being the next key level of 1.13052 and a reconvened placement of a stop-loss beyond the range.
❤️Sending you lots of Love and Hugs❤️

GOLD: Bulls Are Winning! Long!
My dear friends,
Today we will analyse GOLD together☺️
The in-trend continuation seems likely as the current long-term trend appears to be strong, and price is holding above a key level of 3,292.52 So a bullish continuation seems plausible, targeting the next high. We should enter on confirmation, and place a stop-loss beyond the recent swing level.
❤️Sending you lots of Love and Hugs❤️

Bitcoin – Possible 4h Sweep at 106.5kBitcoin recently printed a sharp rejection after revisiting a key supply area formed by a 4H fair value gap, overlapping perfectly with the golden pocket zone from the most recent down move. This confluence provided a strong technical ceiling, causing a clear reaction and shifting short-term sentiment to the downside. The rejection was sharp and clean, leaving behind an upper wick that signals strong selling interest. From here, price appears to be in search of support, and our eyes are now locked on the 4H imbalance around the 108.2k level, which could serve as a key pivot for the next directional move.
Consolidation and Confluence Structure
This recent move isn’t just a random drop. We’ve built a range around this resistance zone, with multiple failed attempts to break higher, followed by a clear rejection from inside the 4H FVG and golden pocket. This kind of structure usually tells us two things: first, buyers are struggling to break through strong institutional resistance, and second, there’s still liquidity left below that the market may want to sweep before any continuation higher. This is where the FVG at 108.2k and the PDL around 106.5k come into play. Both zones are clean, visible, and highly likely to draw price if the current level doesn’t hold.
Fair Value Gap Reaction Potential
The 108.2k zone is where the first major reaction could occur. It marks a fresh 4H imbalance created during the impulsive move upward, and price is now backfilling that inefficiency. If buyers step in here, respecting this imbalance as a demand zone, we could easily see a rotation back up toward 110.2k and eventually a retest of the upper resistance band near 111k. This would be a typical FVG play: price rebalances into the gap, finds demand, and continues higher.
Failure Scenario and Liquidity Sweep Setup
If the 108.2k FVG fails to hold as support, the next target becomes much more obvious, the previous day’s low at 106.5k. That level is also a 4H swing low, making it a prime liquidity draw. A move below that low would allow price to collect sell-side liquidity, sweep out late longs, and potentially trap breakout traders expecting further downside. If this level is swept cleanly and followed by bullish displacement, it could offer a high-probability long entry from the discount zone. The risk-reward from this setup would be ideal, especially if we reclaim 108.2k afterward.
Market Context and Higher Timeframe Bias
Zooming out, the structure remains bullish on higher timeframes, but this local rejection is a necessary reset. It’s a shakeout that allows price to reprice into demand and generate momentum for the next leg up. This kind of behavior is typical in trending markets, corrective moves that dig into inefficiencies, hunt liquidity, and then reestablish the trend. As long as we don’t see sustained closes below 106k, the bias remains tilted toward continuation to the upside, with current price action offering a potential entry opportunity.
Price Target and Expectations
If we hold the 108.2k zone, my first short-term target is the 110.2k structure high, followed by the upper resistance area around 111k where the initial rejection occurred. A reclaim of that zone opens the door to expansion toward 112k. If instead we sweep the PDL and bounce from 106.5k, the first target would be a retrace into the 108.2k imbalance, with the next leg aiming for the same resistance range. Either path sets up a long opportunity from areas of value.
Conclusion
Bitcoin is at an important decision point. The rejection from the 4H FVG and golden pocket confirms strong resistance, and price is now seeking support lower. The 108.2k FVG is a critical zone, a hold here gives us a clean continuation setup, while a failure could lead to a deeper liquidity sweep toward 106.5k. Either scenario offers high-quality trade potential as long as we stay disciplined and wait for confirmation from price action. Patience is key, but both levels present opportunities to position long from areas where smart money typically steps in.
___________________________________
Thanks for your support!
If you found this idea helpful or learned something new, drop a like 👍 and leave a comment, I’d love to hear your thoughts! 🚀

US30: Next Move Is Up! Long!
My dear friends,
Today we will analyse US30 together☺️
The market is at an inflection zone and price has now reached an area around 42,126.0 where previous reversals or breakouts have occurred.And a price reaction that we are seeing on multiple timeframes here could signal the next move up so we can enter on confirmation, and target the next key level of 42,199.7.Stop-loss is recommended beyond the inflection zone.
❤️Sending you lots of Love and Hugs❤️

SILVER: Target Is Down! Short!
My dear friends,
Today we will analyse SILVER together☺️
The price is near a wide key level
and the pair is approaching a significant decision level of 33.092 Therefore, a strong bearish reaction here could determine the next move down.We will watch for a confirmation candle, and then target the next key level of 32.856.Recommend Stop-loss is beyond the current level.
❤️Sending you lots of Love and Hugs❤️

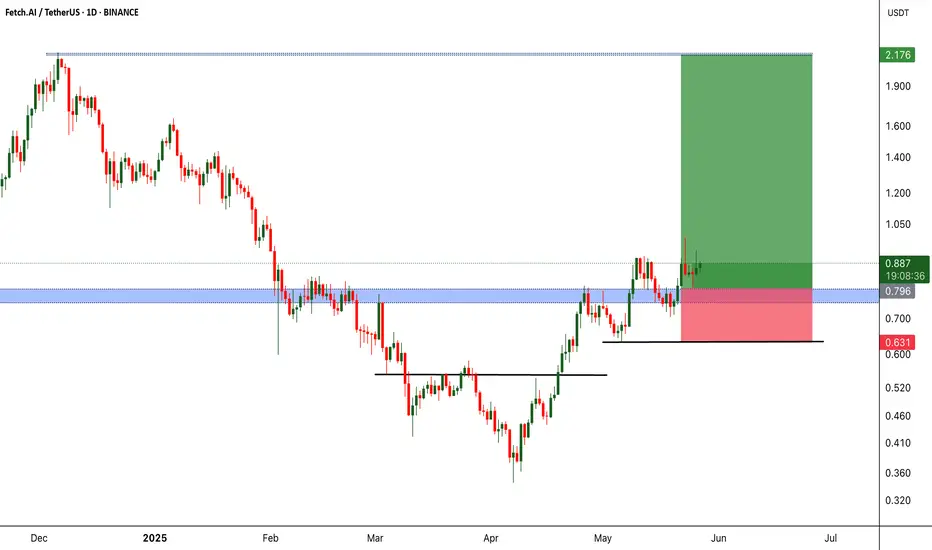
FETUSDT Major Resistance Cracked, Eyes on Sky!BINANCE:FETUSDT has recently broken out from a significant resistance level that previously acted as a strong barrier. After this breakout, the price action displayed a textbook retest of the former resistance—now turned support which held firm, confirming the bullish move.
This successful retracement signals strength in the current uptrend and opens the door for potential continuation towards higher highs. The market structure is showing signs of higher lows and increasing momentum, which could fuel a strong rally in the near term.
While the setup looks promising, it’s essential to emphasize risk management. Always use a stop-loss to protect your capital and manage your position sizing according to your trading plan. The crypto market can be volatile, and smart risk control separates long-term winners from short-term chasers.
All eyes are now on NYSE:FET for its next move. If momentum continues, we could witness a significant upward leg. Stay sharp and let the trend be your guide!
BINANCE:FETUSDT Currently trading at $0.88
Buy level : Above $0.8
Stop loss : Below $0.63
Target 1: $1.1
Target 2: $1.4
Target 3: $2.1
Max leverage 3x
Always keep stop loss
Follow Our Tradingview Account for More Technical Analysis Updates, | Like, Share and Comment Your thoughts
GBP-JPY Resistance Cluster! Sell!
Hello,Traders!
GBP-JPY made a retest
Of the resistance cluster
Of the rising and horizontal
Resistance lines around 193.989
And we are already seeing a
Bearish reaction so we will be
Expecting a further bearish
Move down
Sell!
Comment and subscribe to help us grow!
Check out other forecasts below too!
Disclosure: I am part of Trade Nation's Influencer program and receive a monthly fee for using their TradingView charts in my analysis.

AUD_NZD SUPPORT AHEAD|LONG|
✅AUD_NZD is going down now
But a strong support level is ahead at 1.0780
Thus I am expecting a rebound
And a move up towards the target at 1.0827
LONG🚀
✅Like and subscribe to never miss a new idea!✅
Disclosure: I am part of Trade Nation's Influencer program and receive a monthly fee for using their TradingView charts in my analysis.

EUR-USD Local Long! Buy!
Hello,Traders!
EUR-USD made a retest
Of the key horizontal
Support level of 1.1369
And we are already seeing
A bullish rebound so we will
Be expecting a further
Bullish move up
Buy!
Comment and subscribe to help us grow!
Check out other forecasts below too!
Disclosure: I am part of Trade Nation's Influencer program and receive a monthly fee for using their TradingView charts in my analysis.

DXY: Move Down Expected! Short!
My dear friends,
Today we will analyse DXY together☺️
The recent price action suggests a shift in mid-term momentum. A break below the current local range around 98.579 will confirm the new direction downwards with the target being the next key level of 98.459 and a reconvened placement of a stop-loss beyond the range.
❤️Sending you lots of Love and Hugs❤️

GOLD: Local Bearish Bias! Short!
My dear friends,
Today we will analyse GOLD together☺️
The in-trend continuation seems likely as the current long-term trend appears to be strong, and price is holding below a key level of 3,339.22 So a bearish continuation seems plausible, targeting the next low. We should enter on confirmation, and place a stop-loss beyond the recent swing level.
❤️Sending you lots of Love and Hugs❤️

SILVER: Strong Growth Ahead! Long!
My dear friends,
Today we will analyse SILVER together☺️
The market is at an inflection zone and price has now reached an area around 33.383 where previous reversals or breakouts have occurred.And a price reaction that we are seeing on multiple timeframes here could signal the next move up so we can enter on confirmation, and target the next key level of 33.469.Stop-loss is recommended beyond the inflection zone.
❤️Sending you lots of Love and Hugs❤️

EURUSD: Will Go Up! Long!
My dear friends,
Today we will analyse EURUSD together☺️
The price is near a wide key level
and the pair is approaching a significant decision level of 1.13787 Therefore, a strong bullish reaction here could determine the next move up.We will watch for a confirmation candle, and then target the next key level of 1.13975.Recommend Stop-loss is beyond the current level.
❤️Sending you lots of Love and Hugs❤️

CRYPTO TRADING: ATOM CAN GIVE 50-100% RETURN FROM HEREATOM can give us a good 100% return from here, risking only 18% of the invested amount.
Reason?
Weekly structure has turned bullish.
Daily is super bullish.
My stop loss is below the recent swing low on weekly time frame.

EURUSD - SHORT PREDICTION - MONDAY, 26TH MAY 2025A pullback appears to be underway, following a sweep of inducement around the 15-minute level at 1.13900—marking our first significant Change of Character (CHoCH). This shift aligns with the broader narrative from the 1-hour timeframe, suggesting the potential for a deeper retracement into the extreme 1H order block.
With the current price trading around 1.13777, we anticipate a move back up to the 1.14078 level. This area is of interest for initiating short positions, in line with the ongoing correction.
Our first take-profit target is set at 1.13368, where we expect an initial reaction. Should bearish momentum continue, we foresee price extending lower to sweep the previous daily low at 1.12771 and potentially tapping into the daily external order block at 1.12664.
From there, we’ll closely monitor price behavior. If bullish intent begins to form, we’ll assess the potential for long setups targeting a move back toward the weekly high at 1.14190.

VIEW: EURUSD-Cut your losses short and let your winners run.
-The market is a device for transferring money from the impatient to the patient.
-In investing, what is comfortable is rarely profitable.
-Trade what you see, not what you think.
CONFIRMATION
-Price is bullish
-Strong order block
-BOS
-Liquidity sweep
-FVG filled
-Price retraced
NB: Do not ever compare yourself to other traders. Take regular breaks from trading Maintain a trading journal Love your craft Learn from other successful traders.

SP500 Ready to Continue it's Bullish MoveI just bought SP500 for it's bullish move continuation.
Monthly structure is bullish.
Weekly is bullish.
Daily is also bullish.
I entered for a long buy on the daily time frame retracement.

GOLD → Descending Channel and Triangle Appear on H4 Gold Technical Analysis
EMA 200
Last Thursday, gold broke below the 200 EMA, signaling a potential trend reversal to bearish, followed by a rejection at 3,128.00 — an H4 order block area. However, on Tuesday, price action pushed back above the 200 EMA and held, indicating a return to bullish momentum.
Chart Pattern
Price movement is currently constrained by several trendlines, forming a descending channel and triangle pattern, creating a sideways market structure.
Order Block Mapping
A new H4 order block has formed, representing a key area to look for potential buy entries. If this zone is broken, it may offer a strong opportunity for a sell entry.
🟢 Bullish Scenario
If gold reaches the 3,318.00 level — an H4 order block area — it may present a potential buying opportunity. A breakout above the upper trendline would confirm bullish continuation, with the first target at 3,366.00 (TP1), followed by a second target at 3,440.00 (TP2), which is also an H4 order block area.
🔴 Bearish Scenario
If gold breaks below the H4 order block at 3,290.00 and breaches the lower trendline, it may offer a selling opportunity, with the next downside target at 3,055.00 — a key daily order block level.
Best Regard

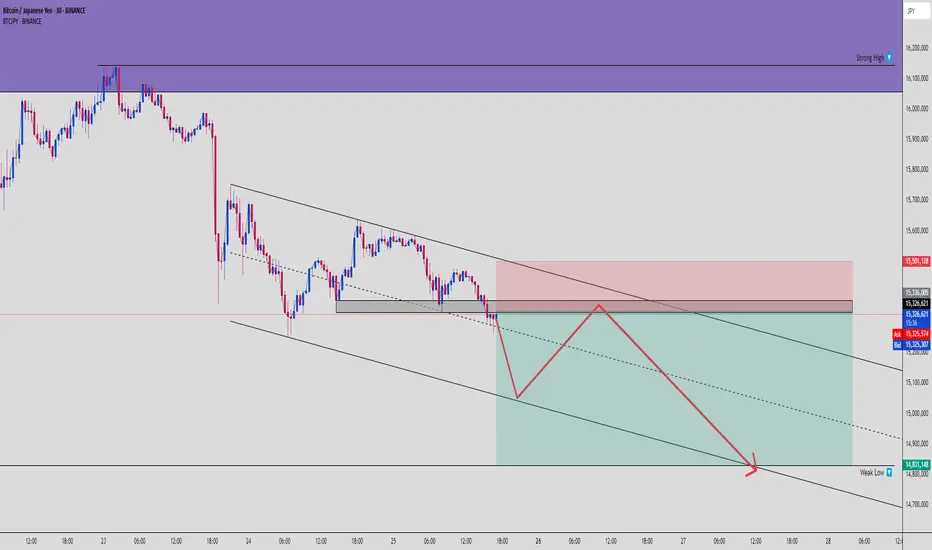
BTCJPY Bearish Channel Setup – OB Rejection to Weak Low Sweep🧠 Bitcoin vs Yen (BTCJPY) | 30M Smart Money Breakdown
BTCJPY is painting the same story we’ve seen before: liquidity builds → OB rejection → channel continuation → weak low sweep. This is how the markets bleed slow then drop fast. Let’s break it down.
🧱 1. Bearish Channel Structure
We’re inside a clear descending channel, where price:
Forms consistent lower highs (supply zones)
Prints lower lows (liquidity grabs)
Shows rejections at channel tops = perfect confluence
This structure supports a continuation downward move.
🧊 2. Order Block + Supply Rejection
Price recently tapped into a clean Bearish Order Block (OB) within the premium zone just under 15.5M.
OB was respected with a sharp reaction
Immediate sell pressure confirms Smart Money entry
Red zone = OB + supply + channel midline
No candle closes above OB = bias confirmed bearish.
🧲 3. Smart Money Flow vs Retail
Retail likely went long on the mini bounce.
Smart Money waited for:
Price to tap into the OB
Retail to stack longs
Opportunity to fill imbalance and dump
This gives us an ideal Sell-to-Buy-to-Sell structure forming.
🕯️ 4. Projected Move: Weak Low Sweep
🧨 Target = 14,831,148
Why?
That’s a marked Weak Low
It aligns with channel support
It’s a known liquidity magnet
Expect acceleration into this zone.
⚔️ 5. Trade Plan (Short Setup)
📍 Entry Zone: 15.315M – 15.33M
🔐 Stop Loss: Above OB → ~15.50M
🎯 Targets:
TP1: 15.200M
TP2: 15.000M
TP3: 14.831M
⚖️ RRR: ~1:4+ depending on execution precision
🧠 Summary:
This chart screams:
“Trap the liquidity, respect the OB, ride the channel.”
These setups repeat. Same pattern, different chart, every week.
📣 Engage Call:
💬 Comment “BTCJPY SHORT SNIPER” if you caught this one
👥 Tag your trading partner – don’t let them miss this play
🔄 Save this chart to study the OB entry mechanics
GOLD Local Short! Sell!
Hello,Traders!
GOLD made a retest a
Horizontal resistance
Of 3,366$ and we are
Already seeing a local
Bearish reaction so a
Further local pullback
Is expected with the
Target being 3,337$ level
Sell!
Comment and subscribe to help us grow!
Check out other forecasts below too!
Disclosure: I am part of Trade Nation's Influencer program and receive a monthly fee for using their TradingView charts in my analysis.

EUR_CAD RISKY LONG|
✅EUR_CAD is going down to retest
A horizontal support of 1.5570
Which makes me locally bullish biased
And I think that we will see a rebound
And a move up from the level
Towards the target above at 1.5630
LONG🚀
✅Like and subscribe to never miss a new idea!✅
Disclosure: I am part of Trade Nation's Influencer program and receive a monthly fee for using their TradingView charts in my analysis.
