GBP-USD Massive Swing Breakout! Buy!
Hello,Traders!
GBP-USD is trading in a
Strong uptrend and the
Pair made a massive
Bullish breakout of the
Key horizontal level
Of 1.3444 and went
Further up which reinforces
Our bullish bias and after
A potential pullback we
Will be expecting a
Further bullish move up
Next week
Buy!
Comment and subscribe to help us grow!
Check out other forecasts below too!
Disclosure: I am part of Trade Nation's Influencer program and receive a monthly fee for using their TradingView charts in my analysis.
SMC

US30: Move Up Expected! Long!
My dear friends,
Today we will analyse US30 together☺️
The in-trend continuation seems likely as the current long-term trend appears to be strong, and price is holding above a key level of 41,589.0 So a bullish continuation seems plausible, targeting the next high. We should enter on confirmation, and place a stop-loss beyond the recent swing level.
❤️Sending you lots of Love and Hugs❤️

SILVER: Local Bearish Bias! Short!
My dear friends,
Today we will analyse SILVER together☺️
The market is at an inflection zone and price has now reached an area around 33.327 where previous reversals or breakouts have occurred.And a price reaction that we are seeing on multiple timeframes here could signal the next move down so we can enter on confirmation, and target the next key level of 33.210.Stop-loss is recommended beyond the inflection zone.
❤️Sending you lots of Love and Hugs❤️

EURUSD: Strong Growth Ahead! Long!
My dear friends,
Today we will analyse EURUSD together☺️
The price is near a wide key level
and the pair is approaching a significant decision level of 1.13480 Therefore, a strong bullish reaction here could determine the next move up.We will watch for a confirmation candle, and then target the next key level of 1.13726.Recommend Stop-loss is beyond the current level.
❤️Sending you lots of Love and Hugs❤️

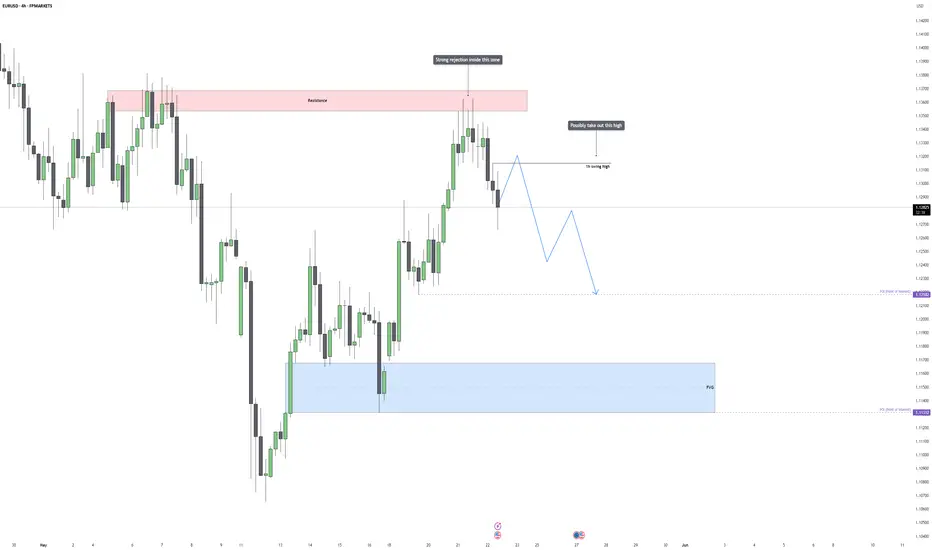
EURUSD – Bearish Outlook After Inducement and RejectionEURUSD recently delivered a sharp rejection from the 1.13700 resistance zone, a level that previously acted as a strong barrier for price. This area had already shown signs of supply in the past, and the latest reaction only strengthens the case for continued bearish interest at that level. The rejection candle was large, clean, and decisive, showing that sellers aggressively stepped in after price entered the premium zone. This shift now places focus on how price navigates lower timeframes in the short term, especially as we approach key liquidity levels and structural points of interest.
Sweep Setup and Liquidity Outlook
Despite the rejection, one notable feature left behind is a 1H swing high just under 1.13400. This high remains untapped and likely holds buy-side liquidity from breakout traders. It’s common to see price sweep such local highs before turning lower, especially after a clear rejection from a major zone like the one above. This potential inducement move, where price runs the high to gather liquidity and trap late buyers, is what I’ll be watching closely next.
The scenario I’m anticipating is a relatively short-lived push higher, just enough to clear the swing high liquidity before price shifts bearish again. This behavior fits within the broader bearish structure and could serve as the final fuel needed before a deeper move to the downside unfolds.
Key Levels and Technical Context
The first point of interest comes in at the 1.12182 level, which is marked on the chart. This level is not rando, it aligns with previous structure, sits near a micro-breaker, and is positioned just above a fair value gap. If we do get the anticipated sweep of the 1H high, this 1.12182 area becomes a highly sensitive zone where the next key reaction could occur.
What makes this POI important is that it serves as a decision point for the market. If the sweep occurs and price aggressively sells off into this level, we can start watching for continuation setups. But if price stalls or consolidates here, we’ll need to evaluate whether the bearish momentum is still intact or if a shift is occurring.
If bearish pressure continues, the next downside target is the POI around 1.11300. This level is nested cleanly inside a higher-timeframe fair value gap, and it also overlaps with a prior demand zone. From a liquidity standpoint, it’s the logical draw, resting sell-side liquidity is likely building beneath those May lows, and the market could easily target that zone once 1.12182 is breached.
Momentum, Structure, and Execution Plan
The current structure is bearish, but short-term strength is still on the table until the sweep of the 1H high plays out. I’m not interested in selling into strength just yet, I’d prefer to see the inducement leg complete, followed by signs of weakness such as bearish engulfing structures, lower timeframe market structure breaks, or clean fair value gap entries forming after the sweep.
Once price breaks below 1.12182 decisively, it opens the path toward the next liquidity pocket at 1.11300. Any signs of continuation post-rejection from that first POI would be used to look for scalable short entries with tight risk and larger reward-to-risk ratios.
Conclusion
EURUSD is setting up for a clean liquidity run above the 1H high, following a strong rejection from higher timeframe resistance. The plan is to let price run that liquidity, then look for bearish signs to engage short down toward 1.12182. If that level fails to hold and bearish pressure continues, the 1.11300 POI becomes the next logical target. The structure is lining up well for this sequence, but execution will depend on how price behaves around the key inducement and reaction zones.
___________________________________
Thanks for your support!
If you found this idea helpful or learned something new, drop a like 👍 and leave a comment, I’d love to hear your thoughts! 🚀
GOLD: Will Go Down! Short!
My dear friends,
Today we will analyse GOLD together☺️
The recent price action suggests a shift in mid-term momentum. A break below the current local range around 3,355.96 will confirm the new direction downwards with the target being the next key level of 3,323.73 and a reconvened placement of a stop-loss beyond the range.
❤️Sending you lots of Love and Hugs❤️

NZD_CAD LONG SIGNAL|
✅NZD_CAD is going down to
Retest a horizontal support of 0.8160
Which makes me locally bullish biased
And I think that we will see a rebound
And a move up from the level
So we can go long wit the
TP of 0.8206 and the SL of 0.8152
LONG🚀
✅Like and subscribe to never miss a new idea!✅
Disclosure: I am part of Trade Nation's Influencer program and receive a monthly fee for using their TradingView charts in my analysis.

SPY Will Keep Growing! Buy!
Hello,Traders!
SPY is trading in an uptrend
And the index made a retest
Of the key horizontal level
Of 579$ from where we are
Already seeing a bullish
Rebound so as we are
Bullish biased we will be
Expecting a further
Bullish move up
Buy!
Comment and subscribe to help us grow!
Check out other forecasts below too!
Disclosure: I am part of Trade Nation's Influencer program and receive a monthly fee for using their TradingView charts in my analysis.

USD_CHF CORRECTION AHEAD|SHORT|
✅USD_CHF is going up now
But a strong resistance level is ahead at 0.8328
Thus I am expecting a pullback
And a move down towards the target of 0.8260
SHORT🔥
✅Like and subscribe to never miss a new idea!✅
Disclosure: I am part of Trade Nation's Influencer program and receive a monthly fee for using their TradingView charts in my analysis.

DXY Local Short! Sell!
Hello,Traders!
DXY is making a bullish
Rebound but a horizontal
Resistance is ahead at 100.300
Level so after the retest a
Local bearish correction
Is to be expected
Sell!
Comment and subscribe to help us grow!
Check out other forecasts below too!
Disclosure: I am part of Trade Nation's Influencer program and receive a monthly fee for using their TradingView charts in my analysis.

DXY: The Market Is Looking Down! Short!
My dear friends,
Today we will analyse DXY together☺️
The in-trend continuation seems likely as the current long-term trend appears to be strong, and price is holding below a key level of 99.468 So a bearish continuation seems plausible, targeting the next low. We should enter on confirmation, and place a stop-loss beyond the recent swing level.
❤️Sending you lots of Love and Hugs❤️

GOLD: Strong Growth Ahead! Long!
My dear friends,
Today we will analyse GOLD together☺️
The price is near a wide key level
and the pair is approaching a significant decision level of 3,294.52 Therefore, a strong bearish reaction here could determine the next move down.We will watch for a confirmation candle, and then target the next key level of 3,314.94.Recommend Stop-loss is beyond the current level.
❤️Sending you lots of Love and Hugs❤️

EURUSD: Will Go Down! Short!
My dear friends,
Today we will analyse EURUSD together☺️
The in-trend continuation seems likely as the current long-term trend appears to be strong, and price is holding below a key level of 1.12922 So a bearish continuation seems plausible, targeting the next low. We should enter on confirmation, and place a stop-loss beyond the recent swing level.
❤️Sending you lots of Love and Hugs❤️

SILVER: The Market Is Looking Up! Long!
My dear friends,
Today we will analyse SILVER together☺️
The market is at an inflection zone and price has now reached an area around 32.882 where previous reversals or breakouts have occurred.And a price reaction that we are seeing on multiple timeframes here could signal the next move up so we can enter on confirmation, and target the next key level of 33.317.Stop-loss is recommended beyond the inflection zone.
❤️Sending you lots of Love and Hugs❤️

NZDUSD Bearish Setup🔍 Market Structure Analysis
WSD Zone Rejection (Top):
Price tapped a wick-based supply & demand (WSD) zone at the top around 0.59486.
That zone also aligns with the previous liquidity grab + mitigation of the OB.
Price is now rejecting that area — forming a lower high (LH) inside the zone → classic sign of distribution.
Rising Channel Break:
Price was rising inside the red ascending channel.
Currently showing bearish intent, with multiple internal BOS (breaks of structure).
If price closes below the channel, that confirms bearish expansion.
Downtrend from Premium Zone:
We're clearly in premium pricing, where institutions prefer to offload longs.
This area also completes a liquidity sweep of prior highs inside the WSD zone.
🧠 Trade Logic (Sell Setup)
🔺 Entry Zone: Inside or after rejection of WSD at 0.59486.
🛑 Stop Loss: Just above the WSD zone and local high.
🎯 Take Profits:
TP1: 0.58669 → Local support + lower WSD zone (reaction zone).
TP2: 0.58398 → Previous liquidity pool and external low.
🧾 R:R = Clean 1:4.5+, textbook SMC setup.
📌 Confluences for Bearish Bias
✅ Multiple WSD zones tested with bearish rejection.
✅ Rising channel inside premium is breaking.
✅ Mitigation + BOS on smaller TF.
✅ News candle marked by blue vertical line may act as final volatility spike before continuation.
✅ Price is near VWAP/50% equilibrium → Ideal for smart money to expand to downside.
🧯 Invalidation Conditions
❌ If price closes above 0.59486, we reassess the bias.
❌ A re-entry into the upper WSD with strong bullish volume invalidates the current bearish flow.
🔮 Forecast Summary
This is a classic distribution setup with liquidity engineered into a WSD zone, now showing early mitigation and markdown signs. Unless major manipulation occurs, expect price to expand toward the 0.58398 low in the next 24–48 hours.

EUR-USD Potential Long! Buy!
Hello,Traders!
EUR-USD is trading in an
Uptrend and the pair made
A breakout of the key horizontal
Level of 1.1300 which is confirmed
So now the price is consolidating
Above the new support
And after a potential retest
Of the support level we are
Likely to see a further
Bullish move up
Buy!
Comment and subscribe to help us grow!
Check out other forecasts below too!
Disclosure: I am part of Trade Nation's Influencer program and receive a monthly fee for using their TradingView charts in my analysis.

EURUSD Bearish Setup📌 Market Structure & Setup Summary
Major Supply Zone Rejection (Red Zone at Top):
Price tapped into higher timeframe supply zone at 1.13755 (red box).
This was a buy-side liquidity grab just above the previous high → textbook distribution zone.
Now price is respecting that zone and rejecting it with bearish momentum.
Bearish Rising Channel Broken:
Red trendlines show a rising wedge → often leads to a bearish breakout.
Price is currently breaking out of that wedge to the downside.
Premium Pricing Confirmed:
Price was pushed into the premium zone (above equilibrium), inducing buy orders → now being reversed.
🔄 Trade Plan (Short Bias)
✅ Entry: Activated inside the red supply zone after confirming wick rejections and structure shift.
🛑 Stop Loss: Above the red supply zone (above 1.13755).
🎯 Targets:
TP1 → 1.12545: Structure support and breaker block.
TP2 → 1.11663: Previous demand zone and trendline intersection.
TP3 (Optional) → 1.11002 – 1.10610: External liquidity + trendline + FVG zone.
📉 RR Ratio: Estimated 1:4 to 1:5+ if TP2/TP3 hits.
⚠️ Key Confluences
🔹 Bearish break of rising wedge = structural shift.
🔹 Rejection wick inside red supply + BOS.
🔹 TP zones aligned with previous OB, breaker blocks, and liquidity pools.
🔹 News/volatility likely during the double blue vertical lines, so expect reaction spikes.
🚫 Invalidation Criteria
If price closes above 1.13755, the idea is invalid.
Watch for manipulation or false breakouts during high-impact news.
🔮 Market Forecast
If current rejection holds, expecting price to seek sell-side liquidity from 1.12545, then 1.11663, and possibly lower. This is a classic distribution > BOS > retrace > expansion sequence.

GBPUSD Bearish Setup📌 Current Market Structure
Liquidity Sweep + Rejection in Premium Zone:
Price tapped into the major supply zone (red box) sitting above the last high.
Liquidity above previous highs was swept, and now price is rejecting → a classic buy-side liquidity grab setup.
Bearish Rising Wedge Structure Broken:
Price broke the inner rising wedge (red trendlines) to the downside and is now retesting the supply zone.
Breakdown aligns with a potential reversal entry or at least a bearish pullback.
Higher Timeframe Supply Zone:
The red zone coincides with the 1.34782 resistance, which price failed to break cleanly above.
This zone holds institutional footprints → possible smart money distribution.
🧠 Trade Idea (Bearish Bias Confirmed)
✅ Entry: Already activated inside the red supply zone.
📍 Stop Loss: Just above the red box (around 1.3480).
🎯 Target Zones:
TP1: 1.33281 → minor demand zone and previous consolidation.
TP2: 1.32870 → previous BOS retest zone.
TP3: 1.32543 → deep demand zone and trendline intersection.
TP4: 1.31759–1.31554 → external liquidity resting below structure (long-term target).
🔻 Risk-to-Reward: Excellent potential up to 1:5+ RR if TP4 hits.
🔄 Reversal Signals Confirmation
Watch for:
Bearish engulfing candles with rising volume inside the red zone (VSA style).
Displacement candle or M5–M15 BOS confirming internal structure shift.
⚠️ Invalidation Zone
If price closes a 1H candle above 1.3480, setup is invalidated.
Watch out for possible manipulation during the vertical blue lines (likely high-impact news).
🔮 Forecast:
Expecting a mid- to long-term retracement or reversal back to the 1.31700s – 1.32800s region, based on the current rejection from premium supply and completion of a liquidity sweep.

GOLD WILL KEEP GROWING|LONG|
✅GOLD made a strong
Breakout of the key horizontal
Level of 32.60$ and kept on growing
Which reinforces our bullish
Bias and makes us expect
A further bullish move up
LONG🚀
✅Like and subscribe to never miss a new idea!✅
Disclosure: I am part of Trade Nation's Influencer program and receive a monthly fee for using their TradingView charts in my analysis.

Bitcoin - History Repeating, 110k Next target?Bitcoin has been ranging tightly on the 4H chart, and the recent price behavior is starting to look very familiar. When you compare the current structure with what happened in the first week of May, there are some striking similarities. Back then, BTC consolidated in a sideways channel, faked a breakout to the upside, returned into the range briefly, tapped a demand zone, and then exploded higher into a strong rally. That move laid the groundwork for a steep continuation and fresh highs.
Right now, we’re seeing a nearly identical flow: a prolonged consolidation followed by an upside breakout, a retrace into the prior range, and a precise reaction off a Fair Value Gap (FVG). These repeat structures often hint at algorithmic behavior or institutional footprints, where similar setups trigger similar outcomes.
Structural Context and Price Behavior
The May 6th move began with a candle close above the range, a retest of the lows and FVG within the previous structure, and then an impulsive breakout that never looked back. This breakout was clean, supported by high volume and conviction. Once the retest held, price surged with minimal drawdown.
Now, we’ve just completed a similar sequence. Price closed above the consolidation range, came back in, filled the imbalance (FVG), and instantly found support. It’s also worth noting that both patterns formed after multi-day compressions, which often result in aggressive expansion phases.
What strengthens this setup is that the recent FVG fill didn’t just find support, it caused an immediate reaction to the upside. That’s a key sign that demand is active in this area and institutions may have used this as a re-entry point. From a structure standpoint, as long as we’re holding above the green zone (prior range high and FVG area), the bias remains bullish.
Liquidity Dynamics and Key Zones
The green support area acts as a clear line in the sand. It represents the upper half of the previous range and the origin of the most recent displacement. As long as price stays above this level, the idea is simple: the market is still in expansion mode. The recent wick into the zone could also be viewed as a liquidity sweep, drawing in shorts or stop losses before the real move begins.
In these kinds of setups, institutions often look for “clean-up” wicks to engineer liquidity, and BTC may have just completed that phase. Now that the liquidity grab has taken place and the imbalance is mitigated, the path of least resistance is likely to be up.
Price Target and Expectations
If history repeats, BTC could be setting up for a continuation leg that pushes toward a new all-time high. The $110,000 level makes sense both technically and psychologically. It would not only be a round number magnet but also a logical target based on the range expansion from the current structure. Once the local high breaks, momentum could accelerate quickly, especially if the market gets squeezed and forced to reprice aggressively.
A clean move toward $110,000 would also align with the broader macro narrative, as BTC continues to show resilience and trend continuation despite periods of consolidation.
Conclusion
Bitcoin is potentially repeating its early-May price structure, where a breakout, retest into a key FVG, and strong bullish reaction led to new highs. We’ve just completed a similar retest and bounce, suggesting we may now be in the early stages of a fresh impulsive move. As long as price remains above the key demand zone, this setup favors continuation, with $110,000 as the next major objective. All eyes on whether the market can break above local highs and maintain bullish momentum into uncharted territory.
___________________________________
Thanks for your support!
If you found this idea helpful or learned something new, drop a like 👍 and leave a comment, I’d love to hear your thoughts! 🚀

EURUSD – CME Gap and 0.786 Fib Align at Key Demand ZoneEURUSD has been trading with a strong bullish tone recently, breaking through previous resistance levels with conviction. However, after the latest impulse move to the upside, the market is now showing signs of exhaustion. Price has begun to pull back in a controlled manner, creating a potential opportunity for a deeper retracement into a more favorable area of interest. This kind of pullback is typical after an aggressive rally, and right now, there’s clear evidence that price may need to revisit lower levels before any further continuation higher.
Technical Confluence at Its Best:
Below the current range, there is a high-probability demand zone that combines three powerful elements: a well-respected historical support area, a CME gap that was left unfilled during the previous rally, and a 0.786 Fibonacci retracement from the latest bullish leg. These levels don’t just sit close to each other, they stack right on top of one another, forming a dense pocket of liquidity and technical confluence. The market often gravitates toward these types of zones to rebalance price and fuel the next directional move.
Short-Term Bearish Setup – Let Price Come to You:
The expectation is for price to dip lower in the short term. This would allow the market to tap into the unfilled CME gap and sweep the liquidity resting below the current structure. Traders who went long late in the move are likely to have their stops sitting just beneath recent lows, and this sets the stage for a classic inducement and stop hunt scenario. Price doesn't need to collapse, just a healthy retracement into this confluence zone to rebalance and refill the inefficiency before the real move begins.
Bullish Reversal Expectations:
Once price fills the CME gap and reaches into the 0.786 Fib retracement level, the focus shifts back to bullish. If the market holds this support cleanly and shows early signs of strength, like a displacement back above short-term structure or a strong engulfing candle, this could signal the beginning of a new upward leg. Given the context and momentum from the previous rally, it’s reasonable to anticipate a strong reaction that could drive price back toward the recent highs or potentially even higher.
The Psychology Behind the Setup:
This type of setup is a textbook example of how smart money operates. Price leaves a gap, traders pile in on the breakout, and then the market retraces to fill the imbalance and shake out weak hands before resuming the trend. Understanding the logic behind the CME gap, the liquidity below price, and how the Fib level ties everything together gives this setup depth. It’s not just about lines and zones, it’s about how liquidity flows through the market and how structure sets up to trap and reward.
Conclusion:
Patience is key. Rather than chasing the bullish momentum at current levels, the plan is to wait for price to revisit the zone where the CME gap, historical support, and the 0.786 Fib level align. That’s where the real value lies. If the reaction from this zone is clean and confirms strength, it offers a high-probability entry for the next leg up. No need to force anything, let the market come to you, then execute with precision.
___________________________________
Thanks for your support!
If you found this idea helpful or learned something new, drop a like 👍 and leave a comment, I’d love to hear your thoughts! 🚀

AUD_NZD WILL FALL|SHORT|
✅AUD_NZD made a bearish
Breakout then a retest of the
New resistance around 1.0867
From where we are already
Seeing a powerful pullback
So we are locally bearish
Biased and we will be
Expecting a further move down
SHORT🔥
✅Like and subscribe to never miss a new idea!✅
Disclosure: I am part of Trade Nation's Influencer program and receive a monthly fee for using their TradingView charts in my analysis.

CAD-JPY Will Go UP! Buy!
Hello,Traders!
CAD-JPY made a retest
Of the horizontal support
Of 103,431 and we are
Already seeing a bullish
Rebound so we will be
Expecting a further
Local bullish rebound
Buy!
Comment and subscribe to help us grow!
Check out other forecasts below too!
Disclosure: I am part of Trade Nation's Influencer program and receive a monthly fee for using their TradingView charts in my analysis.
