GBPUSD → 4H Bullish Continuation SETUP (SMC ANALYSIS)We are closely monitoring a potential buying opportunity around the POI zones.
Smcconcepts

CADJPY Sell Setup R:R:1:11This is for short term
Marked Possible Sell zone
Once Reached Entry zone Look for Liquidity sweep and BOSin LTF then Enter
And this is risky too.
Please DYOR before entering the trade.

GBPUSD wave structure in 4H time frame-The daily timeframe is in a downtrend, currently a bullish pullback wave
-The 4H time frame is in an uptrend, currently a bearish pullback wave
-15M time frame is in an uptrend, currently a bearish pullback wave
-15M and 4H have the same downtrend.
-If the Swing Low of the 15M timeframe is broken. We look for opportunities to sell down

BTC wave structure 4H time frameBTC wave structure 4H time frame
The 4H time frame is currently a pullback wave
The 15M timeframe is in a downtrend.
The 5M time frame is the pullback wave of the downtrend
We only have a chance to buy when the 5M time frame turns to an uptrend


Gold's wave structure in the 4H time frameThe 15M timeframe is in a downtrend.
We wait for the 15M pullback to end and the price to drop to the strong Swinglow of the 4H timeframe


Reeling in Profits: A Comprehensive Guide to Short AUDCAD🚩 New Signal Notification - Swing Trade
📣 Attention Traders! 📈🔍
🔹 AUDCAD, Short when Pullback to Supply Zone 🔹
📊 Here are the key points for a potential trading opportunity in AUDCAD:
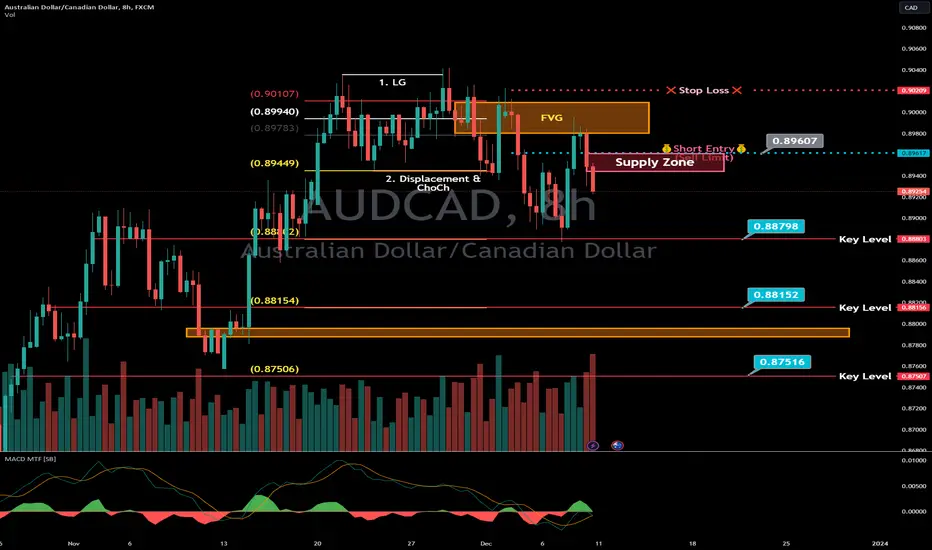
🔹 AUDCAD, 8H, ICT Short setup🔹
From our AI screener, we found CAD in Daily chart timeframe is going to Strong side right after the BoC Interest Rate Decision on 6th Dec, 2023 which made CAD pairs got 8H ICT, Short setup.
Here we bring you a great chance to watch and earn!
The Bank of Canada (BOC) has decided to keep the interest rate at 5% for the third consecutive decision, as expected. The short-term interest rates are the primary factor in currency valuation, and a higher than expected rate is positive/bullish for the CAD, while a lower than expected rate is negative/bearish for the CAD. The BOC’s tone of the statement hints that there will be no rate hikes in the near future. So, if you’re planning to invest in CAD, this is a good time to do so! 💰💸
TA:
By simple ICT setup, we found there is a ICT Short setup in timeframe 8H.
Last week, 8H bar highs were rejected from the fair very gap (FVG) and formed a Lower High
Our idea to the next support levels below as shown.
AUDCAD is one of our focus this week, Only Short strategy, may be landing slowly to the support levels
Target 1↘️ 0.8879
Target 2↘️ 0.8815
Target 3↘️ 0.8752
🔔Short entry near this Supply Zone: 0.8960 to 0.8945
Keep a close eye on these levels and trends in AUDCAD for potential
trading opportunities. Remember to manage your risk and trade
responsibly!
✅ Stay tuned for more updates and analysis. Happy trading! 🚀💰
GBPCAD short term sell reversalGBPCAD is at extreme supply zone, took out 1.72465 and liquidate 1.70845 i expect GBPCAD to drop on 1.70092 - 1.69562 demand zone

GBPUSD Establishing strength for bear sentiment GBPUSD at extreme(weekly supply zone) hits daily supply zone and moved away indicating a potential bear sentiment if it holds possible target would be 1.25563 or 1.25165 - 1.24511 in to demand zone.
GBPUSD might take liquidity at 1.26531 before dropping.

Expect a Bearish Reversal | EURUSD Daily potential supply zoneThe liquidity taking at 1.08551 having a daily momentum candles creates the potential supply zone after rejecting from the weekly daily supply zone thus price might respect the zone to a target 1.08121 or 1.07596 - 1.06534 Demand zone.

potential reversal zone D1 or D2|EURUSD at weakly supply zone 1.06500 and 1.05241 liquidity taking creates the weekly supply zone thus expecting a reversal to 1.08307 or 1.07596 - 1.06534 demand zone

weekly time frame overview | USDCHF supply zone in control USDCHF established a potential weekly supply imbalance ( w potential imbalance ) in between two zones W supply zone and W demand zone indicating more strength for bear sentiment and also a possibility for a range between this two zones.
if the w potential imbalance remains the W supply zone will be in control.
also if the W demand zone will take control the w potential imbalance will be raided out giving strength to W demand zone thus a bullish sentiment.

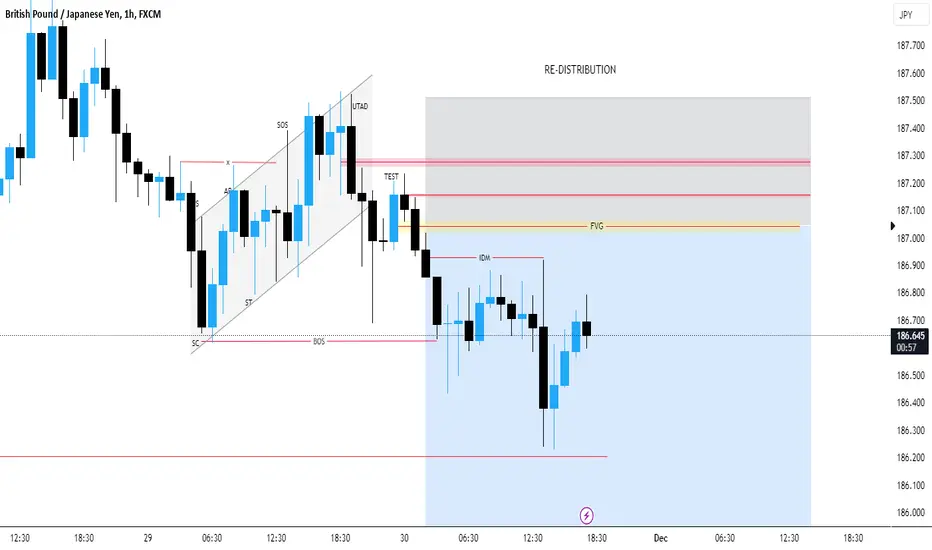
GBPJPY R:R 1:3 Wyckoff Re-DistributionThis is for short term
Marked Possible Sell zone
Once Reached Entry zone Look for Liquidity sweep and BOS in LTF then Enter
And this is risky too.
Please DYOR before entering the trade.
GOLD great setup for LONGFew minutes ago I finished my scalping after open USA.
Last H1 was very strong therefore I took just buy buy buy.
If break H1 I see potential to SUPPORT and more long

EURGBP R:R 1:11This is for short term
Marked Possible Buy zone
Once Reached Entry zone Look for Liquidity sweep and BOS in LTF then Enter
And this is risky too.
Please DYOR before entering the trade.

AUDCAD R:R 1:4This is for short term
Awaiting for News Release.
Marked Possible Buy zone
Once Reached Entry zone Look for Liquidity sweep and BOS in LTF then Enter
And this is risky too.
Please DYOR before entering the trade.

EURUSD Long term short ideas from 1.10500 (or 1.11000)This idea is based on my higher time frame bias that I have marked out from a while back, as we are steadily approaching a key level on the HTF. I'm going to be expecting EU to melt back down towards 1.07500 or lower to fill in major imbalances that have been left from before. In addition to this, we are entering the 0.78 region of the fib range which is a more premium zone to sell.
As of now I will be waiting for price to slow down momentum and start showing some signs of weakness, in order for give us a a better sign that price is ready for a reversal. Ideally I want to wait for the 8hr supply on top of the daily however, if we see our lower time confluence i.e. Wyckoff distribution & CHOCH, I will be then looking to enter and hold on an intra-day basis.
Confluences for long term EURUSD shorts are as follows:
- EU is overall bearish on the higher time frame like the (monthly and weekly)
- This is a pro trend trade that will be following the overall market trend.
- Internal structure is also bearish as we have CHOCH on the higher time frame with a BOS.
- Price is approaching a daily supply zone that has caused a BOS to the downside.
- Price is also entering the 0.78 area of the fibonacci range good sign for a potential reaction.
- Lots of FVGs on the higher time frame below as well as major pools of liquidity points.
- Price has also swept lots of liquidity to the upside and has take out most of trend line Liq.
P.S. Personally, I see price most likely reacting off the 8hr supply above the daily, just because there was a previous consolidation that still holds some liquidity above it. Hence why I will be waiting for that to get swept to mitigate the institutional candle that was left by the 8hr POI.

usdjpy H1We see that after inflation news was negative for the dollar
The price has come down strongly and now we have 3 areas with a high probability of rebound
1- 150.970
2-151.250
3-151.500 if we see this Number Sell With biiiig Lot Size
have a good luck to all

EURUSD SMC Setup | Mechanical StructureAs EU has broken the structure to the upside on the 15m timeframe. I am looking for potential buys from the Extreme Imbalanced Orderblock to continue breaking structure to the upside.

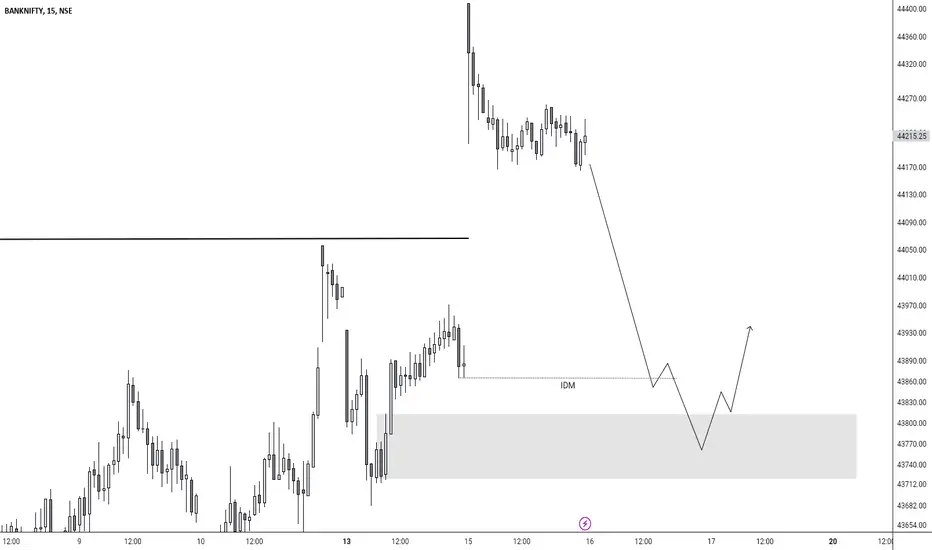
Bank Nifty 15min setupBN 15min structure have given structure change from negative to positive structure, expecting price to come to take IDM and from BUY-side POI price should reverse and push upside....
cpi trade cpi trade based on trend and fundamental on the numbers that the bureau labor statistics were quite bad for the us

USDCAD 15 min The best opportunity of the week
Clear graph 2 position short with a Diffrnt Stop
have a good luck
