Opening (IRA): SMCI April 17th 34 Covered Call... for a 32.13 debit.
Comments: High IVR/IV. Selling the -84 delta call against shares to emulate the delta metrics of a 2 x expected move 16 delta short put, but with the built-in defense of the short call.
Metrics:
Buying Power Effect/Break Even: 32.13/share
Max Profit: 1.87
ROC at Max: 5.82%
50% Max: .94
ROC at 50% Max: 2.91%
Will generally look to take profit at 50% max, roll out short call if take profit is not hit.
SMCI

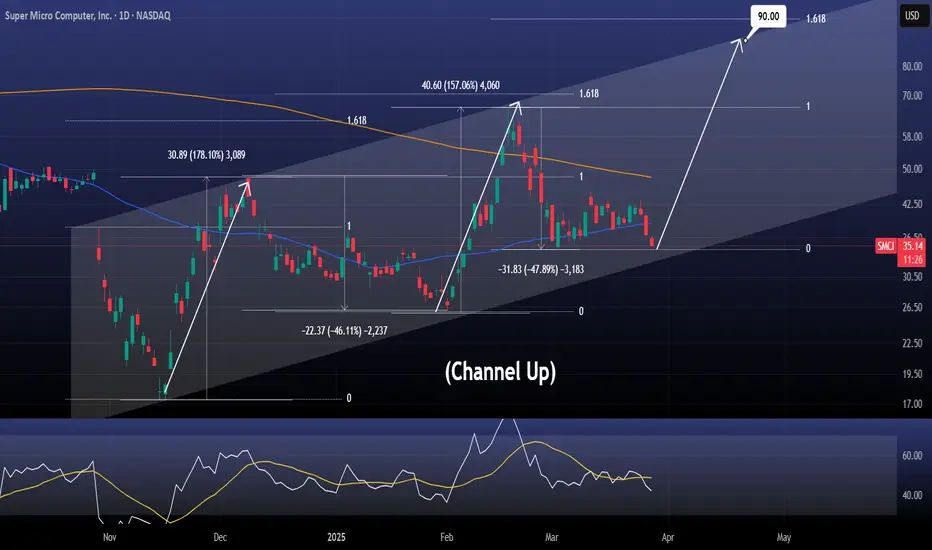
SMCI is a bargain here. Target $90.Super Micro Computer Inc / SMCI is trading inside a Channel Up.
The new bearish wave has already completed a -47% decline, same as the previous one, and the symmetry inside this pattern seems very high.
The price is now very close to the Channel's bottom and is technically a strong buy opportunity.
We expect a new higher high close to the 1.618 Fibonacci extension.
Buy and target $90.
Follow us, like the idea and leave a comment below!!
SMCI: Channel Up bottomed on the 1D MA50. Long term Target: $148Super Micro Computer Inc is neutral on its 1D technical outlook (RSI = 52.184, MACD = 0.800, ADX = 28.146), the ideal condition to go on a long term buy as the price has been holding the 1D MA50 for 2 straight weeks. The goal now is to cross again above the 1D MA200 but that was already done on February 18th and the pattern that has been established is a Channel Up. The market however may be aiming at much higher as the November 14th 2024 bottom was priced on the Head of an Inverted Head and Shoulders pattern, a technical bullish reversal formation that targets its 2.0 Fibonacci extension once completed. The trade is long, TP = 148.00.
## If you like our free content follow our profile to get more daily ideas. ##
## Comments and likes are greatly appreciated. ##

SMCI -- more weakness ahead near term!looking for additional sell sequences to fill gap targets at 33.7 and 31.5 levels as we approach tariffs being implemented on 4/2/25.
holding put options for 4/17 expiration

Put your seatbelts on for $SMCI to $55-65 range- NASDAQ:SMCI traders be ready to pounce and ride the momentum for this name.
- Buyers are getting aggressive and price can easily be pushed to 55 ( 200 sma ) to 65 range.
- $55 seems to be a resistance, if price moves above that then we could be seeing some parabolic moves in this name.
- Please Notes that, NASDAQ:SMCI has to submit SEC filing before Feb 25, 2025 and CEO re-assured that they would be filing the documents to SEC in time.
- So, next 2 weeks, buckle up your seatbelts for volatility!

$SMCI: Super Micro Computer – AI Server Surge or a Pit Stop?
NASDAQ:SMCI : Super Micro Computer – AI Server Surge or a Pit Stop?
AI infrastructure’s hotter than a July barbecue, with revenue up 110% to $14,989.2 million in 2024! But with internal control concerns, is this tech beast charging up or taking a breather? Let’s dive in!
(1/9)
Good morning, everyone! ☀️ NASDAQ:SMCI : Super Micro Computer – AI Server Surge or a Pit Stop?
AI infrastructure’s hotter than a July barbecue, with revenue up 110% to $14,989.2 million in 2024! But with internal control concerns, is this tech beast charging up or taking a breather? Let’s dive in! 🔍
(2/9) – PRICE PERFORMANCE 📊
• Fiscal 2024: Net sales soared 110.4% to $14,989.2 million 💰
• Server Systems: Up 115.9%, GPU servers leading the charge 📏
• Sector Trend: AI demand’s skyrocketing 🌟
It’s a wild ride, fueled by AI’s hunger! ⚙️
(3/9) – MARKET POSITION 📈
• Market Cap: $2.4B, based on shares outstanding 🏆
• Holdings: Servers, storage, and AI solutions ⏰
• Trend: International sales steady at 32%, showing global appetite 🎯
Firm, carving a niche in AI infrastructure! 🚀
(4/9) – KEY DEVELOPMENTS 🔑
• 10-K Filing: Dropped Feb 25, 20
25, dodged NASDAQ delisting 🔄
• Revenue Driver: GPU servers for AI workloads 🌍
• Market Reaction: Shares jumped 19.8% after-hours 📋
Adapting, with investors cheering the comeback! 💡
(5/9) – RISKS IN FOCUS ⚡
• Internal Controls: Audit flagged issues, per Feb 25 filing 🔍
• Competition: Big players in AI server space 📉
• Volatility: High-growth sectors swing hard ❄️
Tough, but risks loom! 🛑
(6/9) – SWOT: STRENGTHS 💪
• Revenue Boom: 110% growth, $14,989.2 million in sales 🥇
• AI Focus: GPU servers crushing it 📊
• Global Reach: 32% international sales 🔧
Got rocket fuel in the tank! 🏦
(7/9) – SWOT: WEAKNESSES & OPPORTUNITIES ⚖️
• Weaknesses: Internal control concerns, per audit 📉
• Opportunities: AI infrastructure demand keeps soaring 📈
Can it fix the cracks and ride the wave? 🤔
(8/9) – 📢 SMCI’s revenue up 110%, with AI demand exploding, your take? 🗳️
• Bullish: Shares to $50+ soon, AI’s unstoppable 🐂
• Neutral: Steady, risks balance growth ⚖️
• Bearish: $35 looms, controls spook 🐻
Chime in below! 👇
(9/9) – FINAL TAKEAWAY 🎯
SMCI’s revenue surge to $14,989.2 million screams AI potential 📈, but control issues add a pinch of caution 🌿. Volatility’s our friend—dips are DCA gold 💰. Grab ‘em low, climb like pros! Gem or bust?

$SMCI - Does SMIC file their 10k by 420pm EST today? Doubt it. Not a single company has ever waited until after market close to file their 10k on the day of an EXTENDED deadline to file their 10k. Not one. Ever.
Is SMCI nvda's 3rd or 4th largest customer? Yes.
Does SMCI's failure to get a cpa firm willing to sign off on the 10k mean it will affect nvda?
Buckle up chuck.

+$278,000 realized profit on $JTAI todayMultiple buys along the way last two buys were one at $8 with "buy & hold" until $10 - $15 target and the last one was at $10 to add to the position from $8 and sell all into the vertical beyond $11
+$278,000 realized profit from JTAI alone
11 trades total on the day
5 wins on JTAI
2 wins on SINT
2 wins, 2 losses on OSRH
Major day 💪

Is there a single soul out there who haven't profited on this?100 Million shares volume
Continuous buying on every dip
Multiple Buy Alerts sent out with explanation on why to buy and hold and which price to aim for into end of day
Is there a single soul out there on this planet who haven't made a profit on NASDAQ:JTAI today?
If you're the one you need help with trading! This one was way too easy, DM me asap to help you!

SMCI BONANZA HOW SUPERMICRO GOES BANANA-STANDING AGAINThe Great Banana Republic of Bananadom
🍌 In a world where sunshine dripped like honey and the very air smelled of sweet ripeness, lay the Great Banana Republic of Bananadom. Here, houses were carved from colossal banana peels, their smooth yellow surfaces gleaming. The roads? Paved with dried banana chips, providing a satisfying crunch with every step. The citizens, known as Bananadomites, were a cheerful bunch, their skin naturally tinted a warm yellow. They wore clothes woven from banana fiber, adorned with intricate patterns of banana leaves and blossoms.
🍌 Our protagonist was Bananabelle, a spirited Bananadomite with a crown of woven banana leaves atop her head. Bananabelle wasn't just any Bananadomite ; she was the Royal Banana Baker, famed throughout the republic for her innovative banana-based delicacies. From banana bread that sang sweet melodies when sliced to banana smoothies that granted temporary flight, her creations were legendary.
🍌 Life in Bananadom was idyllic, a continuous cycle of harvesting, baking, and celebrating the glorious banana. But one day, a shadow fell upon this sunny paradise. The Great Banana Tree, the source of all bananas in Bananadom, began to wither. Its leaves drooped, its fruit shriveled, and the air lost its sweet fragrance. Panic gripped the republic. Without the Great Banana Tree, Bananadom would cease to exist.
🍌 Bananabelle, known for her courage and ingenuity, stepped forward. She proposed a daring quest: to venture beyond Bananadom, into the uncharted lands rumored to exist beyond the seemingly endless banana plantations that surrounded their republic. Legend spoke of a mystical Banana Oasis, a hidden paradise where the first banana seed sprouted, and where the secret to eternal banana growth resided.
🍌 Gathering a team of brave Bananadomites– a strong banana farmer named Bananabert, a wise old banana leaf weaver named Nana, and a nimble banana monkey named Chip – Bananabelle set off. Their journey was fraught with peril. They navigated through jungles of giant banana slugs, crossed rivers of banana pudding, and outsmarted grumpy gorillas guarding banana hoards.
🍌 Along the way, Nana shared ancient Bananadomite lore, revealing that the Great Banana Tree's decline was linked to a growing apathy among the Bananadomites. They had become complacent, taking the banana’s bounty for granted and forgetting the importance of gratitude and respect for nature.
🍌 Finally, after weeks of travel, they reached the Banana Oasis. It was a sight to behold: a lush valley teeming with every variety of banana imaginable. At its heart stood a shimmering waterfall of banana nectar, nourishing a single, glowing banana seed.
🍌 As Bananabelle approached the seed, a voice echoed through the valley. It was the spirit of the Great Banana Tree, reminding her of the importance of cherishing their blessings. Bananabelle, humbled, vowed to reignite the spirit of gratitude and respect in Bananadomite. She carefully collected a vial of the banana nectar and, with a renewed sense of purpose, led her team back home.
🍌 Upon their return, Bananabelle poured the nectar onto the roots of the Great Banana Tree. Slowly, miraculously, the tree began to revive. Its leaves unfurled, its fruit plumped, and the air filled with its sweet fragrance once more. The Bananadomites rejoiced, their hearts filled with gratitude. Bananabelle's bravery and wisdom had saved their republic. From that day on, the people of Bananadom celebrated the Banana Oasis Quest, a reminder to always cherish the gifts of nature and the power of community. And Bananabelle? She continued to bake her legendary banana treats, each one a testament to the enduring spirit of the Great Banana Republic of Bananadomite.
🍌🍌🍌 What's a Banana-tastic adventure 🍌🍌🍌

SMCI’s Game-Changing Move: Could This Be a 500% Opportunity? Bullish Analysis for Super Micro Computer, Inc. (SMCI)
1. Valuation Metrics
P/S Ratio: Previously 7.46, now just 1.43, showcasing significant undervaluation compared to historical levels.
P/E Ratio: Previously 90, now 16.67, making the stock much more attractive to value-focused investors.
Fair Value Estimate: According to Simply Wall Street , the fair value per share is estimated at $439.38 , suggesting substantial upside from the current price levels.
2. Strong Financial Metrics
Current Market Cap: $18.87 billion.
Revenue: This year's revenue is $14.94 billion, and 2025 revenue is expected to exceed $23 billion, surpassing the current market cap—a promising signal of growth potential.
Financial Health: SMCI can cover all its debt twice over , with a debt-to-equity ratio of 0.40 , which sits comfortably in the ideal range of 0.30–0.60.
3. Growth Drivers
New Manufacturing Facility: A facility in Malaysia is expected to become operational in the second quarter of fiscal year 2025, enabling SMCI to scale up its AI server production.
Liquid Cooling Expertise: SMCI specializes in liquid cooling technology , critical for the new generation of powerful chips and data centers, including Nvidia’s Blackwell GPUs , which are experiencing record demand as Nvidia ramps up production.
4. Technical and Price Action
Support Levels: SMCI has established strong support at $30.
Trend Reversal: The stock has broken the structure of its downtrend and is now showing clear signs of heading to the upside, further reinforcing bullish momentum.
Resistance Levels: Potential price targets based on resistance areas:
Target 1: $50 (52.4% increase).
Target 2: $70 (113.4% increase).
Target 3: $100 (204.8% increase).
Target 4: $120 (265.8% increase).
Long-term Target: $200+ (509.75% increase).
5. AI Market Leadership
SMCI’s continued focus on AI servers positions it as a key beneficiary in the rapidly growing AI-driven computing market.
Conclusion
With its attractive valuation, robust financial health, strategic expansion plans, and leadership in liquid cooling and AI servers, SMCI is well-positioned for substantial growth. The recent trend reversal adds technical confirmation to the fundamental bullish case, making current price levels a compelling opportunity for investors seeking exposure to the AI and data center markets.

SMCI - Sh!tty I know but is it good Sh!t now?Technically looking solid.. but back of the mind has that fear, what if mgmnt messes up with the 10k filing etc.
Anyways.. I've a long position from post earnings.
Long anywhere here
Target 1 - 52
Target 2 - 68
Target 3 - 80

SMCI: Rejection on the 1W MA50 will be the last buy opportunity.Super Micro Computer has turned overbought on its 1D technical outlook (RSI = 76.279, MACD = 3.600, ADX = 40.488) as a result of the relentless rally of the past 2 weeks but on 1W (RSI = 57.515) it just turned bullish, which is indicative of the long way it has to cover until it makes new ATH again following last year's accounting discrepancies. The price is about to test the 1W MA50 as a Resistance, which under normal circumastances of Bull Cycle, it is a support. A potential rejection there, should provide the last buy opportunity that will test the 1D MA50 as a Support. We remain long on SMCI, next TP = 95.00.
See how our prior idea has worked out:
## If you like our free content follow our profile to get more daily ideas. ##
## Comments and likes are greatly appreciated. ##

Super Micro Computer (SMCI) Shares Surge 13%Super Micro Computer (SMCI) Shares Surge 13%
The Super Micro Computer, Inc. (SMCI) stock chart shows:
→ Friday’s closing price rose over 13% from Thursday’s close;
→ The stock has surged more than 80% from its February low;
→ Friday’s close marked the highest level since late October 2024.
SMCI’s rally comes despite an 11 February quarterly report that missed expectations:
→ EPS: $0.59 vs. expected $0.60;
→ Revenue: $5.65bn vs. expected $5.72bn.
Bullish sentiment is driven by (according to media reports):
→ A forecasted $40bn revenue for FY2026, 70% higher than projected FY2025 revenue;
→ Reports indicate that SMCI shares are unlikely to be delisted from NASDAQ due to financial reporting issues (which we previously discussed when analysing the SMCI stock chart on 3 December);
→ Investor enthusiasm for AI and rapid data centre construction to support it.
Technical Analysis of SMCI Stock
The price has reached the key psychological level of $50 per share:
→ Historical price action at this level has often triggered significant reversals;
→ A bullish cup-and-handle pattern is forming.
A higher second low suggests growing demand strength, potentially leading to a bullish breakout above $50.
SMCI Stock Price Forecast
Analysts remain cautious. According to Yahoo Finance:
→ Only 2 of 6 analysts recommend buying SMCI shares;
→ The 12-month average price target is $47.91.
Trade on TradingView with FXOpen. Consider opening an account and access over 700 markets with tight spreads from 0.0 pips and low commissions from $1.50 per lot.
This article represents the opinion of the Companies operating under the FXOpen brand only. It is not to be construed as an offer, solicitation, or recommendation with respect to products and services provided by the Companies operating under the FXOpen brand, nor is it to be considered financial advice.

SMCI - Climbing out of the GRAVE! 100% UpsideNASDAQ:SMCI
🎯$64 🎯$85 Incoming
WOW, from dead company to short attacks into oblivion this company has clawed back from the grave!
- Inverse H&S
- Fake Out on the S/R Zone
- Green H5 with Bullish Cross
- Volume shelf with GAP
- Up Trending Wr%
- RSI/ STOCH breaking out of downtrend
If I was to enter this trade I would look for an entry at the retest of the Inverse H&S breakout (Blue Circle) while we also create a WCB!
Not financial advice

$SMCI (SUPER MICRO COMPUTER): AI-DRIVEN GROWTH AMID GOVERNANCESMCI (SUPER MICRO COMPUTER): AI-DRIVEN GROWTH AMID GOVERNANCE WOES
1/8
Super Micro Computer ( NASDAQ:SMCI ) just revealed prelim Q2 FY2025 sales of $5.6–5.7B (+54% YoY), riding AI’s wave. But delayed filings & margin pressure spark caution. Let’s dig in! 💻⚡️
2/8 – REVENUE & EARNINGS SNAPSHOT
• Q2 sales: $5.7B (vs. $5.9B est.), EPS: ~$0.59 (est. $0.64)
• Full-year outlook trimmed to $23.5–25B (was $26–30B)
• Non-GAAP gross margin: ~11.9%; operating margin: ~7.9%—still under pressure 🏭
3/8 – KEY FINANCIAL EVENTS
• $700M in 2.25% convertible senior notes → fueling AI server growth
• Filing delays (10-K, 10-Qs) → must meet Feb 25, 2025 to avoid Nasdaq delisting
• New auditor BDO checks the books—no fraud found, but concerns linger about governance 🧐
4/8 – GOVERNANCE & INVESTIGATIONS
• Ongoing SEC & DOJ probes after Hindenburg’s short-seller report
• CEO says they’ll meet filing deadline, but trust is still shaky
• Market watchers: “No fraud found” is good, but the uncertainty stings 🤔
5/8 – SECTOR CONTEXT
• Competes with Dell ( NYSE:DELL ), HPE ( NYSE:HPE )—both see AI demand, but SMCI more focused
• SMCI trades at ~11x 2025 earnings (vs. Dell at 15x, HPE at 12x)
• Could be undervalued—but only if governance issues don’t overshadow the AI growth story 🚀
6/8 – RISKS
• Margin Pressure: R&D + product mix + potential GPU shipment delays (Nvidia Blackwell)
• Debt Load: Total debt now ~$1.9B, plus $700M in convertible notes
• Regulatory Overhang: Missing that Feb 25 deadline = serious delisting risk ⚠️
7/8 Is SMCI worth the gamble?
1️⃣ Bullish—AI potential outweighs the risks
2️⃣ Neutral—Need clarity on filings & margins
3️⃣ Bearish—Governance red flags trump growth
Vote below! 🗳️👇
8/8 – STRATEGIC OUTLOOK
• 70%+ revenue from AI platforms → big edge if servers remain hot
• Partnerships w/ Nvidia & push into liquid-cooled data centers
• Delaying or messing up compliance could sabotage all that potential 🌐

SMCI Bull Flag completed and targeting $65.Three months ago (November 07 2024, see chart below), we issued a strong buy signal on Super Micro Computer Inc (SMCI), after the stock had declined by more than -85% from its All Time High (ATH):
The signal was an instant success, as the price rebounded on the following week. Our perspective hasn't changed and today, with the stock up currently by more +13% intra day, is another reason why.
Last week the price made an excellent rebound on its 1W MA200 (orange trend-line), solidifying this level as the new Support and turning out to be a huge demand level that completed the Bull Flag pattern of December 09 2024 - January 27 2025. As you can see , the 1W MA200 was also on the symmetrical Support Zone that only broke on the 'fake-out' of November's accounting scandal peak.
The interesting take on this 1W chart is that every similar Bull Flag since the 2020 COVID crash, tested the 1.5 Fibonacci extension before the next technical pull-back. As a result, we expect a $65.00 test, which would exceed the 1W MA50 (blue trend-line), before a new 2-month correction.
-------------------------------------------------------------------------------
** Please LIKE 👍, FOLLOW ✅, SHARE 🙌 and COMMENT ✍ if you enjoy this idea! Also share your ideas and charts in the comments section below! This is best way to keep it relevant, support us, keep the content here free and allow the idea to reach as many people as possible. **
-------------------------------------------------------------------------------
💸💸💸💸💸💸
👇 👇 👇 👇 👇 👇

SMCI: Inverse Head and Shoulders close to bullish breakout.Super Micro Computer Inc turned neutral on its 1D technical outlook today (RSI = 51.775, MACD = -1.260, ADX = 17.645) as it crossed over the 4H MA50. The 4H MA200 remains the long lasting resistance ever since the July selling commenced but the recent 2 month Channel Down looks like the right shoulder of an Inverse Head and Shoulders pattern. If it is that indeed, we should see a break above the 4H MA200 as soon as next week even. If successful, we will go long as the buying sentiment would have returned to SMCI on the long term. Aim for the usual target of such Inverse Head and Shoulders, the 2.0 Fibonacci extension (TP = 130.00).
## If you like our free content follow our profile to get more daily ideas. ##
## Comments and likes are greatly appreciated. ##

Super Micro Computer (NASDAQ: $SMCI) Faces Critical SupportMarket Movement:
Super Micro Computer, Inc. ( NASDAQ:SMCI ) is experiencing a notable dip, down 2.27% in Monday’s premarket trading. Investors are closely watching the stock as it approaches a critical structural support level within its long-standing symmetrical triangle pattern, a formation that has persisted since March 2024.
Technical Analysis
The symmetrical triangle pattern, marked by converging trendlines, signifies a prolonged phase of consolidation. A significant technical structure has formed, with the baseline aligned with the December 2023 pivot. If NASDAQ:SMCI breaches this support level, the downside potential is substantial, possibly leading to a retracement toward the $17 support level. However, should the stock witness a breakout above the Break of Structure (BOS), it could catalyze a strong rally, aiming for the highs seen in March 2024.
The RSI (Relative Strength Index) currently sits at 40, indicating that the stock is teetering on the edge of bearish sentiment but not yet in oversold territory. The RSI’s ability to maintain this level could determine whether a bounce from support materializes or if further downside pressure ensues. The next few sessions will be pivotal in shaping NASDAQ:SMCI ’s short-term price trajectory.
Recent Earnings Overview
Despite the recent price dip, NASDAQ:SMCI has demonstrated impressive financial performance. The company reported a staggering 109.77% YoY revenue growth, reaching $14.94 billion in 2024, compared to $7.12 billion in the previous year. Earnings also surged by 88.77%, totaling $1.21 billion. These figures reflect strong operational efficiency and growing demand for its high-performance server and storage solutions.
Analyst Forecast & Price Target:
According to 16 analysts, NASDAQ:SMCI holds an average rating of “Hold.” The 12-month price forecast suggests a target of $57.74, implying a potential upside of 102.45% from its latest price. While analysts remain cautiously optimistic, the stock’s future hinges on whether it respects its current support levels or experiences a significant breakdown.
Conclusion:
NASDAQ:SMCI is at a technical crossroads, where a break below the symmetrical triangle’s baseline could signal further downside pressure, while a successful breakout above resistance could reignite bullish momentum. With strong fundamental backing and an impressive growth trajectory, the coming days will be crucial in determining whether the stock can reclaim its bullish potential or succumb to market pressures.
Traders and investors alike should keep a close eye on the Break of Structure (BOS), as it will likely dictate NASDAQ:SMCI ’s next major move in the market.

ADVANCED MICRO DEVICES $AMD | CHIP STOCKS FALL DOWN Dec11'24ADVANCED MICRO DEVICES NASDAQ:AMD | CHIP STOCKS FALL Dec11'24
NASDAQ:AMD BUY/LONG ZONE (GREEN): $141.50 - $166.50
NASDAQ:AMD DO NOT TRADE/DNT ZONE (WHITE): $134.50 - $141.50
NASDAQ:AMD SELL/SHORT ZONE (RED): $110.00 - $134.50
NASDAQ:AMD Trends:
NASDAQ:AMD Weekly Trend: Bearish
NASDAQ:AMD Daily Trend: Bearish
NASDAQ:AMD 4H Trend: Bearish
NASDAQ:AMD 1H Trend: Bearish
NASDAQ:AMD Oct29 earnings release started bearish trend. Bears should start targeting the previous quarter's lows. Price is currently breaking my indicator's range to the downside, and all display indicators are pointing to a bearish trend for $amd. Recently, bearish momentum breaks down from the DNT range this week.
This is what I would personally look at before entering trades, everything is subject to change on a daily basis and as I analyze different timeframes and ideas.
ENTERTAINMENT PURPOSES ONLY, NOT FINANCIAL ADVICE!
trendanalysis, trendtrading, priceaction, priceactiontrading, technicalindicators, supportandresistance, rangebreakout, rangebreakdown, rangetrading, chartpatterntrading, chartpatterns, advancedmicrodevices, amd, NASDAQ:AMD , chipstocks, microchips, microchipdevices, google, googledrive, googlechip, googlesupercomputer, smci, supermicro, nvda, nvidia, nasdaq, ndq, qqq, techstocks,

SMCI H.L ?Price Action has been playing perfectly.
You can clearly see H.H and HLs being formed. We held support one more time.
Is it ready for a new push higher?

Bearish OverviewNASDAQ:SMCI
What we see hear is support broke, and news are influencing in this stock,
Stock is not only charts or bars but also investors trust to company,
However my forecast is up until next financial report and cleaning all bad news this stock may face volatility but has a good future based on it's last performance.
(Blue lines are lower lows)
Please share your ideas.
Thanks

$SMCI slippy downside; $29 targetWith the rebalancing of NASDAQ, removal of NASDAQ:SMCI after it got a pump from it submitting financial reports to keep it from being delisted the big dogs realize this fraudulent company isn’t worth the risk, investment and headache. I expect below $30. Easily can be down 5% this week and that’s modest. Official date is December 23rd. I will be entering $30p for a swing. There was tons of buying at sub $20’s. There will be tons of selling here. How do people invest in a company who can’t report on time, falsify numbers, auditing team quits on them? Sometimes you don’t play the charts, you play the god damn news. Look at NYSE:UNH , look at my past post & chart. That thing got smoked. NASDAQ:MRNA is next.
WALLSTREETLOSER
