Bearish or bullish SMCI Stock USD. Breakpoint coming.Technical and Fundamental Analysis for SMCI 🚀
The current stock price of Super Micro Computer, Inc. (SMCI) is $41.87 USD . The target sell point is set at $73 USD, indicating a potential upward movement. The s upport level for buying is $34 USD , suggesting that if the stock price drops to this level, it may be a good opportunity to purchase.
It is crucial to maintain the resistance level at $41 USD ; otherwise, the stock may decline further to the support level of $34 USD.
Technical indicators on the chart include moving averages and volume data, which help in understanding the stock's price trends and market sentiment. The green and red bands represent different moving averages, showing the stock's volatility and potential price movements.The annotations on the chart highlight key support and resistance levels, providing a visual guide for trading decisions.
Fundamentally , Super Micro Computer, Inc. is a company listed on NASDAQ, and its stock performance is influenced by various factors such as market conditions, company earnings, and industry trends. Investors should consider both technical and fundamental aspects before making trading decisions.
Conclusion: 🚀
The analysis suggests monitoring the resistance level at $41 USD closely. If the stock price maintains above this level, it may move towards the target sell point of $73 USD. However, if it fails to hold this resistance, it could drop to the support level of $34 USD, presenting a potential buying opportunity.
If you want to refine this analysis or explore other scenarios, I'm here to dive deeper into key points! 🚀 Subscribe! TSXGanG
I hold a CCVM and MNC (Certificate of Competence to become a securities broker anywhere in Canada) and have been working as a trader for five years.
It’s a pleasure for me to help people optimize their trading strategies and make informed financial market decisions. 🚀
Smciidea

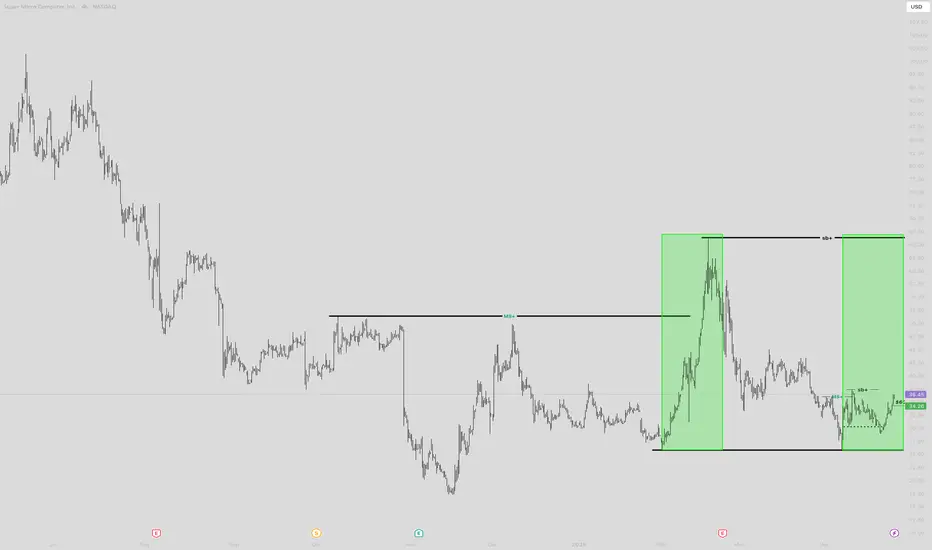
SMCI LONG IDEASMCI broke out of a downtrend and support level with a strong weekly bullish candle. This is a signal that the stock is ready for appreciating in value. The first signal was in November 2024 when there was a divergence on awesome oscillator. This was followed by a breakout of down trend line in February 2025, which made price to move from around 36 to around 66.
Currently, price is showing a strong momentum to rally up again. With a pullback to the key level, the best time to buy the stock is at current price or between 38 and 40. An aggressive trader/investor could have when the previous weekly candle closed bullish, while a conservative trader/investor would have waited for the pullback to the key level which is what's happening at the moment.
The entry is around 38 and 40 while the stop could be 25 and the target can be 66 and 119.
Confluences for the signal:
1. Price broke out of a down trend line and closed with a strong weekly bullish candle.
2. Price also closed above a support level.
3. Price was coming from a strong support level.
4. Awesome oscillator is still below 0 and it's just resuming bullish region.
Disclaimer: this is not a financial advice. The outcome maybe different from the projection. If you can't accept the risk, don't take the signal.

SMCI ONCE IN A LIFETIME DIP BUY!!!Ive taken a $600 position on SMCI I will be looking to size into as it works. You can clearly see what happened last time we were at this price area. I have less than a $1 stop loss if price were to return below the green line. This will be a LONGGGGGGGGGGG hold into the future.
SUPERMICRO COMPUTERS $SMCI |SUPERMICRO TO SUPER BEARISH Dec13'24SUPERMICRO COMPUTERS NASDAQ:SMCI | SUPERMICRO TO SUPER BEARISH Dec13'24
When to enter NASDAQ:SMCI :
NASDAQ:SMCI BUY/LONG ZONE (GREEN): $39.00 - $48.00
NASDAQ:SMCI DO NOT TRADE/DNT ZONE (WHITE): $34.85 - $39.00
NASDAQ:SMCI SELL/SHORT ZONE (RED): $18.50 - $34.85
NASDAQ:SMCI Trends:
NASDAQ:SMCI Weekly Trend: Bearish
NASDAQ:SMCI Daily Trend: Bearish
NASDAQ:SMCI 4H Trend: Bearish
NASDAQ:SMCI 1H Trend: Bearish
NASDAQ:SMCI has been spiraling downwards for weeks. We finally saw price come to life just this past month, but the bearish trend has continued. The break below 40.00 confirmed the bearish trend for me, and I will look to see price either continue below 34.85 or try to create some type of support here. Bulls should be eyeing a break above the 39 - 40 level to try to gain some momentum. My trend indicators are also all pointing to the downside.
This is what I would personally look at before entering trades, everything is subject to change on a daily basis and as I analyze different timeframes and ideas.
ENTERTAINMENT PURPOSES ONLY, NOT FINANCIAL ADVICE!
trendanalysis, trendtrading, priceaction, priceactiontrading, technicalindicators, supportandresistance, rangebreakout, rangebreakdown, rangetrading, chartpatterntrading, chartpatterns, smci, supermicro, supermicrocomputers, audit, failedaudit, passedaudit, smciearnings, smciaudit, smciearningsreport, smcianalysis, smcitrend, smcipattern, smciprice, smcitrade, smciidea, supermicrotrend,
