How to Trade Liquidity Sweep in Forex Market (SMC Trading)
I will show you a real example of trading liquidity sweep with Smart Money Concepts.
You will learn the essential SMC liquidity basics, a simple and profitable strategy to identify and trade liquidity sweep.
I will share with you an accurate entry confirmation signal that works perfectly on any Forex pair.
Liquidity Basics
In order to trade liquidity sweeps profitably, you should learn to identify significant liquidity zones.
To spot them, analyze a historic price action and find clusters of important historic key levels.
Examine a price action on EURUSD on an hourly time frame.
I underlined multiple horizontal key levels.
The price respected each level, found support on them, and rebounded.
What is so specific about these levels is that they are lying close to each other, composing a liquidity cluster.
That fact that EURUSD strongly bounced from these levels suggests that buying interest and high buying volumes were concentrated around them.
We can unite these levels and treat them as a single demand zone that has just been broken and turned into a supply zone.
After we found a valid liquidity zone, we can look for a liquidity sweep.
First, we should let the price approach that area and look for a specific price behavior then.
That is a perfect example of a liquidity sweep.
You can see that the price formed a wide range candle with a long tail.
Its high went way beyond the underlined area, but its body closed within.
In order to understand, why a liquidity sweep occurred, let's zoom in our chart and try to understand a behavior of the market participants.
Our supply zone concentrated selling orders , we assume that sellers were placing their orders across its entire length.
Their stop losses were presumably lying above that area.
Smart Money know that and with a liquidity sweep they manipulate the market, making sellers close their positions in a loss (buying back their positions from the market) and providing a liquidity for big players.
After a formation of a such a candlestick, a reliable confirmation of a saturation of the Smart Money is a formation of a strong bearish candle - a clear sign of strength of the sellers.
A bearish engulfing candle above confirmed a completion of a liquidity sweep and indicates a highly probable bearish continuation.
Your perfect sell entry is immediately after a close of such a candlestick.
Stop loss should strictly lie above the high of a liquidity sweep.
Take profit is based on a local low.
Look, how quickly the price reached the goal.
Your strategy of trading liquidity sweeps of demand zones is absolutely the same.
Let the price test a demand zone, wait for a formation of wide range bearish candle with a tail going below its lows.
Wait for a bullish imbalance candle and buy immediately then.
Stop loss will be below the low of a liquidity sweep, take profit - a local high.
This SMC strategy works on any time frame and can be applied for trading any Forex pair, Gold, Silver, Crypto and commodities.
Try it by your own and let me know your results.
❤️Please, support my work with like, thank you!❤️
I am part of Trade Nation's Influencer program and receive a monthly fee for using their TradingView charts in my analysis.
Smctrading

EURGBP Market Structure Analysis on 4H and M15 Timeframes4H swing is bearish => current is pullback
M15 swing is bullish
We can look for short selling opportunities if the bottom of M15 is broken

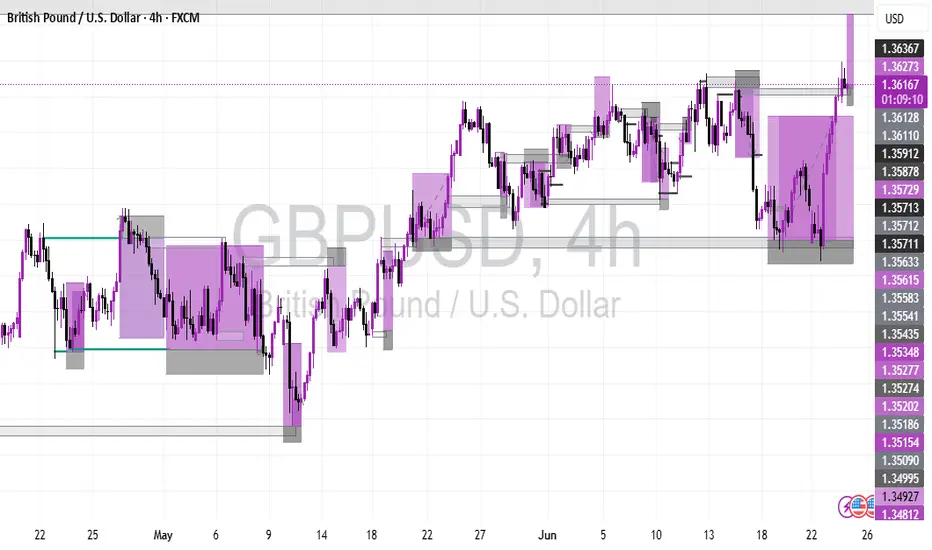
Nothing more beautiful than thisgbpusd has shown an uptrend for the past few months, did you get the picture?
Bitcoin– bearish momentum builds after rejection at $109KIntroduction
Bitcoin (BTC) is currently showing weakness after forming a lower high at $109,000. This level acted as a significant point of rejection, and since then, BTC has been moving lower. The price has broken through key support areas, indicating a possible shift in market structure. In this analysis, we’ll break down the recent price action, explain the technical signals behind the move, and discuss what could be expected in the short term.
Rejection from the 0.786 Fibonacci Level
The rejection at the $109,000 level aligns perfectly with the 0.786 Fibonacci retracement on the 4-hour timeframe. This level is often seen as a strong resistance point during corrective moves, and in this case, it held firmly. The precision of this rejection gives it more weight, and since hitting that point, BTC has been steadily declining. This move down suggests that buyers were unable to push through the resistance, leading to increased selling pressure.
Break of the 4H Bullish FVG
As BTC started its decline from $109,000, it broke through the bullish Fair Value Gap (FVG) that had formed earlier on the 4-hour chart. This gap previously served as a support zone but has now been decisively broken with strong volume. The loss of this level is significant, as it marks a breakdown of the bullish structure and opens the door for further downside movement. In the process of this move lower, BTC has created a new bearish FVG on the 4-hour timeframe. This gap remains open and could potentially act as a magnet for price to revisit, offering a possible short entry if price retraces into that zone. However, the clear break below the previous bullish FVG indicates a shift in momentum and supports a more bearish bias for now.
Downside Target at $102.7K
Given the recent breakdown, the next key level to watch is around $102,700. This area marks the wick low on the 4-hour timeframe and stands out due to the size and sharpness of the wick. Such large wicks often leave behind unfilled orders, which markets tend to revisit over time. The presence of these resting orders makes this level a likely target for the ongoing move down. It also acts as a strong area of potential support, where buyers might step back in if the price reaches that point.
Conclusion
With the rejection from the 0.786 Fibonacci level and the failure to hold the bullish 4H FVG, BTC has shown clear signs of weakness. The breakdown in structure suggests a continuation to the downside is likely, with $102.7k being the most immediate target. This level could serve as a strong support zone due to the unfilled orders left behind by the previous wick. Until BTC reclaims key support levels or shows a shift in momentum, the bias remains bearish in the short term, and traders should remain cautious while expecting further downside.
Thanks for your support.
- Make sure to follow me so you don't miss out on the next analysis!
- Drop a like and leave a comment!

DXY: US dollar To Drop Further Around 95?The US dollar has been steadily declining since the new president was elected in the USA. This decline has been accompanied by the ongoing trade wars. Numerous economic indicators have supported this trend, and we anticipate further depreciation in the coming days or weeks. Before trading, it’s essential to conduct your own analysis and gain a comprehensive understanding of the market.
We wish you the best of success in trading. Good luck and trade safely.
Like and comment for more, and as always, happy trading!
Team Setupsfx_

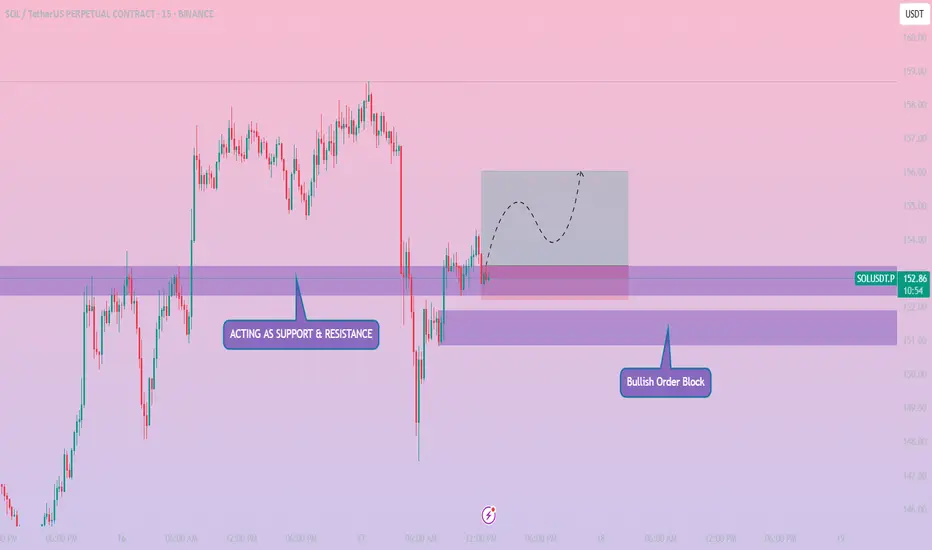
SOLUSDT // 15M // LONGPrice tapped into a previous support zone which is now acting as support & resistance flip, showing early signs of a bullish structure shift.
Just below, a clearly defined Bullish Order Block between ~151.00 and 152.20 is providing institutional demand, which strengthens this zone further.
The current entry sits slightly above this confluence, giving a high-probability long setup.
📈 Expected Price Path: Anticipating a possible liquidity grab, internal pullback inside the grey box, followed by continuation toward target liquidity around 156.00+.
🔹 Entry: 153.23 (Market Execution)
🎯 Take Profit (TP): 156.02
🛑 Stop Loss (SL): 152.22
📊 Risk-Reward Ratio (RRR): ~1:2.53
Week of 6/15/25: EU AnalysisEU continues to have clean market structure and has all time frames aligned for bullish movement. Looking for price to retrace to the prime 1h POI for an A+ setup.
Major News:
FOMC - Wednesday

Week of 6/15/25: AU AnalysisLast week took the prior week's high and showed large rejection. Expecting this week to take the weak low and liquidity from all the lows to at least the extreme of the daily swing.
Major news:
FOMC - Wednesday

XAUUSD: +1500 TO +2200 PIPS Major Swing Move in Making, Two AreaThe first day of the trading week has seen Gold skyrocket, clearly indicating a bullish price direction. Our recent analyses had clearly shown this, and the volume confirms further bullish momentum. Additionally, the NFP news this Friday will be a trend changer, regardless of its positive or negative impact on the USD.
There are two potential take-profit targets. Before taking entry, please conduct your own analysis.
Good luck and trade safely,
Team Setupsfx_

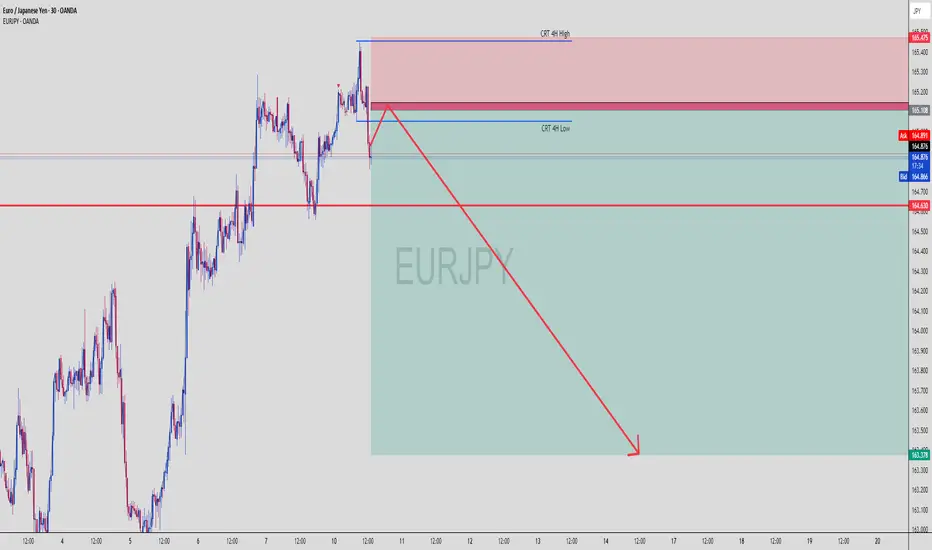
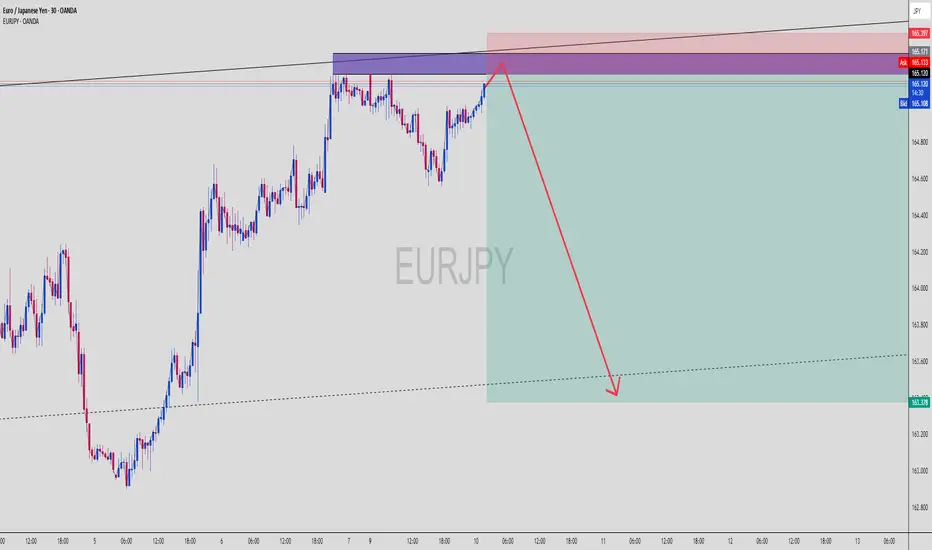
EURJPY Tapped 4H Supply – Massive Drop Loading?EURJPY | 30-Min View with 4H CRT Zones
🔥 This is where Smart Money sharpens their blades…
🧊 New Confluence Just Dropped:
🔴 CRT 4H High Zone: 165.108–165.475
Price wicked right into the 4H Compression Reversal Top (CRT) — ideal Smart Money trap zone
This area aligns perfectly with the bearish OB/supply from previous screenshot
🔵 CRT 4H Low Zone: Around 164.630
Strong structure level where liquidity is sitting
Price respected it as temporary support before likely break-and-retest continuation
🔍 Price Action Logic:
✅ Price faked out above CRT 4H High, grabbing liquidity
✅ Immediate rejection candle with wick rejection signals institutional selling
🔁 Now price is retesting the mid-OB / lower CRT, likely forming a breaker pattern
🟥 Huge clean imbalance to the downside — marked by that juicy green TP box
🔽 Expectation: price fills inefficiency and heads to 163.378 minimum
🎯 Trade Parameters:
🔻 Entry Zone 165.100 – 165.397 (Red Supply / CRT High)
🛡 SL Above 165.475 (CRT 4H High)
🎯 TP Target 163.378 (bottom imbalance fill)
⚖️ RRR Over 1:4 potential — high precision entry zone
🧠 Chart Ninja Analysis:
“When CRT zones align with OBs and liquidity sweeps,
that’s a Smart Money feast waiting to happen.” – 🥷
This chart is a classic reversal blueprint. If you missed the first tap — wait for the retest. If this holds below CRT Low (164.630), expect full bearish momentum into midweek.
📊 Confirmation Tactics:
🔄 M15 bearish engulfing / shift in structure after tap into CRT
🔻 Break of 164.630 = confirmation of bearish intent
⏳ Optional: use FVG + volume spike as further entry triggers
🚨 Save this chart — it's one of those sniper moments where everything aligns!
EURJPY Supply Tap! Bearish Reaction Coming?EURJPY (30-Min) | Supply Zone Hit + Bearish Reversal Setup
This EURJPY move is brewing into a classic SMC bearish play — engineered liquidity run, supply zone reaction, and a projected melt to imbalance below. Let’s dissect the ninja logic 🧠📉
🔍 Breakdown of the Setup:
🟥 Supply / Order Block Zone
Price enters a strong bearish OB zone between 165.100–165.397
Previous rejection wicks in this zone = smart money sell interest
Price now testing that area again — potential for liquidity sweep + reversal
🟪 Multi-Zone Confluence
Multiple overlapping zones stacked: OB, mitigation block, and liquidity sweep area
Perfect spot for Smart Money to unload positions before sending price lower
📏 Risk-Reward Optimization
Entry near 165.100–165.397 zone
Stop Loss placed slightly above the last rejection wick (above 165.397)
Take Profit projected around 163.378 based on measured impulse leg and imbalance fill
🧠 Liquidity Narrative
The rally into supply is likely a buy-side liquidity hunt
Smart Money often drives price into key zones before triggering reversals
Price may wick above 165.171 to fake bulls before a strong sell-off
🧠 Chart Ninja Entry Plan:
🔻 Entry Zone 165.100 – 165.397 (Supply OB)
🛡 SL Above 165.450 (above wick / last structure high)
🎯 TP Target 163.378 (imbalanced fill target)
⚖️ RRR Approx. 1:4+ depending on entry precision
🥷 Chart Ninja Note:
“The trap is always set where the crowd feels the safest —
and that’s exactly where the ninja strikes.” 🥷📉
This setup could be a clean ride down if price reacts as expected. Confirmation entry = bearish engulfing on M15 or M30.
🔁 Bonus Observation:
You can see lower timeframes building internal liquidity, meaning we might get a sharp, volatile drop once that top wick finishes sweeping.
📍Mark this zone and set an alert — entry can trigger fast!
🔥 What’s your confirmation style — engulfing candle or breaker structure?
Week of 6/8/25: EU AnalysisPrice has reached the extreme of daily bearish structure and we can see a rejection of the 4h latest push to make another high. We're following 1h internal bearish structure to at least take out the weak low, thus making 1h structure bearish and following that to the 4h extreme swing low.
Major news:
Core CPI - Wednesday

Week of 6/8/25: AU AnalysisLast week swept the high of the prior week and immediately got rejected. We are expecting that the low that swept the high is weak on the HTF and will be following 1h internal structure bearish until the low is at least taken out.
Major news:
Core CPI - Wednesday

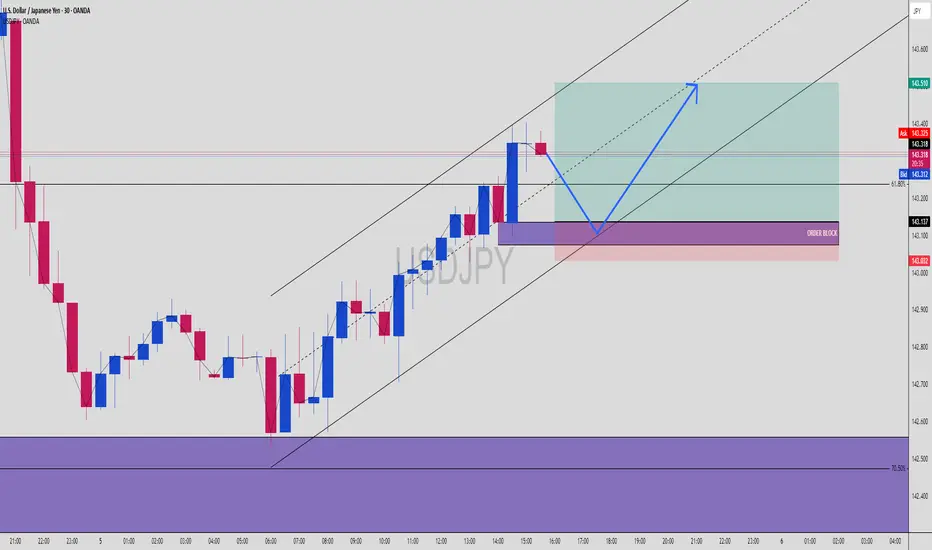
USDJPY Buy Setup! OB + 61.8% Fib + Trend Channel ConfluenceUSDJPY | 30-Min Chart – High Probability Buy Setup in Progress
USDJPY is currently respecting a bullish market structure within a well-defined ascending trend channel. Smart Money Concepts (SMC) traders are watching for a precise reaction at the confluence of a key Order Block (OB), Fibonacci retracement levels, and mid-channel support.
🔍 Trade Breakdown:
Bullish Market Structure
Price has shifted from bearish to bullish after forming a key higher low and continuing with higher highs within the trend channel. The structure is being respected with multiple taps on both upper and lower channel boundaries.
Internal Liquidity & Order Flow:
Price previously swept sell-side liquidity below the recent swing low and sharply reversed, confirming internal liquidity engineering and institutional involvement.
Currently, we’re seeing price stall after rejecting the upper channel and OB zone. A retracement into the discount zone is anticipated before continuation.
🟣 Order Block Zone (OB): 143.032 – 143.137
A clear bullish OB formed after a strong impulsive move, marking the last down candle before the bullish break of structure.
Located just above the 61.8% Fibonacci level — strong confluence.
📐 Fibonacci Levels from Last Swing Low to High:
61.8% = 143.137
70.5% = 143.032
Potential reaction zone aligns perfectly with OB + trendline + psychological round level (143.000 area)
📊 Buy Setup Expectation:
USDJPY is expected to retrace into the OB/Fib confluence zone before a bullish continuation toward the upper boundary of the trend channel and beyond.
🔵 Projected Path:
Price dips into OB → reacts to 61.8–70.5% retracement → bullish reversal → break to fresh highs near 143.510 or higher
🧠 Chart Ninja Entry Plan:
🔹 Entry Zone: 143.032 – 143.137 (OB + 61.8–70.5% Fib)
🔻 SL Below: 143.000 (beneath OB and psychological level)
📈 Target: 143.510 (channel top + previous supply zone)
⚖️ RRR: Approx. 1:3+ — high precision Smart Money entry
💬 Ninja Wisdom:
Patience before profit. Wait for price to return to the zone where institutions left footprints — the OB at equilibrium pricing. Combine OB + Fib + channel and you're trading like the banks.
Retail buys the breakout. Smart Money buys the pullback. 🥷📚
📍 Save this chart before the setup triggers!
🧠 Do you see the same confluence? Comment your entry/TP/SL plans ⬇️
👣 Follow @ChartNinjas88 for more sniper setups on major FX pairs every session!
EUR/USD - After taking the highs, are the lows next?The EUR/USD currency pair is moving between two important price levels. The top level is 1.1454 and the bottom level is 1.1357. This means the price is staying inside a range. Yesterday, the price of EUR/USD went above the top level of 1.1454. By doing this, it triggered many stop-loss orders from traders who were expecting the price to go down. These traders had placed their stop-losses just above this level, and the market moved up to take them out.
Current support of the 1H FVG
Now, the price is starting to go down again. It is getting closer to the lower level of the range, which is around 1.1357. There is a chance that the market will go below this level as well. If that happens, it may take out the stop-loss orders of traders who are expecting the price to go up. These traders often place their stop-losses just below the low point of the range. When the market goes below the low, it collects liquidity. In simple words, it grabs the orders that are waiting there.
Looking at the chart, we can see that EUR/USD has found some support at the 1-hour Fair Value Gap (1H FVG). This area is acting like a short-term floor for the price. If a full 1-hour candle closes below this support area, then the price will likely fall further. In that case, it may reach the bottom of the range and possibly move below it to take out more stop-losses.
Why below support?
But why would the market go below the low on purpose? The reason is that many retail traders, those are small traders who trade from home, often put their stop-losses just below the recent low. If the market moves there, it activates those stop-losses. These stop-losses are usually sell orders, and when they get triggered, it gives the market extra selling power. After collecting this liquidity, the market often uses the new buying interest (from other traders entering long positions) to push the price back up again.
Conclusion
So in summary, the EUR/USD is still inside a range. It has already moved above the top to take out stop-losses, and now it might go below the bottom to do the same. After that, there could be a strong move upward, powered by the new liquidity in the market.
Disclosure: I am part of Trade Nation's Influencer program and receive a monthly fee for using their TradingView charts in my analysis.
Thanks for your support.
- Make sure to follow me so you don't miss out on the next analysis!
- Drop a like and leave a comment!

XAUUSD Short idea for todayWe are now in an bearish imbalance in 4H TF and now looking for break of structure on m15 to validate the idea to short as per the chart, still waiting for confirmation in the form of break of structure or 15m imbalance.

#DOTUSDT: Targeting $50 By End Of The Year! Wait For Volume ? Hey everyone!
So, about DOTUSDT, it’s been trading sideways at $4 lately. However, it has the potential to break through and hit new highs in the coming weeks or months. We’re not sure exactly what will happen next, but once it does, we expect it to start distributing its value. If this happens, we could see it reach our $50 mark by the end of the year.
I know this is just our speculative view, and we can’t rely solely on technical analysis to make this happen. We also need strong fundamental support. But hey, it’s worth a shot, right?
If you like our work, please give it a like and let us know what you think in the comments. We’d love to hear your thoughts!
Wishing you all the best and happy trading! 😊
We really appreciate your unwavering support! ❤️🚀
And if you’d like to lend a hand, here are a few ways you can contribute:
- Give our ideas a like
- Share your thoughts in the comments
- Spread the word about our ideas
Cheers,
Team Setupsfx_

EURCAD's Triangle Hints Drop AheadThe correction looks like a contracting triangle, which is a common pattern in Elliott Wave theory. This kind of triangle usually forms during wave B or wave 4. It includes five smaller waves labeled A, B, C, D, and E, which move within two sloping lines that get closer together. There is also a demand zone marked in red on the chart.
Triangles often show a pause in the market before the price continues in the same direction as before. In this case, the triangle suggests that once wave E is complete, the price may drop again to finish wave C. The expected target area is between 1.54900 and 1.54320. This outlook remains valid as long as the price stays within the correction channel.

Week of 6/1/25: EU AnalysisEU 1h and 4h structure are bearish, but there was a large rejection of the daily CHoCH last week leading to large bullish price movement. Our 1h internal structure is bullish, so we will follow that trend for now.
Major news:
PMI - Monday
PMI/ADP NFP - Wed
Unemployment Claims - Thurs
NFP/Unemployment rate - Friday

Week of 6/1/25: AU AnalysisA lot of consolidation from the prior week, all time frames are technically bullish and internal 1h structure is bullish. I am going to be cautious around the current level until there is a prime entry model to get in long.
Major news:
PMI - Monday
PMI/ADP NFP - Wed
Unemployment Claims - Thurs
NFP/Unemployment rate - Friday

BTCUSD Trendline Trap? Smart Money Short at FVG
🔍 1. Trade Idea Summary
Trendline gets violated ➝ retail panic
Price retests Fair Value Gap at a premium level
Confluence:
✅ Trendline break liquidity
✅ FVG mitigation
✅ Bearish order block zone
✅ Lower high structure formation
Targeting the weak low sweep around $100,773.
📊 2. Key Chart Levels
Entry Zone: $104,800 – $105,200 (FVG)
Stop Loss: Above $105,209
Take Profit: $100,773 (Weak Low / Sell-side liquidity)
RR: ~1:3+, textbook sniper setup
🧩 3. Smart Money Concept Breakdown
Trendline Break = Liquidity Grab
Price taps into a premium zone FVG + OB
Expecting:
Rejection candle formation
Lower time frame BOS
Sell-side liquidity target @ weak low
This is a setup you can replay again and again — pure institutional footprint.
⚙️ 4. Execution Plan
Monitor retest reaction near FVG zone
Look for M5 or M15 bearish BOS/CHoCH
Refine entry on confirmation
Lock partials near midpoint, TP at weak low sweep
⚔️ 5. Pro Tips:
Trendline breaks are often traps — always check where the liquidity hides
FVGs act like magnets — price often returns to fill the imbalance before real moves
Volume dying into FVG = 🔥 clue for rejection
📉 Comment "BTC Trap Sniper 🎯" if you saw this setup too
🔁 Save this chart for future reference
⚔️ Follow @ChartNinjas88 for more SMC breakdowns & fib-paired traps

XAUUSD Sideway in Price range?Long entry: 3280 - 3290
SL: 3273
TP: Daily Open Price, 1.5R:R
Short entry: Supply Zone or Caution message
SL: 3360, Upper Swing
TP: Lower Low, 2 R:R

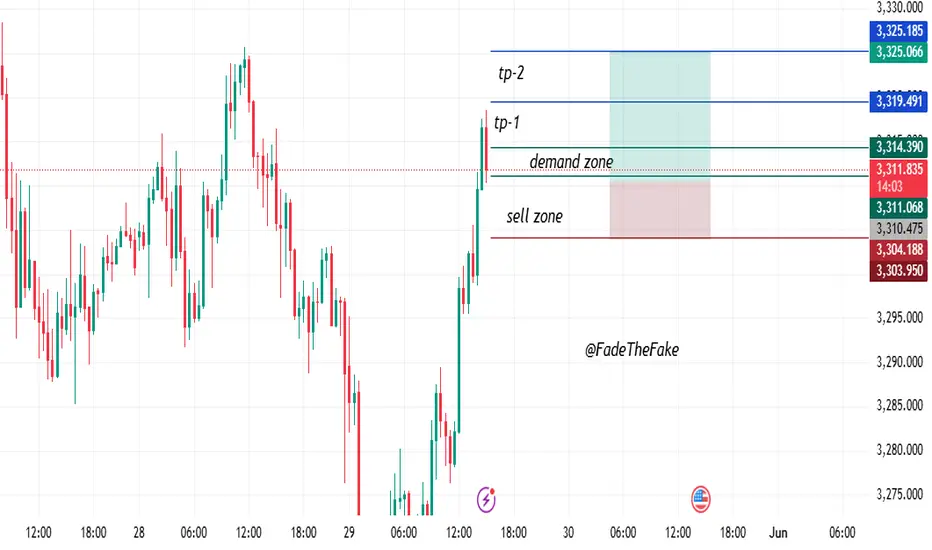
“Clean SMC Buy Setup | Retest & Rally from Demand Zone”This chart shows a clean Smart Money Concept (SMC) style buy-side setup, targeting a highly respected demand zone and high-odds liquidity grab above.
Following a steep bullish impulse, price formed a new market structure shift (BOS) and is now retracing into a crucial entry zone at 3,314.00 – 3,311.50. This area is marked by a hidden order block and imbalance, with high R:R opportunities for buyers.
The stop loss is judiciously set below the latest wick at 3,304.40, safeguarding against manipulation while having the best risk exposure.
The target one (TP1) is at 3,319.70, corresponding to intraday liquidity and recent supply reaction. The second target (TP2) goes up to 3,325.90, a major high where external liquidity would most likely be absorbed before any major change.
This is on the basis of:
A confirmed bullish BOS
Demand zone + OB alignment
Imbalance + inducement layer barely underneath the entry
No indication of bearish turn yet
We expect retest of demand and a move on to liquidity, given the zone is sustained and no bearish BOS is witnessed.
???? Trade Parameters:
Entry Zone: 3,314.00 – 3,311.50
SL: 3,304.40 (below OB)
TP1: 3,319.70
TP2: 3,325.90
Bias: Bullish (scalp-to-swing)