Wave structure of DXY analyzed in multiple time framesDay uptrend -> correction
4H dowtrend -> impulse
5M/15M dowtrend -> impulse
We can only buy when the strong swing of the 5M time frame is broken
Smctrading

Wave structure of XAUUSD analyzed in multiple time frames4H is uptrend => current is correction
15M is dowtrend => current is conrrection
5M is uptrend => current impulse
We can only sell down when the Swinglow of the 5M time frame is broken through

Wave logic analysis of multi-timeframe DXYDay is uptrend -> current is correction
4H is dowtrend -> current is impulse
5M/15M is dowtrend -> current is impulse
Wave 5M/15M reversal increases when the reversal peak is broken. Then the 4H wave is a corrective wave, the price increases back to the Swing High level of the 4H time frame.
If the high of the 4H timeframe is broken, the price will rise back to the swing high of the daily timeframe.

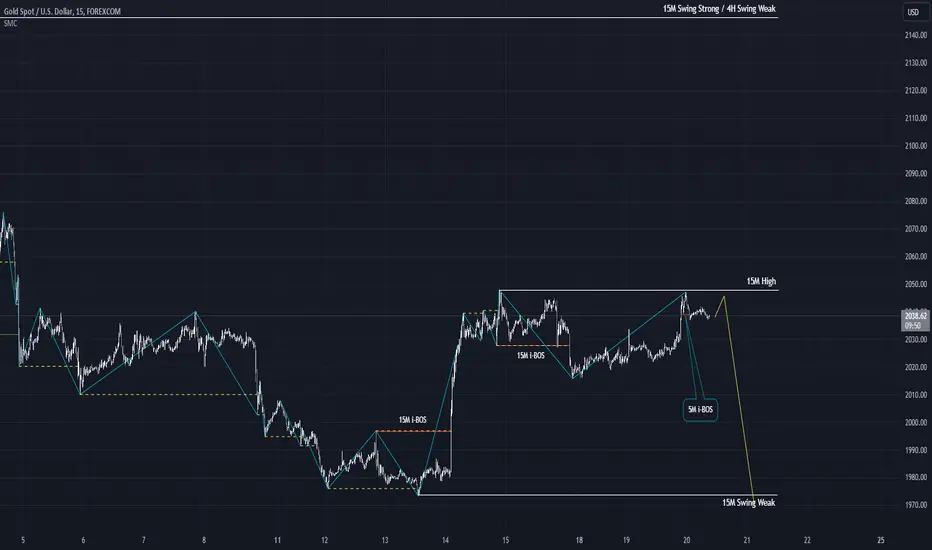
XAUUSD wave structure in 15M timeframe- 4H time frame uptrend
- 15M time frame downtrend => currently pullback up
- 5M time frame downtrend => current pullback up
- The price dropped and broke through the bottom of 5M, creating an i-BOS signal signaling the end of the pullback wave of 5M.
- The 15M and 5M time frames end the pullback wave, with a high possibility that the price will fall to the weak swinglow of the 15M time frame.
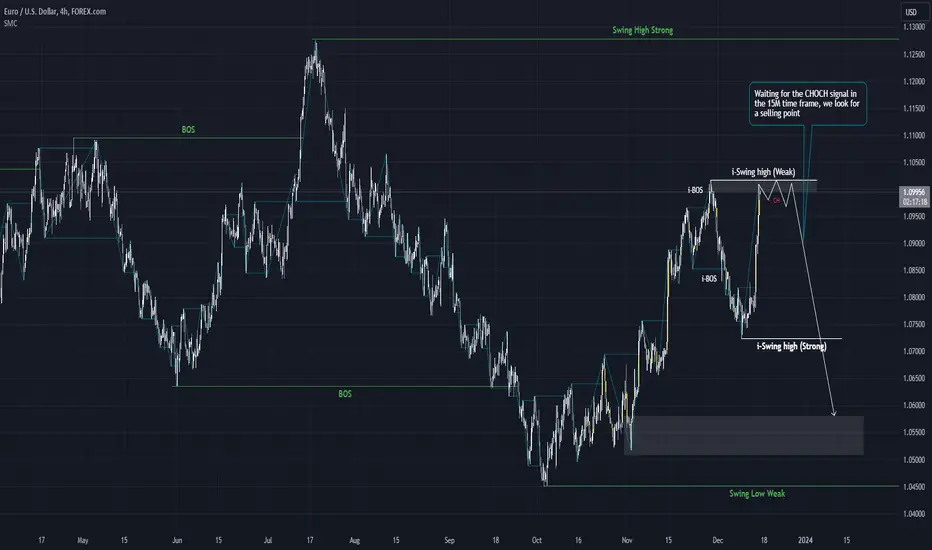
EURUSD waves in the 4H timeframe are analyzed using SMCThe wave of the 4H time frame is in a downtrend
The current wave is a pullback wave
Waiting for the 15m wave to end, we look for a selling point
GPBUSD wave structure in 4H time frameGBP in the H4 time frame is in an uptrend. Currently in the pullback wave, we wait for the signal to break the CHOCH position. It signals that the pullback wave may end, then we will wait to buy.

Flips That Sweep LiquidityREACTION SWEEP
Flip create + sweeps high
REACTION EQLs SWEEP
Flip crates + sweeps equal highs
FLIP SWEEPS PRIOR LEG
Flip sweeps high in prior leg
FLIP GETS SWEPT
Intial Flip reaction gets swept

GBPUSD → 4H Bullish Continuation SETUP (SMC ANALYSIS)We are closely monitoring a potential buying opportunity around the POI zones.

Wave structure of DXY at 4H time frameDay uptrend -> pullback dow
4H dowtrend -> pullback up
15m dowtrend -> pullback up
If the 15M, 4H time frame changes to an uptrend, the price will increase sharply to the Swinghigh level of the daily frame.

High & Low Resistance LiquidityLOW RESISTANCCE LQ
1.No liqidation
Available SSLQ generated at weak low = low resistance lQ
2. Price is more likely to pullback to the nearest POI
3. high resistance LQ left at new strong high
4. price will move impulsively past low resistance lows to target available SSLQ
HIGH RESISTANCCE LQ
1. Strong liquidation
Signals potential institutional backing
Leaves high resistance LQ
2. Often price will then pull back much deeper (or potentially reverse)
3. The end of the pullback often forms through a liquidation, leaving high resistance LQ at what then becomes the new strong / protected high
4. Price meets some resistance at the sweep zone to the left rather than smashing straight through the weak lows when there's low resistance LQ

GBPUSD wave structure in 4H time frame-The daily timeframe is in a downtrend, currently a bullish pullback wave
-The 4H time frame is in an uptrend, currently a bearish pullback wave
-15M time frame is in an uptrend, currently a bearish pullback wave
-15M and 4H have the same downtrend.
-If the Swing Low of the 15M timeframe is broken. We look for opportunities to sell down

BTC wave structure 4H time frameBTC wave structure 4H time frame
The 4H time frame is currently a pullback wave
The 15M timeframe is in a downtrend.
The 5M time frame is the pullback wave of the downtrend
We only have a chance to buy when the 5M time frame turns to an uptrend


GBPUSDAs a student in the financial markets, learning about the market is interesting and it's a long journey to begin with. GBPUSD having a accumulation, manipulation and now waiting for a distribution. Will GBPUSD make a move early next year along side with USA rate cuts? Let's see what year 2024 lead us to
I don't post much as I'm not a signal provider nor a financial advisor. But one thing is that learning how the market behaviour, reactions and structure, it's simply interesting to me. If you have any thoughts on GBPUSD, let me know down the comment area, let's discuss about it.
This will be my last post and trade of the year 2023 holding it till next year 2024. Wishing you guys out there trade safe and happy new 2024.

Trading logic in multiple time frames of the SMC methodAfter the price breaks through the Swinghigh of the large time frame to create a BOS signal
We look for sell down or buy up signals according to the following structure:
Swing high(Weak) H4 => 1/5M pullback => break Swinglow 1/5M => 15M pullback => break Swinglow 15M => Pullback 4H => Order block 4H=> Pullback 1/5M => break Swinghigh 1/5M => Pullback 15M => break Swing 15M = > Pullback 4H => break Swinghigh 4H => Create new Swing High (Weak) and Swing Low (Strong)

Gold's wave structure in the 4H time frameThe 15M timeframe is in a downtrend.
We wait for the 15M pullback to end and the price to drop to the strong Swinglow of the 4H timeframe

The wave structure of gold on the 15-minute timeframeThe 4-hour timeframe is currently in a pullback phase.
The 15-minute timeframe is currently in a downtrend.
1-minute chart for (CHoCH) signal.
The price may exceed the peak of the previous 15 minutes to get liquidity and then fall deeper

Wave structure of gold in the 15M time frame analyzed by the SMThe wave structure of gold in the 15M time frame is analyzed using the SMC method
At frame 15M, the price broke through the Swinglow, creating a BOS signal and shifting to a downtrend.
In the 4h frame, the price broke the i-Low bottom, creating a CHOCH signal
Wait for the price to increase back to the OB block in the 4h time frame, then wait for 15M to have a CHOCH signal so we can sell down.
SH: Swing High
SL: Swing Low
i-Low: Internal Low
i-High: Internal High
i-BOS: Internal BOS

XAUUSD wave structure in 4h, 15M timeframe4H is pullback
15M is down trend
1M is down trend
When 1M surpasses Swinghigh, 1M reverses the uptrend and 15M begins a recovery wave.

BTC on the 4-hour chart has shifted to an upward trendBTC has broken the 4-hour swing high, indicating a change to an upward trend. It is expected that BTC will continue to rise towards the supply zone within the daily timeframe

HIGH LEVEL TRADE PLANHIGH LEVEL TRADE PLAN
HTF Objective -> MTF POIs -> LTF Execution
(Precursor to introducing LQ concepts)
Narative - PT run or CT pullback phase - signals when MTF may change trend
Immediate bias and POIs - fullfills HTF objective
Execution for MTF POIs/ideas
Always start on HTF for overall directional bias
Work your way down for timing & increased refinement
Look for the exchange in supply & demand to see who is in cotrol
1. HTF is bullish
Consider long continuation from MTF POIs following MTF structure but be aware HTF pullback can start
Quick targets
2. After HTF BOS, expect HTF Swing pullback
- Mitigation of HTF supply
- HTF CHoCH/i-BOS
- Target HTF demand in discount
3. You must wait for a MTF POI mitigation before looking for LTF entry model,
otherwise wait for MTF CHoCH/i-BOS to form fresh MTF POi.
The latter is recommended when trading counter + OF
4. Trade pro MTF OF into HTF discount demand
MTF objective - HTF pullback
5. Don't buy weak lows
6. Cautious with shorts in HTF discount
7. Extrem HTF + stacked MTF demand mitigated
last area that needs to hold price if HTF bullish Swing trend is to continue
So you may want to be more aggressive looking for long setups
8. OF now bullish. Supply just provides pullback
9. All time frame now aligned to target weak HTF high following HTF intentions

Gold's wave structure at 15m timeframe analyzed using SMCGold does not increase to break the peak but continues to decrease to create a peak.
We need to be careful that gold will increase and then break its peak to rebalance the market before falling deeper

EURUSD wave structure at 15M timeframe analyzed as SMCAfter breaking above the Swinghigh to the Oderblock (OB) area of the 4-hour time frame, the price dropped to break the Swing low, forming a new strong Swinghigh top structure.
Thus, there is a high possibility that prices will continue to decrease
