FINALLY SOME SENTIMENT AFTER FED FUND RATES!! BULLISH DXY BABY!Want to see the dollar trade higher and all foreign currency Pairs to trade lower. After new release price is really starting to show us its hand making it easier for us to look for a bias.
Smctrading

Simple Break of Structure BoS Trading Strategy Explained
One of the best and reliable strategies to trade break of structure BoS is to apply multiple time frame analysis.
In this article, I will teach you my break of structure gold forex trading strategy. You will get a complete step-by-step guide with examples.
Let's start with a quick theory and let me explain to you what is break of structure BoS in Smart Money Concept SMC trading.
In a bullish trend, break of structure BoS is an important event that signifies a continuation of an uptrend. It is based on a violation and a candle close above the level of the last higher high (HH).
After a breakout, the broken level becomes the first strong support for trend-following buying.
Check multiple examples of confirmed breaks of structure BoS on GBPNZD forex pair on a weekly time frame.
In a downtrend, Break of Structure BoS means a bearish trend continuation . Break of Structure is considered to be confirmed when a candle closes below the level of the last lower low (LL).
The broken key level becomes the closest strong support for buying.
That's the example of a healthy downtrend on USDJPY forex pair on a daily. Each break of structure BoS pushed the prices lower, providing a strong signal to sell.
What newbie traders do incorrectly, they trade break of structure without a confirmation strategy, and it leads to substantial losses.
Though GBPCHF is trading in a bullish trend and though each BoS provided a trend-following signal. The price retraced significantly lower below the broken structure before the growth resumed.
When the price retests a broken structure after BoS in a bullish trend, start lower time frame analysis.
If you identified a break of structure on a daily, analyze 4h/1h time frames.
If on a 4H, then 30/15 minutes.
After the price sets a new higher high with BoS in uptrend, it usually starts trading in a minor bearish trend on lower time frames.
With our strategy, your signal to buy will be a retest of a broken structure and a consequent bullish Change of Character CHoCH . That will provide an accurate bullish signal.
In a bearish trend, analyze the lower time frames after a retest of a broken structure. Your signal to sell will be a bearish Change of Character CHoCH.
Look at a price action on EURCHF on a daily.
We see a strong bullish trend and a confirmed Break of Structure BoS.
According to the rules of our trading strategy, we start analyzing 4h/1h time frames after a retest of a broken level of the last Higher High.
Our signal to buy is an intraday bullish CHoCH. We open a long trade after that with the stop loss below the intraday lows and take profit being a current high.
That's how simple this strategy is.
Multiple time frame analysis provides the extra level of security.
Strong lower time frame confirmation substantially increases the win ratio of a trading setup.
❤️Please, support my work with like, thank you!❤️
I am part of Trade Nation's Influencer program and receive a monthly fee for using their TradingView charts in my analysis.

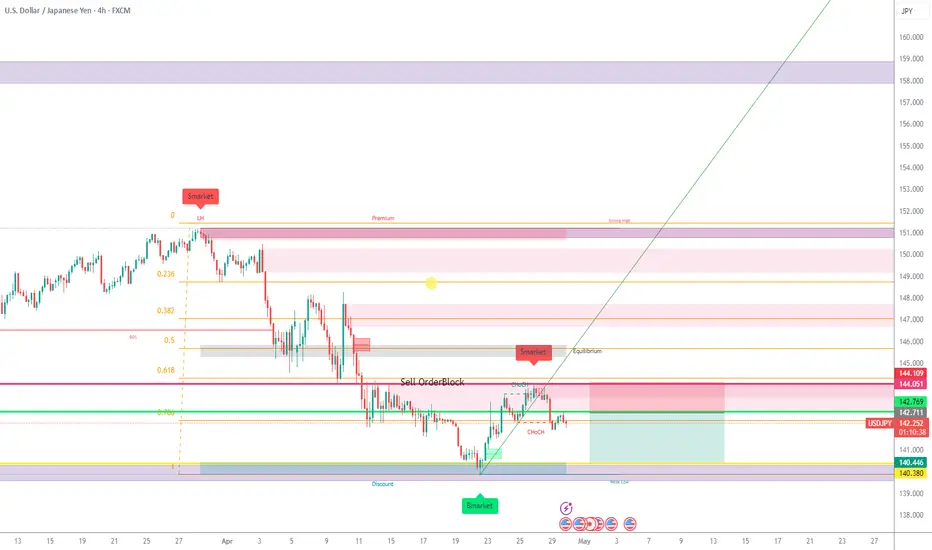
USDJPY Technical Outlook: SMC and Wyckoff Analysis 5 May 2025As of May 5, 2025, the USDJPY pair is trading around ¥144.30, reflecting a 0.40% decrease from the previous session. This movement follows the Bank of Japan's decision to maintain interest rates while revising growth forecasts downward, leading to a depreciation of the yen.
Technical Analysis:
Support and Resistance Levels: The pair is approaching a significant support zone near ¥143.00. A break below this level could expose the next support at ¥141.00, while resistance is observed around ¥148.00.
Relative Strength Index (RSI): The RSI is nearing oversold territory, suggesting potential for a short-term rebound.
Smart Money Concepts:
Order Blocks: A bullish order block is identified between ¥142.50 and ¥143.00, indicating potential institutional buying interest.
Liquidity Pools: Liquidity above the recent highs near ¥148.00 may attract price action if bullish momentum resumes.
Wyckoff Method Perspective:
Accumulation Phase: The recent price action suggests a possible accumulation phase, with the pair trading within a range between ¥140.00 and ¥146.00.
Spring Test: A false breakout below ¥143.00 could serve as a spring, leading to potentially high buying volume.
Fundamental Factors:
Bank of Japan (BOJ) Policy: The BOJ's decision to keep rates unchanged, despite lowering growth forecasts, has contributed to yen weakness.
Federal Reserve Outlook: Market participants are closely watching the ISM Services PMI later today and the upcoming FOMC meeting for signals on US monetary policy, which could impact USDJPY dynamics.
Conclusion:
The USDJPY pair is at a critical juncture, with technical indicators pointing to potential support near ¥143.00. Traders should monitor price action around this level for signs of accumulation or further downside. Fundamental developments, particularly central bank policies, will play a crucial role in determining the pair's direction in the near term.

Week of 5/4/25: EURUSD AnalysisEurusd has been consolidating internally, but has made a final push bearish from Friday NFP. We're looking for a short at the flip zone of the 1h POI, but if it goes past that to the extreme of the internal structure, we will be cautious and wait for a break to switch bullish.
Thanks for stopping by!
Major News:
FOMC - Wednesday
Unemployment - Thursday

Week of 5/4/25: AUDUSD AnalysisAfter a hellish week of consolidation, price has made its move higher (finally) and we're back to a trendy chart.
My analysis the beginning of the week shows 2 POIs that I am interested in for longs, and if it breaks the level that I pointed out bearish, I will look for shorts.
Thanks for tuning in!
Major News:
FOMC - Wed
Unemployment - Thurs

USDJPY: Bullish Trend Reversal?! 🇺🇸🇯🇵
USDJPY formed a strong bullish reversal pattern on a daily,
breaking the underlined daily resistance and confirming
a Change of Character CHoCH.
I believe that the pair will steadily return to a global bullish trend.
The price may grow at least to 147.0 level after a completion of a retracement.
❤️Please, support my work with like, thank you!❤️

USDJPY sell (h4)Price is oversold in the h4 time frame according to the stochastic indicator which mean it is most likely going to pullback into the sell order block or liquidity zone then potentially travel down.
safe entry idea:
wait till price enters the liquidity zone (sell orderblock) and wait for the stochastic indicator to be overbought then enter.
or you could set a pending order for when price touches and rejects the sell orderblock
Good Luck!
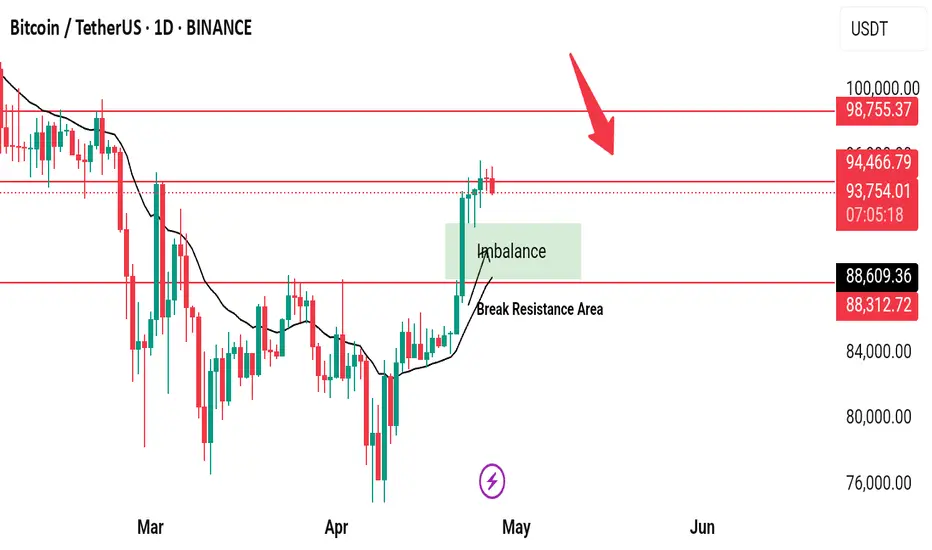
Watching closely $93,900 level.BTCUSDT Weekly Update
Bitcoin has successfully broken through its previous resistance area and is currently testing a new resistance zone. We are closely watching the $93,900 level. If the market provides confirmation of a rejection or reversal at this level, we will consider entering a short position targeting the marked FVG (Fair Value Gap) zone.
This FVG is a bullish imbalance zone, which previously contributed to market momentum. If the price moves lower, we plan to exit short positions near the FVG zone and look for confirmation to enter buy-side trades, aligning with the existing bullish market structure.
Let's closely monitor these levels throughout the week. If price action aligns, we anticipate strong trading opportunities on both sides of the market.
Best Liquidity Grab / Sweep Strategy For Trading Forex & Gold
Learn how to trade liquidity grab / sweep with multiple time frame analysis.
Discover how to combine top-down analysis and smart money concept SMC for trading forex and gold.
You will get a complete step by step trading strategy with entry, stop loss and target.
1. In order to trade liquidity grab / sweep properly, you need to find liquidity zones first.
For this trading strategy, the best liquidity zones will be on a daily time frame.
Check these 2 significant liquidity zones on EURAUD forex pair on a daily.
The zone where the selling activity concentrate will be called a supply zone. While the zone with a strong concentration of a buying activity will be a demand zone.
2. After that, you should look for a liquidity grab / sweep.
For a valid liquidity grab / sweep the daily candle should violate the liquidity zone only with the tail / wick of the candle , while the body should stay within the zone.
Above is the example of a liquidity grab of a demand zone.
While the daily candle closed within the underlined area, the wick went beyond that.
3. After you identified a liquidity grab/sweep, start analyzing lower time frames . For this strategy, the best time frames are 4H and 1H.
On these time frames, you should look for a consolidation and a formation of a horizontal range.
Here is such a range on EURAUD on a 4H.
These ranges will be used for confirmation .
Your bullish signal will be a breakout of the resistance of the range ,
it will confirm a strong buying interest after a liquidity grab.
That is the example of such a confirmation.
4. After that, set a buy limit order on a retest of a broken resistance of the range. Take profit will be the closest strong resistance, stop loss will be below the support of the range.
That is how we trade a liquidity grab/sweep of a demand zone.
With the supply zone liquidity grab trading strategy, you should wait for a bullish liquidity sweep followed by a bearish breakout of a range on a 4H / 1H time frames.
I always say to my students that a single time frame analysis is not sufficient for profitable trading SMC.
A proper combination of multiple time frames is the key to consistent profits.
Following this strategy, you should achieve up to 80% winning rate trading liquidity grabs / sweeps.
❤️Please, support my work with like, thank you!❤️
I am part of Trade Nation's Influencer program and receive a monthly fee for using their TradingView charts in my analysis.

AUDUSD wave structure analysis on 4H, M15 timeframe4H, Day is swing is bearish => Current is pullback
M15 swing is bullish.
We can look for selling opportunities if the wave structure of the M15 timeframe turns bearish.

How Smart Money is Positioning in EUR/USD – 5 Scenarios UnfoldedLiquidity Maps & Trap Zones: EUR/USD 1H Breakdown
EUR/USD SMC Analysis – Scenarios Overview
1. Case 1 – Immediate Pump:
The market may pump directly from the current market price (CMP) and take out the external range liquidity resting above the current highs.
2. Case 2 – 15-Min Demand Reaction:
The market could react to the 15-minute demand zone , showing a bullish response and pushing higher toward the 1H supply zone .
3. Case 3 – Inducement & Distribution:
Combined with Case 2, the market may first mitigate the 15-minute demand , then take out the inducement (IdM ) near the 1H supply zone . From there, distribution may begin within that supply range, leading to a drop toward the discount zone .
This would likely involve a fake breakout to the upside (liquidity sweep), trapping buyers and hitting the stop-losses of early sellers before reversing sharply.
4. Case 4 – 1H CHoCH and Triangle Breakdown:
A Change of Character (CHoCH) may occur on the 1H timeframe directly from the current price, leading to a downside move. This scenario would also break the rising triangle pattern , triggering entries from price action traders and increasing market volatility as liquidity accelerates the move downward.
5. Case 5 – 1H Supply Rejection & Free Fall:
The market may react from the 1H supply zone and reject aggressively, resulting in a free fall all the way down to the previous CHoCH level , confirming strong bearish intent from premium to discount.
Thanks for your time..

Week of 4/20/25: EURUSD AnalysisEU had a crazy week of consolidation last week and it was best to stay out until structure was clearer and had a direction.
My direction this week is bullish since all structure is bullish and we are starting to see that demand is in control. If it isn't, expect the lower level 4H POI to be mitigated and then continue the bull run.
Major News:
PMI - Wednesday
Unemployment - Thursday
Thanks for coming, hope you guys have a great week!

Week of 4/20/25: AUDUSD AnalysisWeekly and daily candles are consecutively bullish with a V-shape recovery to the upside. Looking for longs and especially keeping an eye out for the 1H POI flip-zone that I refined in the 4H POI.
Unless 1H internal structure shifts bearish, I am long ALL THE WAY!
Major News:
PMI - Wednesday
Unemployment - Thursday
Thanks for tuning in, have a great week.

USDJPY (1h) sell updateEarlier this week we had this USDJPY sell setup where price perfectly pulled back into our entry price and even though it's been ranging the trade is now running in profit so if you did take this trade move the stop-loss to break-even (to the entry level) & watch it play out till it hits take profit or you can manually close the trade in profit.

The Ultimate Guide to Smart Money ReversalsLet’s cut to it. Most retail traders get caught chasing moves that were never meant for them. They’re entering late, reacting to structure breaks without context, or fading moves without understanding what’s really happening behind the price.
If you're trying to trade like smart money on the reversal, at the turn then you need to know when the game is flipping. That’s where the Market Structure Shift (MSS) comes in. But not just any MSS. I'm talking about MSS that follow a liquidity sweep and are driven by real displacementnot weak candles, not in consolidation. Real intent. Real shift.
Here’s how I approach it.
What Actually Counts as a Market Structure Shift?
Everyone talks about market structure higher highs, lower lows, etc. But structure breaks alone don’t mean anything. A valid MSS isn’t just about breaking a swing point. It’s why it broke and how it broke that matters.
I only consider a shift valid when three things are in place:
Liquidity has been taken (above a high or below a low).
The shift is caused by a displacement candle that clearly shows urgency.
The move happens with strength, not during chop or consolidation.
If you don’t have all three, it’s just noise.
Liquidity Comes First
Everything starts with a liquidity sweep. That’s the trap.
Price has to reach into a pool of liquidity usually above equal highs, clean swing highs, or below clean lows to grab those orders, and reject. That rejection is key. It shows smart money is offloading positions into retail breakouts or stop hunts.
Without a sweep, I don’t care what breaks. No liquidity = no reversal setup.
So the first thing I do is mark out obvious liquidity levels. Equal highs, equal lows, trendline touches anywhere retail is likely to have their stops sitting. That’s where the fuel is.
Then Comes Displacement
After the sweep, I want to see displacement a sharp, aggressive move in the opposite direction.
Not a weak pullback. Not a slow grind. A real candle that shows intent.
Displacement is always obvious. You’ll get a clean candle, often engulfing multiple others, that breaks structure and leaves behind an imbalance what we call a Fair Value Gap (FVG). That imbalance is the signature of smart money hitting the market hard enough to leave a gap in the order flow.
If the candle’s weak, or if it happens during consolidation, I skip it. Displacement is what separates real reversals from fakeouts.
Here is a clean example of what it should look like.
Confirming the Shift
Once displacement confirms intent, I check if it actually broke structure.
That means:
In an uptrend, I want to see price break a previous higher low after sweeping a high.
In a downtrend, I want price to break a lower high after sweeping a low.
When that happens, that’s your MSS. Price has grabbed liquidity, shown displacement, and broken a key point in the structure. At that point, we’ve got a confirmed shift in control.
Entries, Stops, and Targets
Here’s how I trade it.
After the MSS, I wait for price to pull back into the origin of the move. Usually, that’s going to be one of two things:
The Fair Value Gap (imbalance left by the displacement candle)
Or the MSS line itself (Shown on the example)
Once price comes back into that zone, that’s where I’m interested in getting in.
Stop loss always goes just above the high (for shorts) or below the low (for longs) of the displacement candle that caused the MSS. You’re giving it room to breathe, but keeping it tight enough to protect capital.
Targets are straightforward: go for the next pool of liquidity. That means swing lows (sell-side) if you’re short, or swing highs (buy-side) if you’re long. That’s where price is most likely to be drawn next.
A Clean Bearish Example
Let’s say price is trending up, putting in higher highs and higher lows. Then it takes out a recent swing high liquidity swept.
Immediately after that, a strong bearish candle drops and breaks the most recent higher low. That candle leaves an imbalance behind—perfect.
Now I’ve got:
✅ Liquidity sweep
✅ Displacement
✅ Break of structure
I mark out the FVG / MSS line, wait for price to retrace back into it, and enter the short. My stop goes above the displacement candle high. My target? The next clean swing low. That's the next spot where stops are resting where the market is drawn.
A Few Things to Watch Out For
This method works, but only if you’re strict about the rules.
Don’t take MSS setups in consolidation. Wait for clean, impulsive breaks.
If the shift happens without displacement or imbalance, skip it. It’s not clean.
Be realistic with stops. Tight is good, but don’t choke the trade. Give it the structure it needs.
The biggest mistake I see? Traders jump in too early trying to front-run the shift before displacement confirms it. Let the story unfold. Wait for the sweep. Wait for the candle that slaps the market and breaks structure. That’s your edge.
As shown here, the first "MSS" is invalid and not the A+ setup you're looking for.
Final Thoughts
Trading smart money reversals is about reading intent. You’re not just looking at price, you’re understanding why it moved the way it did.
When you combine a liquidity grab, displacement, and a break in structure, you're aligning with institutional activity. You're trading at the turn when smart money flips the script and leaves everyone else chasing.
This isn’t about trading every break. It’s about knowing which breaks matter.
Keep it clean. Stay patient. Follow the flow.
__________________________________________
Thanks for your support!
If you found this guide helpful or learned something new, drop a like 👍 and leave a comment, I’d love to hear your thoughts! 🚀
Make sure to follow me for more price action insights, free indicators, and trading strategies. Let’s grow and trade smarter together! 📈

Wave structure of EURUSD on 4H, M15 timeframe1H, 4H swing is bullish => Current is pullback
M15 swing is bearish.
We can look for buying opportunities when the wave structure on the M15 timeframe turns bullish.

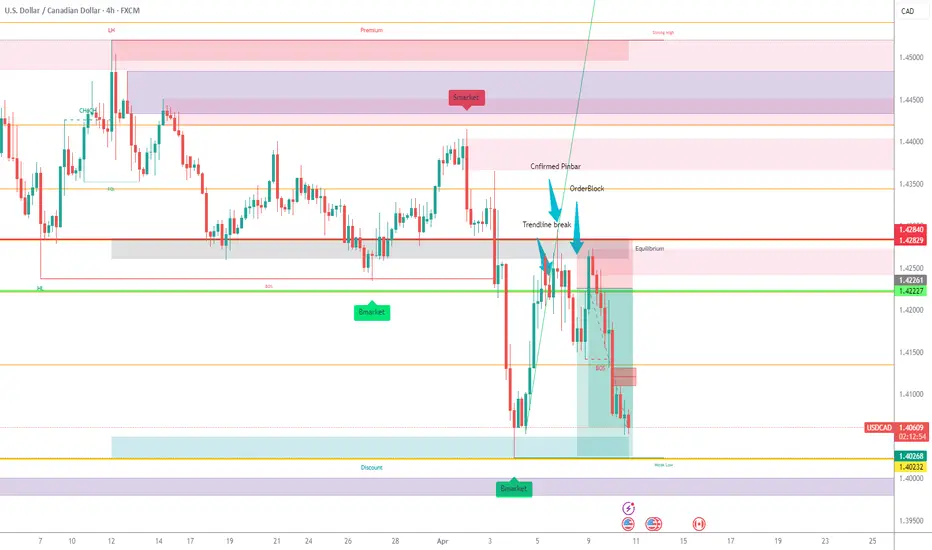
USDJPY (1h) Potential SellAll major time frames indicate this pair will keep going down.
3 point confluences:
1. Created lower highs in both long term & short term tend failing to break the trendlines
2. We've just got a CHoCH (change in character)
3. Sell order block has formed after going sideways for a couple of days which means price is most likely to revisit it before exploding down.
Entry strategy:
Wait for a pullback into the recent sell order block then enter when the stochastics indicator is overbought to help give us a tighter stop-loss.
Alternatively you can set a sell-limit order on the entry price (green line)
Note: price could keep travelling down without doing a pullback
GoodLuck!

Week of 4/13/25: EURUSD AnalysisAll structure is bullish so our bias remains bullish until the MTF (1H) breaks bearish. I have a bullish daily bias that is looking for the Daily supply level above this local high.
Major News: Unemployment Claims - Thursday

Week of 4/13/25: AUDUSD AnalysisDaily bias is bullish, prior week ended bullish with a V shape recovery showing that bulls are in control. As always our MTF internal structure dictates our immediate bias (bullish) and until it breaks, we're continuing our longs.
Price is reaching an important level at the extreme of the HTF supply level so once price gets there, it's good to see what happens next.
Major News: Unemployment Claims - Thursday

XAUUSD market structure analysis on 4H, DAY timeframeDAY Swing is bullish
4H swing is bearish => Current is pullback
There is a high probability that the price will continue to fall
We can look for a selling opportunity if on the 1H timeframe, M15 turns bearish

1Hr scalp sell update2If you took this trade two days as planned congrats because you are now in profit. With high impact news in a few hours you can Trail stop the trade or manually close the trade half an hr or 15mins before the high impact news.
Lets hope it hit TP before high impact news.
1H scalp sell update Our trade from yesterday is playing out as I predicted with price pulling back into the orderblock and rejecting it to move downwards.
We are currently winning this trade. Feel free to move stop loss to breakeven.

Ultimate Guide to Smart Money ConceptsWhat Are Smart Money Concepts?
Introduction:
If you’ve been trading for a while, you’ve probably noticed that sometimes the market moves in ways that just don’t make sense. You’ve got your technical analysis all set, but the market seems to go in the opposite direction. That’s where Smart Money Concepts (SMC) come in.
At its core, SMC is all about understanding how big players in the market (think hedge funds, institutions, and banks) move prices. These players have massive amounts of capital and information, and they don’t trade like the average retail trader. Understanding their behavior can help you see where the market is going next before it happens.
What is Smart Money?
In the world of trading, smart money refers to the institutional investors who move markets with their huge orders. Unlike retail traders, who might be relying on indicators or patterns, smart money trades based on liquidity, market structure, and order flow.
While retail traders are typically reacting to price movements, smart money is the one causing those moves. They’re out there seeking out places where they can accumulate positions or distribute them. The tricky part is that they’ll often make the market go in one direction just to trap retail traders and get them to take positions before flipping it back to where they wanted it to go in the first place.
Key Concepts in Smart Money Trading
1. Market Structure
Market structure refers to the way price moves in a trend. It’s essentially a pattern of higher highs and higher lows for an uptrend, or lower highs and lower lows for a downtrend.
Smart money uses these patterns to their advantage. When they see the market creating a series of higher highs and higher lows, they’ll take advantage of that momentum to push prices further, knowing retail traders will follow along.
But when they want to reverse the market, they’ll push it in the opposite direction, creating a market structure shift or a break of structure, which signals that the trend is over and a new one is starting.
2. Liquidity
Liquidity refers to the amount of orders available to be filled at different price levels. Smart money knows exactly where retail traders are likely to place their stops or buy orders.
They’ll often push the price to these levels, triggering those stops and collecting the liquidity. Once that liquidity is grabbed, they’ll reverse the price and move it in the intended direction.
A common way to spot liquidity is by looking for equal highs or equal lows, where traders often place their stop-loss orders. These are often areas smart money will target.
3. Order Blocks
Order blocks are areas on the chart where institutions have placed big orders. These are key levels that represent where price might return to later, and they can act as areas of support or resistance.
Order blocks are usually found after big price moves. Institutions place these orders to either accumulate positions or offload them, and price often comes back to these levels to fill orders that were left behind.
4. Fair Value Gaps (FVG)
Fair value gaps, or imbalances, are price areas where the market moves quickly, leaving gaps between candlesticks. These gaps represent areas where the market has moved too fast for regular orders to fill, and price tends to return to these levels to fill the gaps.
Smart money knows that these imbalances are critical areas for future price action, and they’ll use them to re-enter the market after a move has been completed.
Why Does Smart Money Matter?
Understanding smart money concepts is like learning to think like an institution. Instead of chasing after price based on typical retail indicators, you start looking for the big moves that smart money is making. You begin to notice when the market is setting traps for retail traders, and how these large players accumulate positions before pushing price in a big way.
With SMC, you stop guessing and start anticipating. By looking for liquidity zones, order blocks, and market structure shifts, you can get in sync with the big players and follow their moves, not fight them.
Conclusion
Smart Money Concepts are all about shifting your perspective. Instead of thinking like a retail trader looking for quick breakouts, oversold/overbought conditions, or chasing trends — start looking at the market as the big players do. Pay attention to where the liquidity is, identify key order blocks, and use market structure shifts to guide your trades.
By learning to spot these key signs, you’ll stop being the one who’s trapped and start being the one who’s in sync with the smart money.
Ready to trade smarter? Keep an eye on those order blocks and liquidity zones — they’re where the real money is made.
Next Steps
- Start practicing by reviewing charts through the SMC lens.
- Keep refining your understanding of market structure, liquidity, and order blocks.
- Stay patient, smart money trades aren’t about quick wins, but about positioning yourself for big moves.
__________________________________________
Thanks for your support!
If you found this guide helpful or learned something new, drop a like 👍 and leave a comment, I’d love to hear your thoughts! 🚀
Make sure to follow me for more price action insights, free indicators, and trading strategies. Let’s grow and trade smarter together! 📈
