Accurate Price Model for Trading Smart Money Concepts SMC (=
If you trade Smart Money Concepts SMC, there is one single pattern that you should learn to identify.
In this article, you will learn an accurate price model that you can use to predict a strong bullish or bearish movement way before it happens.
Read carefully and discover how to track the silent actions of smart money on any market.
The only thing that you need to learn to easily find this pattern is basic Structure Mapping . After you map significant highs and lows, you will quickly recognize it.
This SMC pattern has 2 models: bullish and bearish ones.
Let's start with a bearish setup first.
Examine a structure of this pattern
it should be based on 2 important elements.
The price should set a sequence of equal lows.
These equal lows will compose a demand zone.
The area where a buying interest will concentrate.
The minimum number of equal lows and lowers highs should be 2 to make a model valid.
Exhausting of bullish moves will signify a loss of confidence in a demand zone . Less and less market participants will open buy positions from that.
At some moment, a demand zone will stop holding. Its bearish breakout will provide a strong bearish signal , and a bearish continuation will most likely follow.
This price model will signify a market manipulation by Smart Money.
They will not intentionally let the price fall, not letting it break a demand zone. A buying interest that will arise consequently will be used as a source of liquidity.
Smart money will grab liquidity of the buyers, silently accumulating huge volumes of selling orders.
Once they get enough of that, a bearish rally will start, with a demand zone breakout as a trigger.
Though, the chart model that I shared above has a strong bullish impulse, preceding its formation, remember that it is not mandatory.
The price may also form a bearish impulse first and for a pattern then.
Each bullish movement that initiates after a formation of an equal low should be weaker than a previous one.
So that the price should set a lower high every time after a formation of an equal low.
Look at a price action on USDCHF forex pair. Way before the price dropped, you could easily identify a market manipulation of Smart Money and selling orders accumulation.
A breakout of a horizontal demand zone was a final bearish confirmation signal.
Let's study its bullish model.
It has a similar structure.
The price should set a sequence of equal highs, respecting a horizontal supply zone.
Each bearish move that follows after its test should have a shorter length, forming a higher low with its completion.
This model will be also valid if it forms after a completion of a bearish impulse.
Weakening bearish movements will signify a loss of confidence in a supply zone, with fewer and fewer market participants selling that.
Its bullish breakout will be an important even that will confirm a highly probable strong bullish continuation.
Smart Money will use this price model to manipulate the market and accumulate buying orders, not letting the price go through a supply zone. They will grab a liquidity of the sellers each time a bearish move follows from a supply zone.
When they finally get enough of a liquidity, a bullish rally will initiate and a supply zone will be broken , providing a strong confirmation signal.
That price model was spotted on GBPJPY forex pair.
Smart Money were manipulating the market, not letting it continue rallying by creating a significant horizontal supply zone.
Selling orders that were executed after its tests provided a liquidity for them.
A bullish breakout of the underlined zone provides a strong bullish confirmation signal.
A breakout and a future rise could be easily predicted once this price model appeared.
Why they do it?
But why do Smart Money manipulate the markets that way?
The answer is simple: in comparison to retail traders, they trade with huge trading orders . To hide their presence and to not impact market prices much, they split their positions into a set of tiny orders that they execute, grabbing the liquidity.
The price model that we discussed today is the example how they do it.
The important thing to note about this pattern is that it efficiently works on any market and any time frame. You can use that for scalping, day trading, swing trading. And it can help you find great investing opportunities.
❤️Please, support my work with like, thank you!❤️
I am part of Trade Nation's Influencer program and receive a monthly fee for using their TradingView charts in my analysis.
Smctradingstrategy
Simple Swing Trading Strategy with Smart Money Concept Explained
I will share with you the essential basics of swing trading forex gold with Smart Money Concepts.
You will learn how to do swing trading with the best SMC strategy.
I will teach you to c ombine order blocks, liquidity zones and imbalances to spot accurate entries and confirmation signals.
If you just started learning swing trading Forex with Smart Money Concepts, I strictly recommend trading with the trend only.
The cases and examples that we will discuss will be strictly trend-following ones.
Swing Trading with SMC in Uptrend
For swing buying any forex pair, we will look for the market that is trading in a bullish trend.
To confirm that the market is rising, you will need to execute structure mapping and find a forex pair that updates Higher Highs HH and Higher Lows HL.
Above is the example how I confirmed that GBPUSD is bullish with structure mapping. You can see that the pair consistently updates the highs.
Once you identified a bullish pair, your next step will be to find the zone from where the next swing move will follow.
According to the rules, the market remains in uptrend till the price is staying above or on the level of the last Higher Low HL.
Here is such a zone on GBPUSD.
It is based on the last Higher Low and current price levels.
We will assume that buying orders will concentrate within that area and from that a bullish rally will follow.
The problem is that this area is extremely wide, and we can not just buy randomly within.
Our next step will be to find liquidity zones within.
To buy, we need demand areas.
I found 4 price action based historic demand zones on GBPUSD.
We will need to wait for the test of one of these zones and then wait for an order block - a place where smart money are placing their buy orders.
The problem is that we don't know in which of these areas the order block is, so we will need to wait for tests of these zones and a consequent imbalance to confirm it.
To confirm a bullish imbalance for swing trading Forex, I recommend analyzing a 4H time frame after a test of a demand zone.
According to Smart Money Concepts, a bullish imbalance can be any sign of strength of the buyers : bullish breakout of a vertical/horizontal resistance, change of character, high momentum bullish candle, bullish price action pattern, etc.
An order block on GBPUSD was confirmed with a breakout of a resistance line of a falling channel on a 4H time frame.
That was the signal that Smart Money are buying, and that is your signal to open a swing long trade.
You place a buy position then with a stop loss below the order block and a target - at least a current high.
Swing Trading with SMC in Downtrend
For swing selling any forex pair, you will need to find a market that is trading in a bearish trend.
I suggest applying structure mapping to identify such a pair.
It simply should update Lower Lows LL and Lower Highs consistently.
USDCAD is trading in a bearish trend.
Structure mapping helps to easily confirm that.
Then, we will need to identify the zone from where the next bearish wave will start.
According to Smart Money Concepts structure mapping rules, the market remains bearish till the price is staying below or on the level of the last Lower High LH.
That's such a zone on USDCAD.
It is based on current prices and the last Lower High.
We will assume that selling orders will be distributed along the entire lenth of our zone.
Of course, we can not sell randomly within that zone because it is relatively extended.
Our next task will be to find liquidity supply zones within.
I found 2 price action based supply zones within our underlined area.
Before we sell, we will need to find an order block.
A place from where smart money are selling big.
To spot that, I suggest waiting for a test of one of our supply zones and wait for a bearish imbalance on a 4H time frame.
According to SMC, a bearish imbalance can be a bearish high momentum candle, a bearish CHoCH, a bearish price action pattern, a bearish breakout of a horizontal/vertical support , etc.
You can see that a lower supply zone was tested on USDCAD.
Our bearish order block confirmation is a bearish Change of Character, a formation of a high momentum bearish candle and a breakout of a rising trend line.
After that we can open a swing sell position and expect a bearish movement at least to a current low.
Stop loss should lie strictly above the order block.
TP should be at least a c urrent low.
That is how a trade should be executed on USDCAD pair.
Remember that there is no guarantee that the order block will be within a liquidity zone. You should learn to track the signs of smart money and their operations.
A proper combination of a trend analysis, liquidity zones and order block is the essential basis of a profitable swing trading Forex.
Mastering that, practice recognizing the imbalances and confirmations for spotting the best swing trading entries.
❤️Please, support my work with like, thank you!❤️
I am part of Trade Nation's Influencer program and receive a monthly fee for using their TradingView charts in my analysis.
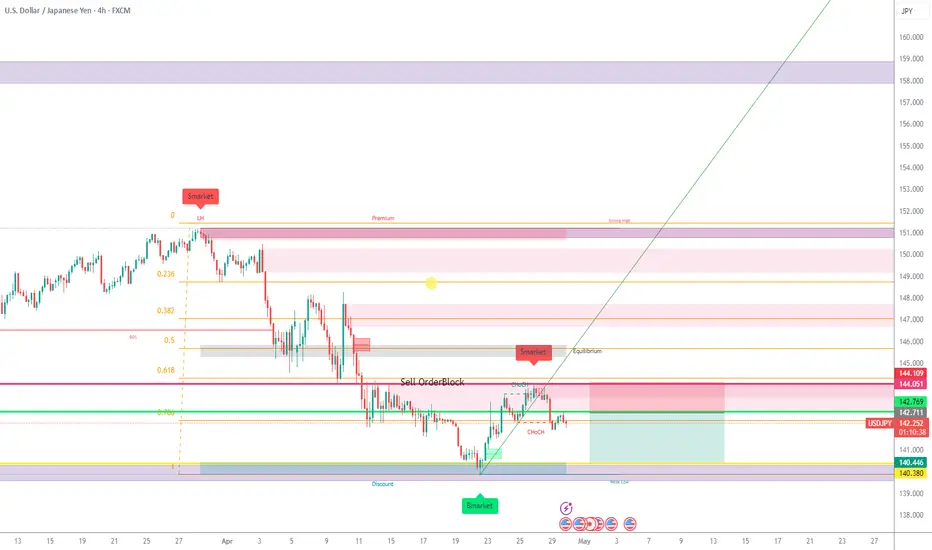
USDJPY sell (h4)Price is oversold in the h4 time frame according to the stochastic indicator which mean it is most likely going to pullback into the sell order block or liquidity zone then potentially travel down.
safe entry idea:
wait till price enters the liquidity zone (sell orderblock) and wait for the stochastic indicator to be overbought then enter.
or you could set a pending order for when price touches and rejects the sell orderblock
Good Luck!
USDCAD: Confirmed Bearish Trap?! 🇺🇸🇨🇦
USDCAD formed a bearish trap with a false breakout of a key daily/intraday
horizontal support.
The trap was followed by a confirmed bullish imbalance and a breakout
of the upper boundary of a consolidation range on a 4H.
With a high probability, the price will rise and reach 1.444 level.
❤️Please, support my work with like, thank you!❤️

AUDJPY may come down.AUDJPY may come down.
The price is near bearish order block if the price touches the order block then we can see the downward momentum. i have analyzed the chart using MOST ADVANCED PRICE ACTION STRATEGY WHICH WAS KNOWN AS SMC (SMART MONEY CONCEPTS).
BULLISH ORDER BLOCK :- 99.122 AND 98.738
BEARISH ORDER BLOCK :- 100.763 AND 100.432
My analysis suggests that :-
Entry point :-100.442
Take profit :-100.947
Stop loss :-99.763

DOGEUSDT.P | Forecast 15mNo signs of a bullish trend; the bearish trend is still continuing. As soon as a 15-minute buy-side liquidity sweep takes place, enter a short position with the help of a 15-minute bearish confirmation.

AUDUSD | 15m Trade Plan | Intraday15m: Can observe BoS and Swing Low
The price is now consolidating.
Plan A: As soon as the market takes buy-side liquidity, take a short position, followed by a 15m bearish confirmation.
Plan B: As soon as the market takes sell-side liquidity, take a long position, followed by a 15m bullish confirmation.
Plan C: Take a flip entry accordingly.
Do not deviate from the process; take entries in the 15m kill zones.

NZDUSD | Short Position15m Killzone :
Took entire buy-side lq and then gave 15m bearish confirmation
took short position after 1m bearish confirmation

Learn What is Inducement and Trap in Smart Money Concepts SMC
Smart Money Concepts can be applied for the identification of trend reversal in Forex and Gold trading.
In this article, we will discuss how to apply basic SMC techniques : trap and inducement to identify early reversal signs. We will study the important theory and go through real market examples on XAUUSD chart.
Imagine that there is a strong historical resistance on a price chart.
Because the price reacted to that strongly in the past, many sellers will place selling orders on that in future, anticipating a similar reaction.
Placing short trades, their stop losses will lie above the resistance.
In case of a bullish violation of the underlined resistance,
sellers will be stopped out from their short trades and close their positions in loss.
After the violation of a resistance, according to the rules, it should turn into support . Many traders will place their buy orders there, anticipating a bullish continuation.
Bearish violation of such a support will stop out the buyers as well.
Such a price action will be called an inducement and a bullish trap.
With that, smart money grab the liquidity both from the buyers and from the sellers.
After that, with a high probability, the market will drop .
Bullish violation of an all-time-high on Gold can easily be a bullish trap.
To confirm that, the price should simply break and close below a broken horizontal resistance.
That will confirm a local bearish reversal.
With a bullish trap and inducement, smart money are quietly placing HUGE SELLING ORDERS , making the retail traders close short trades in loss (buy their positions) and buy from the broken structure, providing them the liquidity.
The ability to recognize the traps will let you understand real intentions of smart money and trade with them.
❤️Please, support my work with like, thank you!❤️
