$SMH / $QQQ: Ratio below ATH; Still more room for upside It’s the semis which are the hallmark of a cyclical bull market. It is always the Semis which indicate the start of a bull market and the first to fold over towards the end of a cyclical bull market. Hence the outperformance of Semis as a momentum sector is important from a symbolism perspective and from a market indicator perspective.
When the semis outperform the NASDAQ100 we have momentous bull markets. Today we looked at the ratio chart between NASDAQ:SMH vs $QQQ. This measures the relative outperformance or the underperformance of Semis over the broader NASDAQ100.
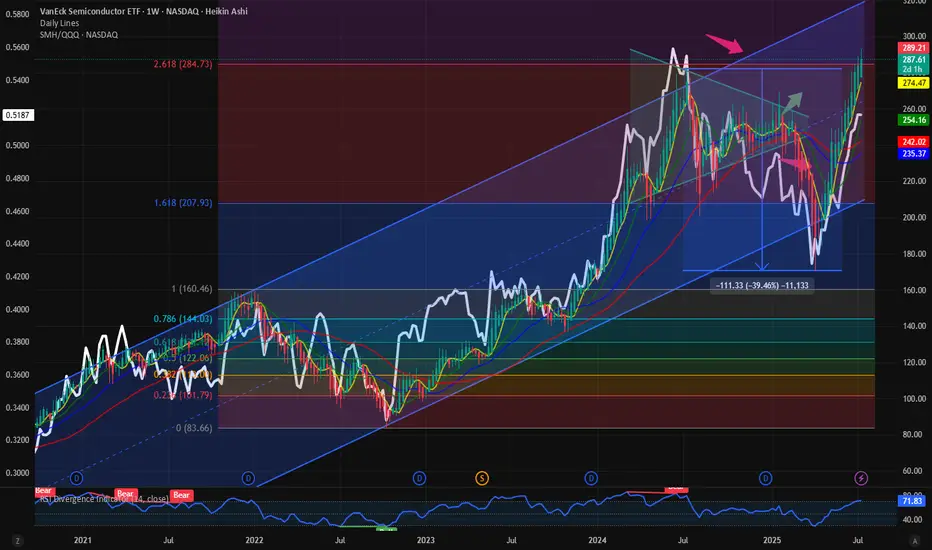
This ratio of NASDAQ:SMH / NASDAQ:QQQ touched its ATH on June 2024. Since then, the Semis lost momentum with NASDAQ:NVDA and NASDAQ:AVGO going sideways for a year. Now the momentum is on the side of Semis. Even if the NASDAQ:SMH is at 287 $ and at ATH with price is at its 2.618 Fib Retracement level, still the NASDAQ:SMH / NASDAQ:QQQ is not at its ATH. The ratio is currently @ 0.5. Before we hit 0.56 in the ratio chart just like last June 2024, SMH must outperform the NASDAQ100. If that must happen what should be the price of NASDAQ:SMH ? My prediction is the ratio NASDAQ:SMH / NASDAQ:QQQ tops @ 0.56 and NASDAQ:SMH goes to 400$ this year.
Verdict: Long NASDAQ:SMH over $QQQ. NASDAQ:SMH / NASDAQ:QQQ tops 0.56. NASDAQ:SMH price target 400$.
SMH
Opening (IRA): SMH August 15th 215 Short Put... for a 2.50 credit.
Comments: A starter position in the semiconductor ETF on a smidge of weakness here, targeting the strike paying around 1% of the strike price in credit.
Will generally look to add at intervals if I can get it at a strike better than what I currently have on.

SPRIAL TURN MAJOR JULY 5to the 10th TOP 4 spiral and one FIBThe chart posted is the updated chary for SPY SPIRAL calendar TURN Notice f12 is a spiral from July 16th 2024 top F 10 is from 11/2024 DJI The SPY was 12/5 th TOP F8 is from Feb 19th Top They ALL have a focus point on JULY 5th to 10th 2025 it is also 89 days since the print low. I Am looking for a MAJOR World event into this date . This time I feel it will be something with JAPAN . As to the markets here The put/call is now at the same level as july 2023 top and july 2024 . I have had fib targets in cash sp 500 from 6181 to as high as 6331 we are now in the middle of the targets But Time still has 3 to 5 days .So if we close strong today I will be buying deep in the money puts once again . The QQQ have entered the min target 551/553 But I tend to think {HOPE] we can reach 562 plus or minus 1.5 to move to a full short . But now in cash BTW the SMH target 283/285 is also a target .for its TOP Bitcoin is now setup for the next TOP I just need a new high .Best of trades WAVETIMER

$NVDA: Levitating higher: Next Stop 175$: 250$ Before cycle endsIn this summer bull market, it makes more sense to talk about the large cap winners. NASDAQ:NVDA chart is a beauty to watch with the steady climb of this mega cap stock levitates all the indices including S&P500 and NASDAQ. After hitting 90$ during the Liberation Day drawdown the stock is 60% up since then and recovered all its losses and hitting a new ATH. With stock at 158 $ it is targeting the highs of the upward sloping Fib Retracement channel which indicates that stock can reach a price of 175$ before this run loses its steam. At RSI of 65 this is not overbought compared to its historical level of 84. Hence there might be more room left in this bull run for $NVDA. My prediction is that before end of July 2025 the stock hits 175$.
But where do we like to see this outperforming stock during this cycle of bull run. Will it hit 5T USD before Dec 2024? If NASDAQ:NVDA hits 5T USD, then the stock will be 205 $ which in my opinion not impossible before Dec 2025. 40% Upside in the Market Cap and the stock price is achievable in a momentum stock like $NVDA.
Verdict: NASDAQ:NVDA @ 175 $ before July 2025 & 205 $ or 5 T USD Market Cap before Dec 2025

$AVGO above its previous ATH and holding on. 400 $ reachable. The poster child of the AI rally has been NASDAQ:NVDA and $AVGO. Here we have analysed both the stocks multiple times fundamentally and technically. But the lesser known NASDAQ:AVGO has performed better than the NASDAQ:NVDA since the April lows. NASDAQ:AVGO is still above its previous ATH and closed above yesterday which was 242 $ in Jan 2025. NASDAQ:NVDA is still below its Jan 2025 highs of 152 $.
The Semis index NASDAQ:SMH is also 6.3% below its ATH of 262 $. So not many stocks in this index have a more bullish chart than $AVGO. My assessment is that NASDAQ:AVGO will continue its dominant outperformance in the NASDAQ:SMH sector in comparison to others like $NVDA.
Going back to technical and plotting the Fib Extension levels form the last bull run before Aug 2024 we can see that the next possible near-term target is 275 $, a 10% upside form here and in the medium term the target is 400 $.
Verdict : Long NASDAQ:AVGO over NASDAQ:SMH and $NVDA. First Target 275 $ then we go to 400 $.

Opening (IRA): SMH July 18th 195 Short Put... for a 2.23 credit.
Comments: Adding at a strike better than what I currently have on at the 205 ... .

SMH Long Swing Setup – Buy the Dip or Overbought Trap? (2025-06-📈 SMH Long Swing Setup – Buy the Dip or Overbought Trap? (2025-06-12)
Ticker: NASDAQ:SMH | Strategy: 🟢 Equity Long Swing
Bias: Bullish with caution | Confidence: 70%
Hold Period: 3–4 weeks | Entry Timing: Market Open
🔍 Technical & Sentiment Snapshot
• Trend (Daily/Weekly): Strongly Bullish
• Short-Term (30m): Mixed – price above 50/200 EMAs, but below 10-EMA, MACD cooling
• RSI: Overbought (~77), suggests caution
• Bollinger Bands: Price hugging upper band
• MACD Daily: Mild bearish crossover – signals a potential short-term pullback
• Support Levels: 260–261 zone
• Sentiment: Falling VIX, Intel-led chip sector strength → bullish backdrop
🧠 AI Model Consensus
✅ DS, LM, GK (3 Models):
• Recommend long trade at open
• Confidence: ~70–72%
• Target range: $269–276
• Stop zone: ~$255–259
⚠️ GM Report:
• Suggests waiting – daily overbought + bearish MACD → not favorable R:R
• Recommends no immediate entry
✅ Recommended Trade Plan
🎯 Direction: LONG (Buy Shares)
💵 Entry Price: 262.85
📅 Hold Period: 3–4 weeks
🎯 Take Profit: 269.66 (+2.6%)
🛑 Stop Loss: 259.50 (–1.3%)
📏 Size: 100 shares (adjust to your risk profile)
📈 Confidence: 70%
⏰ Entry Timing: Market Open
📍 Entry Validity: Only if SMH opens at/above 262.50 and holds support (~260–261)
⚠️ Risk Factors
• 😬 Overbought RSI may cause short-term profit-taking
• 📉 Bearish MACD crossover could lead to near-term consolidation
• 🧨 Negative market surprise could invalidate long setup
• 🧮 Risk only 1–2% of your portfolio on this trade
💡 SMH bulls stay in control—but for how long?
🗣️ Are you going long, waiting for a pullback, or shorting the top? Drop your plan below 👇
📲 Follow for daily AI-generated trade signals & edge-backed setups.

OKTA - DAY TRADE IDEAOKTA is setting up for a day trade scalp long...perhaps an aggressive swing trade as well. The day trade is a much higher probability of success around the $98.50-$99.30
Okta's stock has seen some volatility recently. After a strong rally earlier this year, it pulled back following cautious guidance from the company. Despite beating expectations on sales and earnings for Q1 fiscal 2026, investors were concerned about slowing growth, leading to a 14.6% drop in its stock price.
Okta reported $688 million in revenue, a 12% year-over-year increase, and positive free cash flow of $238 million, but its GAAP earnings were significantly lower than its adjusted earnings. The company maintained its full-year revenue forecast of $2.85 billion to $2.86 billion, reflecting 9% to 10% growth, but analysts tempered their optimism due to macroeconomic uncertainties.
Technicals
- Multiyear Support
- 50 % Fib Retrace
- Upsloping Trendline
- Positive Divergence building on 1/ 4 hour chart.

$SMH vs $HACK: Recent good correlation with breakout potentialMany market watchers will say that Semis are the most important stocks in the market. Semis are great from a market direction perspective. They are the best to indicate a downturn and the fastest to recover during a bull run. In this blog we have appreciated the relative resilience of the Cybersecurity stocks during the recent bear market. The cybersecurity ETF AMEX:HACK fell only 25 % during the 2025 bear market. NASDAQ:SMH fell almost 40% and NASDAQ:SMH / AMEX:HACK fell 35% which indicated the relative underperformance of Semis vs Cybersecurity in April. But form the lows of ‘Liberation Day’ NASDAQ:SMH and AMEX:HACK are trading with perfect correlation. But the question comes will NASDAQ:SMH claim the leadership and outperform AMEX:HACK if this bull market continues.
In the last 2024 Bull market NASDAQ:SMH significantly outperformed the $HACK. We are probably in the early days of this breakout outperformance. So. In my opinion in the near term NASDAQ:SMH outperforms $HACK. The ratio is at 96%. The ratio might touch the previous cycle highs of 160% if the momentum continues.
Verdict: NASDAQ:SMH outperforms AMEX:HACK in near term. Buy NASDAQ:SMH ; Hold AMEX:HACK

SPX Bullish Patterns Emerging ahead of NVIDIA EarningsThe SP:SPX has taken out some major pivots and recaptured the ever so important daily 200 MA.
across multiple time frames some very interesting bullish patterns are emerging.
All eyes will be in NASDAQ:NVDA earnings tonight after the bell.
If NVIDIA beats and guides it will breakout of an epic bull flag pattern that will likely casue this market to trend to new All time highs.
Probabilities from a technical pattern standpoint are pointing towards higher price action.
We have already broken out and back tested key support levels and the buying is clearly being observed.
We remain net long with positions already in profit.

Opening (IRA): SMH July 18th 205 Short Put... for a 2.21 credit.
Comments: Doing some higher IV premium-selling in the ETF space, targeting the <16 delta strike paying around 1% of the strike price in credit.
Will look to add at intervals if I can get in at strikes better than what I currently have on ... .

TSLA Eiffel Tower Not CompleteEiffel tower patterns are rare but very powerful TA structures when they develop.
They are very hard patterns to short since we can never know when the wave up ends. However, there is so much information we can extract from them during and after the collapse.
When they are rising and going vertical, and you happen to be in it. The benefits will be great! As the price action sucks in everyone all at once with virtually no sellers.
So, what info can we learn?
On the way up, when this is happening, you should have the ability to recognize it at some point without worrying if you got the top. Take your money and RUN!
Never try to get back in and try to chase it up!
Never try to short it, thinking it is too high, this is the top!
When it tops out, never buy the dip! Bc you know how this structure will end.
Never buy based on some silly FIB or bc it's down too much!
Never buy the base thinking it will go back to new all-time highs, and it is now safe to get back in bc it will only keep going lower, more through time, frustrating you until you puke it up.
So remember this gimmicky sound bite.
"If they don't scare you out, they will wear you out!"
Ain't nobody got time for that! Your money has a much better place to be allocated to make you money instead of being fixated on a chart like this.
The reason people get stuck is bc the move provoked emotion! Then, when they get involved thinking they will be Buffett tomorrow from this one trade, they will experience Euphoria, sadness, anger etc., further provoking even more emotions to the point they become obsessed! Guessing, waiting, hoping, doubling down on and on...
Ask me how I know! hahaha!
While I made a lot of money shorting GME, here is an example of an Eiffel tower with many, many people that have this trading disease I just spoke about.
In conclusion, anyone who believes that TSLA will hit $1,000 blah blah blah and suckered into buying it. You now know you are being honey dicked by a bunch of armatures and bots on X. Beyond TSLA there are many such charts out there tight now that have formed the beginnings of ET. As such, you should know how to recognize it quickly and avoid the pitfalls out there.FYI I called the Top on TSLA ))
Click Like, Follow, Subscribe to learn much more about real macroeconomics and technical analysis. Let me help you navigate these crazy markets.

$AVGO looks bullish here. Can go as high as 276 $ NASDAQ:AVGO has seen a faster recovery from the April 8th lows faster that other Semi stocks. The recovery has been stronger than $NVDA. The stock lost 45% of its value during the recent bear market. Since then, the stock has also recovered 45% of its value form the lows of 145 $. The weekly close of NASDAQ:AVGO above the psychological level of 200 $ is very bullish for the stock.
If we plot the fib retracement level NASDAQ:AVGO form the Aug 2024 Yen carry trade sharp sell off, then we can see that the there are major levels which we can reach in the next few weeks. With the management declaring 10 Bn $ of stock buy back there is a floor for the stock price and it provide more upside support for the stock. In this blog we had said on 6th April that the price is good for accumulation, and we should go long on $AVGO. And that was a good trade for those who took it. We should stay long in NASDAQ:AVGO as the stock can go higher before any sell off can set in.
Verdict : Stay long $AVGO. Next stop 219 $ and 250 $.

Today is oct 14th 1929 I have moved back to Long puts at 105%The chart posted was in the forecast written dec 8th 2024 We have now reached my targets of 5669 area I have been buying the dips in calls and made $ I am now 105 % long in the money puts and I do Not see a bottom until july once we break and a second bottom mid oct The market should see a drop of 38 % into july and form a small double bottom in oct at 41 % off the highs . I will move to 125 % long puts on a sell stop at 5300 even the math at 5334 is key Best of trades WAVETIMER

$NVDA forming local higher low and above 20-Day SMA NASDAQ:NVDA has traded very poorly recently. Today we are looking at a daily price chart of NASDAQ:NVDA and we have seen many lower lows and lower highs since GTC Conference. After touching the ATH of 150 $, the price is making new lows and has recently touched the lows of 85 $ and made new higher low of 95 $. So, this marks a double higher bottom and now the at 105 $ is now above 20 Day SMA. This might mark a bullish reversal in my opinion.
So why not a trade idea on a Friday. #TGIF. I say we go long NASDAQ:NVDA here and now. Remain long if it remains over the 50-Day, 100-Day and 200-Day SMA. 200-Day SMA ist currently @ 125 $. If NVDA has a weekly close above 125 $ then we go all in on $NVDA.
Verdict: Long NASDAQ:NVDA here until 125 $. Keep watching this space for next levels.

CHIP SECTOR TO CRASH SMH The chart posted is the SMH we are now in the final 5th wave and it is a classic 5th wave Diagonal in the 5th wave wave to form a double top into fib cycle peak .From here we should see a major break down in All chip stocks into Oct 2025 but we should see the first leg down low march 10/20th 2025 this should be a Very Bearish action world wide see spy and qqq as well . This is the warning to All traders EXIT INTO RALLIES THE BEST OF TRADES WAVETIMER

NVDA Rounding Topping Pattern!I started warning about NASDAQ:NVDA back on Nov. 4th, 2024, and we all saw a healthy -30% decline since then.
Updating that chart reveals a rounding topping pattern in place. Despite the 30% collapse, the pattern remains as bearish as ever.
CAUTION is in order!

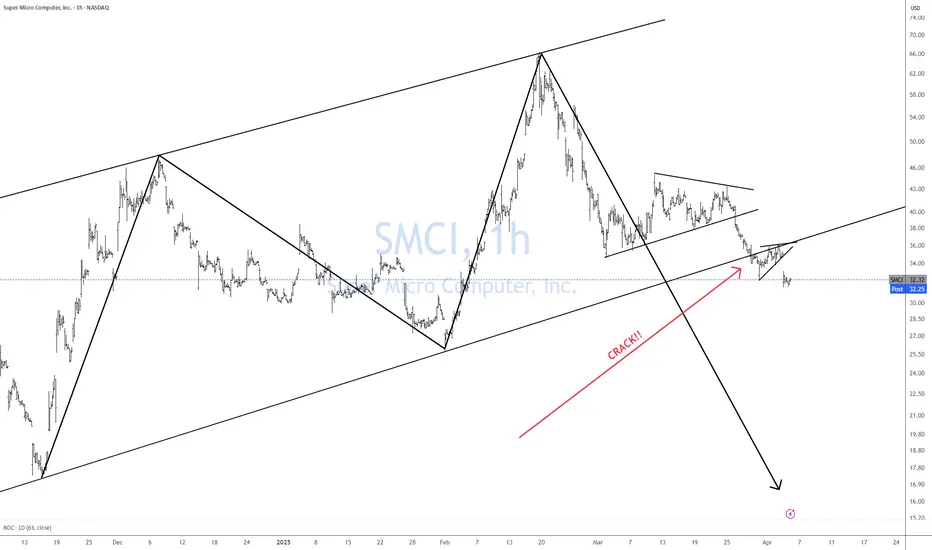
SMCI CRACK!!I called the absolute top in SMCI back on April 4th, 2024.
see chart below.
This year I am once again calling a CRACK!! lower. No, it is not seasonal it is just happenstance. ))
This is a very simple trade as most of my trades are.
Bulls take your money and GO!!
$SMH vs $HACK Ratio Chart: Intra Tech sector rotation NASDAQ:SMH with closing @ 180 $ on 04 April 2025 is equivalent to drawdown we saw during COVID crash. During the covid crash the semiconductor ETF lost 37% and this tariff crash we also saw 36% drawdown. But in contrast to that the current tariff environment has only a peak drawdown of 25% in $HACK. AMEX:HACK is the ETF of the largest Cybersecurity in the market. Within the Technological sector there is a intra sector rotation form Semi and Software to Cybersecurity.
This weakness in NASDAQ:SMH can be attributed to heavy weights like NASDAQ:NVDA and NASDAQ:AVGO which have been down more than 40% form their ATH. But in contrast NASDAQ:CRWD , NASDAQ:PANW and other cybersecurity stocks have shown great amount of strength.
In this ratio chart we discussed earlier in this blog that there is a head and shoulder pattern forming indicated in the blue but then the drawdown in SMH pushed it below the neckline and we went below 3.15. The next level in the ratio chart is 2.71 to which we are very close. From the peak the ratio is down almost 40% which is the same as the drawdown in $SMH. The RSI in the chart is also oversold @ 28. My expectation the second neckline will not be broken, and we will hold the 2.7 ratio.
Verdict: Overweight NASDAQ:SMH over $HACK. Both are good long-term buys.

$SMH: First the generals then the index NASDAQ:SMH with closing @ 180 $ on 04 April 2025 is equivalent to drawdown we saw during COVID crash. During the covid crash the semiconductor ETF lost 37% and this tariff crash we also saw 36% drawdown. If this tariff war on goes then we might see some more weakness. With this drawdown the NASDAQ:SMH is below its 200 Day SMA. ‘Nothing good happens below 200 Day SMA’ and the ETF is below the upward sloping channel. The RSI is also touching the lows the lows we saw during the COVID time reaching the oversold mark of 30.
This weakness can be attributed to heavy weights like NASDAQ:NVDA and NASDAQ:AVGO which have been down more than 40% form their ATH. But the question remains will the drawdown stop here or there is some more pain. But we should not forget the 3-day rule in the markets. Where the sell off peaks off in the 3rd Day. 07 April will be the 3rd Day after the tariff selloff.
Should we call the bottom here? Unless we think that there will be a recession then these are good levels to buy. But if the tariff negotiations go on for longer period, then there will be chop around for a longer period and instead of a V shaped recovery we might see a U-shaped recovery in SMH.
Verdict: Accumulate some NASDAQ:SMH here and go extra-long @ 170-180 $


MAG7 MODEL Rally is going to be in the form of ABC up The chart posted is the Mag 7 .I feel strong that the super cycle Top in the mag 7 was seen like January 2000 in the internet Bubble . I am counting a clean 5 waves down and see a strong ABC rally phase like that in 2000 then we dropped about 30% in the first leg down followed by a huge Bearish rally back up first leg up moved to the 50% retracement and then had a abc down for wave b of B to be followed up to .618 of the decline to form THE B Wave TOP . I am looking forward in my work and my models to see a near prefect rematch in the formation . I stated in my dec 8th forecast How the market will unfold based on the Wave structure and cycles and the DATA . We are now set for that abc rally . next turn date in spirals in 3/28 best of trades WAVETIMER

$SMH/$NAS100 is clearly in a bearish patternThe semiconductor sector was the poster child of the 2023 & 2024 bull market. The cap weighted index is a momentum play with heavy weights like NASDAQ:NVDA and NASDAQ:AVGO outperforming and hence the ETF gives more than 100% return in 2 years.
NASDAQ100 index is also cap weighted and momentum oriented. But the index provides diversification to a certain extent. NASDAQ:SMH hit an ATH in June 2024. In this chart we are plotting the ratio of NASDAQ:SMH vs $NAS100. The ratio peaked in June 2024. The ratio is making new lower lows and lower highs.
If we plot the inverse head and shoulder, we see that the ratio can probably hit the neckline which lies at 0.01. This will indicate a 10% more downside in NASDAQ:SMH compared to $NAS100. Currently NASDAQ:SMH is at 226 $. This will indicate a low of 200 $ and then it might indicate a bounce back from those levels.
Consolidation of NASDAQ:SMH around 220 $ - 200 $.
