SMH/SPYSMH has handedly outperformed the SPY since 2018 but has stalled recently
If SMH cannot continue to outperform SPY in 2022 it will be ugly for tech/growth
SMH


SMH/SPYSemiconductors have significantly outperformed the S&P 500 since 2015
Semiconductors are today's transports

$SMH Semis Breakout RetestSMH Breakout Retest of 313, needs confirmation . Failure expect a move back in the box to the 300 zone.
Given the bullish seasonality and technical confluence (MACD cross and RSI uptick), bias is to the upside with $325 and $332 price targets.
I'm long JAN $315 Calls, 30% stop.

MU - Bearish option flow into earningsBearish option flow into earnings.
On Friday, December 17, 2021 there was some notable buying of 4,882 contracts of the 12/23 $77.00 put
The fib retrace level for 50% would be the $77 area.

SOXL trend past 2 yearstrends SOXL/semis have displayed last 2 years.
Just a trend analysis study.
Observation: SOXL is more wilder than TQQQ for sure, though both are leveraged 3X, and is harder to trade vs TQQQ

AMD Bull Scenario
AMD triggers Bull to Mark Up into our Bull Targets
AMD finds support at our Bear Trigger to Mark Up into our Bull Trigger
Bear Scenario
AMD triggers Bear into our Bear Targets
AMD finds Resistance at our Bull Trigger and Marks Down into our Bear Targets
Neutral
Price action stays within our Trigger levels (inventory rebalance)
Side Note
Each level has potential to reverse not all targets may be met.

NVDA TRIGGER LEVELSBull Scenario
NVDA triggers Bull to Mark Up into our Bull Targets
NVDA finds support at our Bear Trigger to Mark Up into our Bull Trigger
Bear Scenario
NVDA triggers Bear into our Bear Targets
NVDA finds Resistance at our Bull Trigger and Marks Down into our Bear Targets
Neutral
Price action stays within our Trigger levels (inventory rebalance)
Side Note
Each level has potential to reverse not all targets may be met.

QQQ trendRecent Choppy market has left QQQ's and Semis bruised but not badly injured yet.
Here's my strategy to monitor if things normalize.

AMDAMD looks like it's ready to continue it's momentum alongside NVDA towards 180$. This one just about a year ago or so was around 50$ .. Crazy growth!

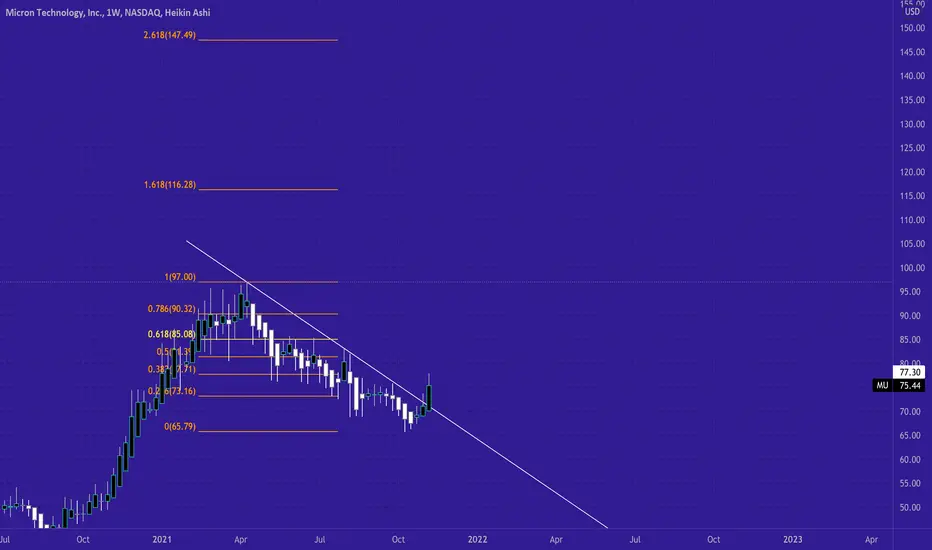
MUMicron is a long based off the technical breakout on the weekly timeframe.
Targets lower 80 area and above there possibly 100.
Chips have been running like crazy, does it continue?
𝗡𝗮𝘀𝗱𝗮𝗾 𝗨𝗽𝗱𝗮𝘁𝗲: $QQQ Daily. Top of ChannelQuite a run helped by yields the past 2 weeks. Hitting top of channel. More likely to see rotation to $IWM, $XLF, etc. versus this breaking out "now" but possible
$NQ_F $NDX $SOX $ES_F $SPY $SPX $TLT $TNX $GLD $DXY $VIX #Trading #Stocks 📈

LRCX LONG SETUP There are two specific wolfe wave setups on the 78 min (AH+ON) and Daily time-frames. The projected target is calculated by extending a linear line between pivot 1 and 4 and projecting the line. This is represented as the green and blue perforated lines, as shown in the chart. The projected targets for the 78 min and daily setups are 378 and 605,respectively.

FB - INTC V.2 FB options degenerates are back, surprise.
Put Volumes dominating the Volume although O/I is split.
297.50 @ 1,357
300.00 @ 5,886
305.00 @ 1,854
310.00 @ 2,873
312.50 @ 556
315.00 @ 1,273
317.50 @ 819
320.00 @ 3,540
322.50 @ 1,210
325.00 @ 1,672
Semiconductors, Comm, Telco, Software - are being used to push to the NA
to Price Objectives @ 15513 - 15517 as the VXN broke its Lows and is making
New Lows for the Day.
Range break leads to higher Price Objectives.
We are SOH until FB reports.

EBON PLTR BLU CPNG LUL ASML GVP REDU SMH Cloud Poppingwww.tradingview.com
This is my Watch List for all the stocks in my 200 list that are popping the cloud. Red Flag means already has a green Candle and either ready to go or watiing for a solid green candle with no wick to signal your in. No flag means red or in the cloud and waiting for Green Candle No Wick to close outside of the cloud to signal. These are all good for a 1:1 or 2:1 Position based off the last node or if you cant find that...the bottom of the cloud as a stop loss. Some of these will follow a 45 degree angle up over a week or more time frame....If you want to take out profits and leave runners on these that would be a good way to make sure you dont leave anything on the table. I would also look at other stocks in the sector of whatever one you take interest in. if you see it doing the same move and going up in a 45 degree angle then this stock most likely might be following suit.
I am not a financial advisor do not blindly jump in on any of my trades without doing your own DD. This method is using a cloud I custom set the parameters to and piggy backing that off Wyckoff Method as this would be the last dip into liquidity or the first push after the spring (Accumulation or Absorption of the float) Also the Curve which would be (the spring or Launch) and the Key algo which is the path drawn in white.
by iCantw84it
10.23.2021

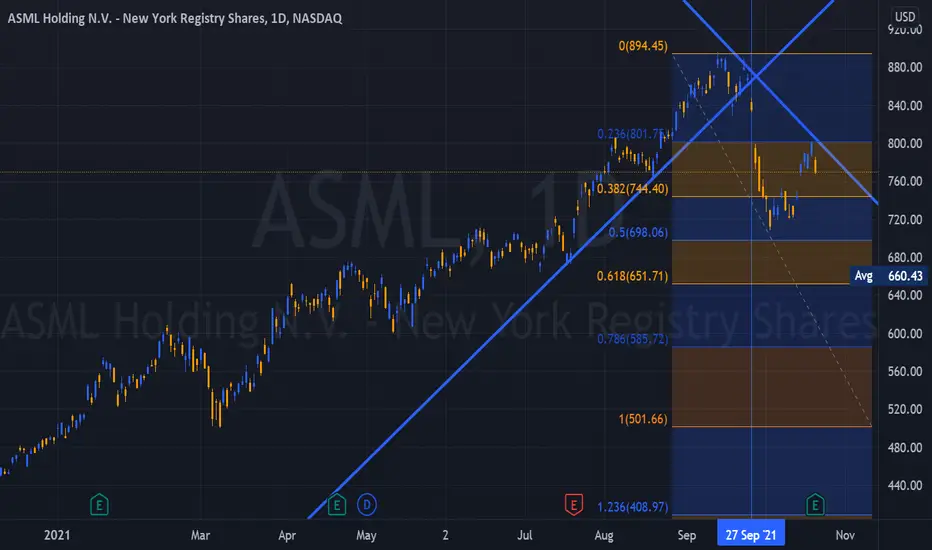
ASML - Chips feel the DIPWhen the Globes largest Semiconductor FAB, dumps 4% in one day...
It might be a warning sign of Price action ahead.
We continue to position into a Put Calendar Spread for the SMH
from 240 - 270.
We will begin to acquire 400 Puts within November 19 through
December 17 Time Range.
We believe there is an opportunity beginning today and are acting
on what we see as the potential for downside to the 231 Level.
SMH - The TECH MaestrosYou have to laugh, as Retail was piling into the NQ/MNQ @ 71, 75, 82, 88, 90, 92, 95 on the SELL.
The BOTS simply waited for the 3:59 arrival to run all those stops at 410 - 420.
Usually, they wait until 1 second after 4 and run it vertical @ until 4:02 PM EST.
By 4:05 PM EST - a new high off the Ledge @ 15428.50.
Ya see, all the Baby Seals were thinking - "Bruh, uh... last time we were at 399 we fell 100 Points,
it's probably a good idea to Sell this now... fer sure" - the Problem is, the AIQC knows this... and
you see the results.
It knows how to read forums in nanoseconds and observe your behaviors, it sees the ENTIRE ORDER BOOK.
As odd lots of Micros for MNQ went flying by... it was painful to watch as the clubbing
was being set in motion, sad really. It's cheating, but then this entire game is one big cheat.
They win, you lose... Someone has to lose... not everyone gets a Trophy.
You sell when it is, not until... keep it simple.
The sure thing bruh, yeah, naw, it's stacked against you.
Why wait when there's fresh blood in the water, the Mako's did not hesitate, chewed to chum
bits during a 1 Minute Bar.
Baby Seals clubbed again in Semi CONductors of which there is very little Conducting going on
or ongoing for that matter.
Fires, Water Shortages, Green Agenda... Yada Yada, pick any excuse.
There is a shortage of Chips, Globally. Although one would never, apparently never, have a DIRECT
Effect upon Price of Said Chippers.
NQ to 15517 will only add Insult to Injury.
Winsome, lose some - Literally.
Chips N' NO Dip:
AMAT + .99%
MU +.54%
AVGO + 1.445%
TXN + 1.7%
INTC + 1.54%
QCOM + 1.83%
ASML + 1.62%
NVDA + .40%
TSM + 1.40%
Semi's rocked the Bang Bus after being rocked for weeks on end.
AS the VXN dipped into new lows for the Day, it did not matter a Whit... NQ Made new highs
after it reversed and closed 28 ticks off the lows... AIQC... it's a Hunter Killer.
Sweet Ginger Brown... it's a mess out there, they are entirely desperate to get this up and lickety-split
as indicated.
What's the Rush?
We're going to find out soon enough, and it will not be Good.
Here's that word again............
P A T I E N C E
- HK

SMH AKA SOX TARGET 5 OF 5 OF 3 283/290 Look for an issue at 267.60 after that 270.6 then NO ISSUES TILL 283 TO 290 WAVE 5 OF 5 OF 3


SOXX 1 year trendSemiconductors/chips continue to be an essential part of everything around the globe.
For a year, we have maintained an upward trend, which is being tested today.
There are clear outperformers in the industry, but it is clearly been working for all of them as a whole.
When we have touched the trend line in the past, we have had a 50 point gain, which has happened through 2 weeks approximately. That gives us a target of around $505.

$AMD BreakoutSee where she closes, but as of now, AMD has broken out of the descending triangle indicating bullish sentiment and more upside this week potentially.
I'm long 10/15 calls , weekly 110C for a higher risk/reward idea

MU - consolidating , possible falling wedge pattern Micron looks to be consolidating on the daily chart heading into earnings Tuesday after market. The POC - (point of control) could be target $80, after earnings with 8% move expected.
The Oct 1st options data shows a put/call ratio at .55 . The Oct 15th $75 and $80 calls have over 28000 Open interest.
Looking to go long breaking above $75

$amd Daily=Looking for a move to the .236 fib extentsion tomorrow to 109.76
-In $amd $108 9/17 lotte for .50
