Short then long, or average in a position.Semi conductors are not going anywhere, they just completed a huge run. Fell out of the wedge and I dont see this going below 80$ ever but I see it testing a couple spots below and breaking north .
SMH

AMD Long Directional Bias: Long
Price Target: 28.5
Good Entry: 26.8-27.2
Risk/Reward: $40 cents max stop/$1.3 reward

Trade of the Week IC in INTCTaking advantage of this quick rise in IV and VIX to sell some premium in INTC 43d short term play before earnings hoping for 25-50% decay
Tasty stats POP 55% P50 67% Theta 2.25 Delta -5.12 50/55 c 45/40 p A less risky version of this would be an IC in SMH which is also experiencing a nice
rise in IV today


THE WEEK AHEAD: JPM, C, WFC, SMH, AND XBILater in the week, we kick off earnings season with a trio of financials: JPM, C, and WFC,* all of which announce on Friday before market open.
Generally speaking, I haven't played a lot of financials in the past, since their background implied volatility never seems to bump up significantly enough. Here, however, with JPM's implied at 32, C's at 33, and WFC's at 33 -- all toward the upper end of their 52-week ranges, I figured I'd take a look to see whether "this time is different." It looks like it is ... .
The April 20th 23 delta 104/114 short strangle in JPM is paying 1.47 at the mid with break evens at the one standard deviation line, and the corresponding defined risk setup (an iron condor) with strikes at 101/104/114/117 is nearly paying one-third the width of the wings -- a .96/contract credit, with break evens between the expected and a one standard deviation move.
The C April 20th 65/72.5 20 delta short strangle is paying 1.00 even with break evens at the one standard deviation line, implying that a defined risk setup isn't going to pay at least one-third the width of the wings. Moreover, the longs clear of the 20's go 2 1/2 wide ... .
In WFC, the April 20th 49.5/55 22-delta short strangle pays .87/contract with expected move break evens ... .
Out of these three, I'd probably go with the JPM play because the defined risk setup is paying nearly one-third, and the strikes wide of the 20-delta strikes don't go all "wanky." Having strikes in one-wide increments basically everywhere generally leads to fewer rolling headaches. That being said, it's a long way between here and Thursday close, which is when you'd want to look at these underlyings again, adjust your setups accordingly, and see whether they're still worth your while.
On the exchange-traded fund front, the top five implied volatility wise are: OIH (37), SMH (36), XBI (36), XOP (35), and EWZ (32). I'm already in XOP and EWZ plays, so the only thing that makes personal sense for me out of that group are potential plays in SMH or XBI, although I'm sure there's still juice to be had in just short strangling XOP (the May 25th 31.5/38's paying 1.00).
The SMH May 18th 90/108 short strangle (20 delta) pays 2.55 with expected move break evens; its defined risk counterpart, the 87/90/108/111 pays .93, slightly short of the one-third I normally look for, but probably good enough for a less than 40 day until opex setup.
The XBI 75/91 pays 1.98 with expected move break evens; the 72/75/91/94 pays .85 ... .
* -- Given that this trio is closely correlated, it may also be worth taking a look at XLF, although with a background implied of 28, that isn't looking all that juicy at the moment ... .

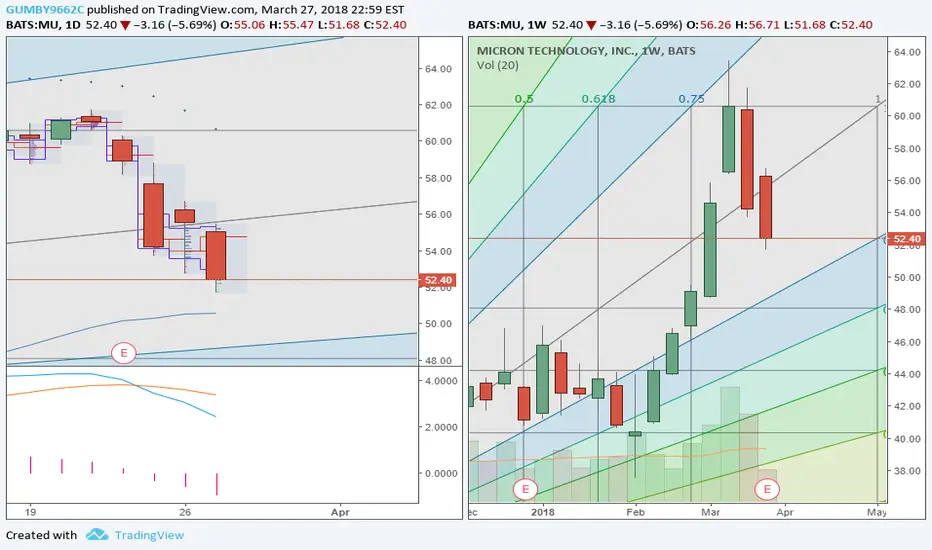
MU in free fall but closer to some supportMU looking bad for SMH stocks. Looks like all these stocks out of favor for a while from here.

NVDA broke into the accelerated range hereNVDA in a whole lot of trouble right here. Bad for all SMH stocks. Watch SMH draw QQQ down for a while.

THE WEEK AHEAD: IBM, SLB, KMI EARNINGS; XLU, SMH, IYR, EWW, VXXEARNINGS
The earnings on tap aren't looking very enticing to me, as I generally look at getting in on these where the implied volatility rank is >70% and the background implied volatility is >50%. However, they might be worth watching running into earnings to see if implied ramps up.
KMI (implied volatility rank 79/implied volatility 30) announces earnings on the 17th after market close. The January 19th expiry's implied volatility is at 40%, with the 26th's at 31.4% (a 27.5% potential contraction). Given the underlying's price, it's probably best to go short straddle. Unfortunately, the Jan 19th's 19.5 short straddle isn't paying much -- .70 at the mid, with break evens clear of the expected move. Given what that's paying, a defined risk play won't pay.
IBM (implied volatility rank 93/implied volatility 26) announces on the 18th after market close. January 19th's implied's at 43.2; the 26th's at 31.3 (38.0% potential contraction). The January 19th 157.5/170 short strangle (23 delta) is paying 2.30 at the mid; the 152.5/157.5/170/175 iron condor's only paying 1.49 (<1/3rd wing width), so would probably pass on a defined unless implied volatility frisks up running into earnings.
SLB (rank 100/implied 27) announces on the 19th before market open. January 19th's implied is 35.4 vs. Jan 26th's of 27.9 (26.9% potential contraction). The 19th's 76/80 short strangle's paying 1.07 at the mid. Defined -- not worth it.
NON-EARNINGS
Another area in which implied volatility rank makes potential plays look promising, but where background implied volatility isn't up to stuff. Currently, there are no exchange-traded funds whose implied volatility rank is in the upper one-quarter of so of where it's been over the past year and where background implied is greater than 35%.
For what it's worth, though, here are the top ones: XLU (73/15), SMH (59/23), IYR (57/14), and EWW (51/24).
VOLATILITY PRODUCTS
Recently I've been working VXX* in two ways: (1) "price agnostic," where I enter either a long put vertical or short call vertical when the next weekly expiry open on Thursday or Friday; and (2) on pops where the VXST/VIX ratio is >1.0 (the higher the better). Unfortunately, it's tough to forecast a pop (although I've seen people repeatedly make the attempt), so you just have to set up an alert to trigger on a VXST/VIX ratio print of >1.00 or a VVIX print of >110 and keep powder dry for when it happens.
* -- I've been waiting for UVXY to reverse split on the notion that a 1/2 strike of movement in an 8.67 (UVXY Friday close price) underlying is somewhat more of a heavy lift than a 1/2 strike of movement in a 25.85 one, even though UVXY is leveraged.


AMD: Potential bullish Bat formationcompletion at 10.12 although due to the overwhelming selling pressure I will play this one with careful. Preferable buy near 200MA (9.75) but I'm happy buyer near 10...will see it opens tomorrow.

Semiconductor ETF SMH wave countI know it is crazy and hard, but I will still try.
76.69-78.58 is a stacked resistant zone for a iv wave correction. We may or may not finished iii wave.
Look for a 5 dollar correction soon.

SELL SEMICONDUCTORS - LONG TLF RATIO 0.59 -target 0.50SHORT SMH
LONG TLF
Target 0,50 - Super retracement expected
Unload Risky assets tactically (1-3 months)
14-15% Potential Gain
Set your own Stop Loss.


SMH - SEMIs above and beyond!Semiconductors have defied the gravity for sure!
They act similar to IBB just before it rolled over.
For now, it is consolidating above a major trendline.
Probably another move up!

SPY - All upside targets have met!SPY, IWM and SMH have met their upside targets. If we close Below the $214.56 with minimum 100 million in Volume, we will see a major correction, till then stay put!

SMH-bearish-Breaks below 32-month rising trendline for lowerSMH extended the decline off the 60.13 peak (June 1, 2015) to breach 32-month rising trendline (from November 2012 low), suggesting scope remains for further downside. The immediate support lies at 50.40 (61.8% of 44.43/60.13 upleg) then 48.11 (76.4% of 44.43/60.13 upleg). Below there would expose the 44.43 key support (October 15, 2014 reaction low). The 53.97/55.03 resistance zone should cap near-term bounces. Only a push back above the 55.03 area would stabilize.
Outlook:
Short term: bearish
Long term: bearish

SMH Day Trade Retest Gap (Brad Reed Apr6,2015)SMH expected to gap to 53.70 for a Retest Gap. To learn to trade this strategy for free go to www.RealLifeTrading.com

ARMH- If Looking To Short It? Wait, And Here Is Why.3-29 Here's the drill. Nice clearly defined uptrend
channel that? Put in a Double Top and broke its
uptrend to the downside. Now for shorting? Let it
stage a snapback rally up to new resistance at
either the red line around $52.00 or a Fib retracement
zone (notice where the 61.8% zone is? Its at those levels one wants to see? Stalling, THEN
one can think about short selling it for a trade and not until.
If you are one who shorts stocks THAT is the "What to Watch For" from here.
@AmazingPatterns
Strictly for educational and informational purposes only. Trade at YOUR own risk
This is NOT a recommendation.
