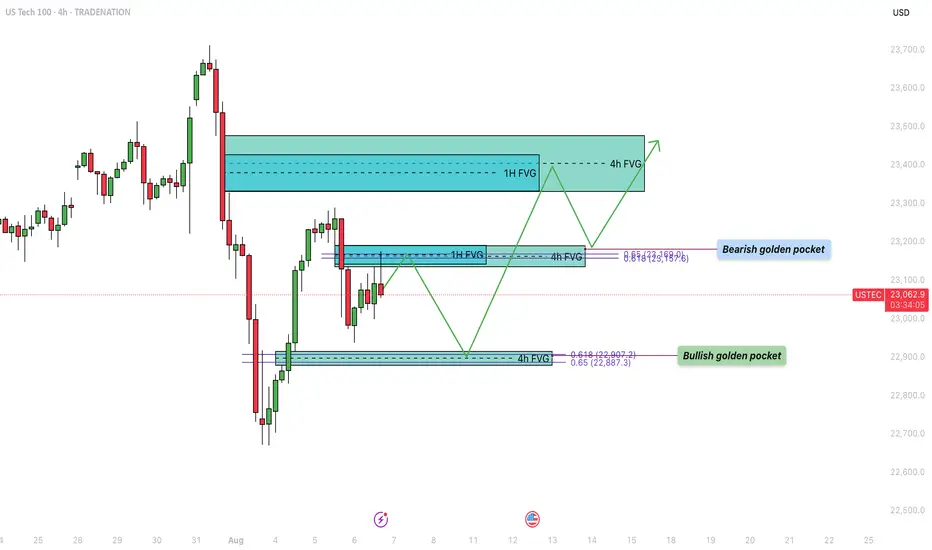
US100 - Bullish trajectory to fill the inbalance zones!Over the past week, the US Tech 100 (US100) experienced a sharp decline, dropping into a significant support zone. During this bearish move, several fair value gaps (FVGs) formed on both the 4-hour and 1-hour timeframes, which remain unfilled. Currently, price action is retracing upward, aiming to fill these imbalances. The structure of the market suggests that both bullish and bearish scenarios are in play, depending on how price reacts to key levels marked by these FVGs and Fibonacci retracement zones.
Bearish Resistance
The first major area of resistance is located around the $23,160 level, which has just been tapped. This zone presents a strong potential turning point due to the confluence of a 1-hour and a 4-hour fair value gap, which perfectly align with the 0.618–0.65 Fibonacci retracement level, also known as the golden pocket. This cluster of technical signals increases the probability that this level will act as a strong supply zone, potentially initiating a rejection back toward the lower support area.
Bullish Support
On the downside, a key level to watch is around $22,900. This zone marks a 4-hour FVG that was formed during the recent upward move. Importantly, this area also coincides with the golden pocket from that very same leg up, offering a compelling confluence for bullish support. If price revisits this level, it may act as a strong demand zone, providing a springboard for the next leg higher, particularly if buyers step in aggressively to defend it.
Bullish Trajectory
If support at $22,900 holds, the bullish trajectory suggests a possible continuation toward the $23,400 region. This upper target contains a large overlapping 1-hour and 4-hour FVG that remains unfilled. Historically, price tends to revisit and fill such imbalances before choosing a definitive direction. A bounce from the lower support zone and a successful break of the $23,160 resistance could pave the way for a clean move toward this higher target, completing the FVG fill sequence.
Final Thoughts
The US100 is currently navigating a key technical crossroads. With multiple unfilled fair value gaps and well-aligned Fibonacci levels on both the upside and downside, the next few sessions will be critical in determining short-term direction. If the $23,160 resistance continues to hold, a pullback to $22,900 could offer a high-probability long setup, while a clean break above this resistance opens the door to filling the higher FVGs.
-------------------------
Disclosure: I am part of Trade Nation's Influencer program and receive a monthly fee for using their TradingView charts in my analysis.
Thanks for your support. If you enjoyed this analysis, make sure to follow me so you don't miss the next one. And if you found it helpful, feel free to drop a like 👍 and leave a comment 💬, I’d love to hear your thoughts!
SMT
Understanding SMT Divergence In Trading1. Definition and Importance
SMT (Smart Money Technique) Divergence refers to a trading concept that involves identifying discrepancies between the price movement of correlated markets or instruments.
These discrepancies can signal potential market reversals or price manipulation. Specifically, it focuses on the divergence between price movements and indicators (like volume, momentum, or oscillators) in markets that typically move in sync.
In SMT Divergence, traders look for situations where two or more correlated instruments (like
Forex pairs, indices, or bonds) are moving in opposite directions. This "divergence" signals that
there may be a shift in market sentiment, liquidity manipulation, or an opportunity for price
correction.
The importance of SMT Divergence lies in its ability to detect hidden market dynamics that are
often manipulated by institutional players. By understanding these divergences, traders can
gain insights into potential market moves and position themselves accordingly.
2. The Relationship Between Correlated Markets
Understanding these relationships is crucial for identifying SMT Divergence:
Forex Pairs : Many Forex pairs have direct correlations. For example, EUR/USD and USD/JPY are often correlated in the sense that when the USD strengthens, both pairs may exhibit price movement in the same direction (EUR/USD decreases, USD/JPY increases). SMT
Divergence occurs when these pairs move in opposite directions, indicating that something
unusual is happening in the market (e.g., liquidity manipulation or market anticipation).
Indices : Stock market indices (like the S&P 500 or Dow Jones) and related instruments like futures or ETFs can show correlation. A divergence in these indices might indicate potential
trends or reversals, signaling that institutions are positioning themselves for a move in one
direction, and the market is showing resistance.
Bonds : The relationship between bond yields and currency pairs, for instance, can also show correlations. When bond yields move in one direction, certain currency pairs should
generally follow suit. Divergence in this relationship can reveal clues about market
intentions, such as shifts in interest rates or macroeconomic sentiment.
Commodities and Stocks : Commodities like oil and gold can often correlate with indices or specific stocks. For example, if oil prices rise and an energy sector index doesn’t move in the
same direction, this could be a sign of market inefficiencies or institutional positioning.
3. SMT Types
3.1. Bullish SMT Divergence
Bullish SMT (Smart Money Technique) Divergence occurs when one correlated asset forms a
higher low while another makes a lower low. This indicates that one market is showing hidden
strength, suggesting a potential reversal to the upside.
How to Spot Higher Lows in One Asset While the Other Makes Lower Lows:
1. Identify Two Correlated Markets – Choose two assets that typically move together, such as EUR/USD and GBP/USD or NASDAQ and S&P 500.
2. Look for Divergence – Observe when one asset makes a new lower low, while the other fails to do so, instead of forming a higher low.
3. Volume & Price Action Confirmation – Institutions may absorb liquidity in the weaker asset while the stronger one holds its ground.
4. Validate with Market Context – Look at macroeconomic conditions, liquidity pools, and institutional activity to confirm the setup.
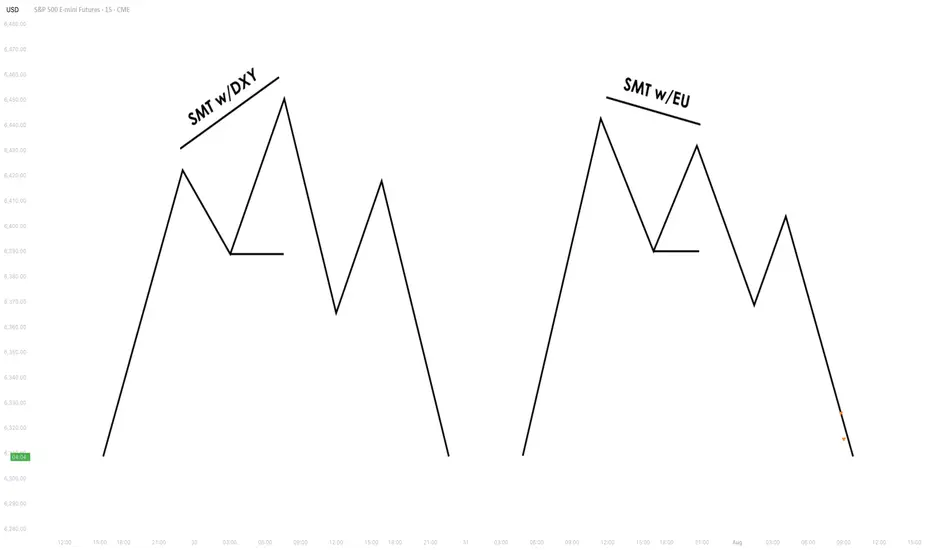
3.2. Bearish SMT Divergence
Bearish SMT Divergence occurs when one correlated asset forms a lower high while another
makes a higher high. This signals hidden weakness, indicating that the market may be setting
up for a bearish reversal.
How to Spot Lower Highs in One Asset While the Other Makes Higher Highs:
1. Find Two Correlated Markets – Common pairs include NASDAQ vs. S&P 500 or EUR/USD vs. GBP/USD.
2. Identify the Divergence – One asset makes a higher high, while the other fails to follow and forms a lower high instead.
3. Liquidity & Volume Analysis – Smart money may be using the stronger asset to attract buyers before reversing.
4. Confirm with Institutional Order Flow – Watch for liquidity grabs and imbalance zones.
3.3. Intermarket SMT
Definition : Divergence between assets from different markets, such as Forex vs. Commodities, Stocks vs. Bonds, or Indices vs. the U.S. Dollar.
Examples :
EUR/USD vs. DXY (U.S. Dollar Index) – If EUR/USD forms a higher low while DXY makes a
higher high, this suggests USD weakness and potential EUR/USD strength.
NASDAQ vs. S&P 500 – If NASDAQ makes a higher high but S&P 500 doesn’t, it can indicate
a weakening stock market rally.
Strength & Validity :
High validity because institutions hedge positions across different markets.
3.4. Intramarket SMT
Definition : Divergence within the same market (e.g., multiple Forex pairs or stock indices).
Examples :
EUR/USD vs. GBP/USD – If EUR/USD makes a lower low but GBP/USD doesn’t, it could
indicate bullish strength.
Dow Jones vs. S&P 500 vs. NASDAQ – If NASDAQ is making new highs while the Dow lags, it
may signal weakness in the broader stock market.
Strength & Validity :
Still valid but needs additional confirmation (liquidity sweeps, volume analysis).
4. SMT Divergence vs. RSI Divergence
Why SMT Is Superior to Traditional RSI Divergences
1. RSI Measures Momentum, Not Liquidity – RSI divergence is based on momentum shifts,
which institutions can easily manipulate with fake breakouts or engineered price moves.
2. SMT Focuses on Market Structure & Liquidity – SMT divergence detects institutional
positioning by comparing correlated assets, making it harder to manipulate.
3. RSI Can Remain Overbought/Oversold for Long Periods – Markets can continue trending
despite RSI divergence, while SMT divergence often provides stronger reversal signals.
How Smart Money Manipulates Classic Divergence Traders
Liquidity Sweeps – Institutions use RSI divergence to lure retail traders into premature
reversals before executing stop hunts.
False RSI Signals – In trending markets, RSI divergences often fail, while SMT divergence
provides a more contextual view of smart money positioning.
5. Using TradingView for SMT Analysis
To effectively analyze SMT divergence, traders should monitor at least two correlated assets
simultaneously.
TradingView makes this easy by allowing multiple chart layouts. Steps to Set Up Multiple Charts in TradingView:
a. Open TradingView and click on the “Select Layout” button.
b. Choose a two-chart or four-chart layout to compare correlated assets.
c. Sync timeframes across all charts for consistency.
d. Adjust scaling to ensure price action is easily comparable.
Best Pairs to Compare for SMT Analysis:
Forex : EUR/USD vs. GBP/USD, USD/JPY vs. DXY
Indices : NASDAQ vs. S&P 500, Dow Jones vs. S&P 500
Commodities & FX : Gold (XAU/USD) vs. USD/JPY
Bonds & Equities : 10-Year Treasury Yield vs. S&P 500
6. Key Takeaways
SMT divergence reveals institutional intent by showing liquidity accumulation or
distribution through correlated assets.
Bullish SMT occurs when one asset makes a lower low while the other does not, signaling a
potential reversal up.
Bearish SMT occurs when one asset makes a higher high while the other does not, signaling
a potential reversal down.
Best markets for SMT analysis include Forex pairs, indices, commodities, and bonds, where
correlations are strongest.
SMT is most effective near key liquidity levels, such as session highs/lows, order blocks, and
fair value gaps.
SMT is more reliable during high-impact news events, London & New York sessions, and
quarterly shifts, where institutional activity is highest.
SMT is superior to RSI divergence because it reflects real liquidity dynamics, whereas RSI
can produce false signals.
Combining SMT with market structure shifts like BOS and CHoCH increases trade accuracy
and reliability.
Risk management in SMT trading requires stop-loss placement beyond liquidity grabs and a
minimum 2:1 risk-reward ratio.
Mastering SMT helps traders avoid liquidity traps, improve precision, and align with smart
money moves.
SMT divergence is the footprint of smart money—where one market whispers the truth while the other follows the herd.
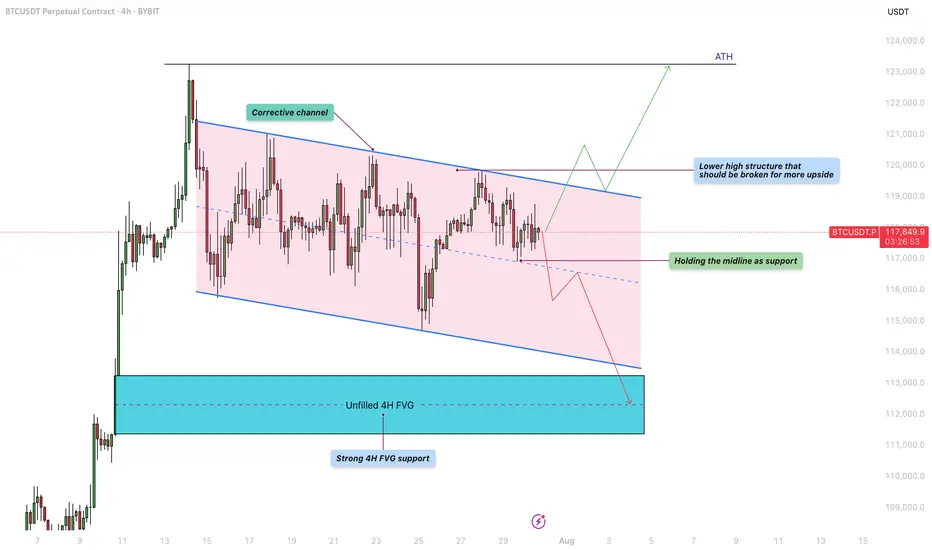
Bitcoin - Will the liquidity at $122K be the next target?Bitcoin is currently trading within a defined corrective channel, which has been developing over the past few weeks. Price action within this structure has been characterized by a sequence of lower highs and lower lows, suggesting a mild downtrend. However, these movements lack strong momentum, indicating that the market is consolidating rather than entering a deeper correction. This kind of structure often precedes a significant breakout, and given the nature of the current price action, a retest of previous highs remains a realistic possibility.
Bullish Scenario
Looking at the overall structure of the channel, a bullish breakout seems increasingly likely. For this scenario to unfold, BTC needs to hold the midline of the channel as support. If this level is respected, it could pave the way for a push towards the upper boundary of the channel and a potential break above the lower high structure near $120,000. A successful breach of that level could trigger a move toward the $122,000 liquidity zone, with the potential to challenge the all-time high (ATH) in the near future. Holding the midline and breaking above key resistance would provide confirmation of strength and continuation to the upside.
Bearish Scenario
On the flip side, if BTC fails to hold the midline as support and starts closing below it on the 4H timeframe, we could see a renewed move toward the lower boundary of the corrective channel. This could lead to a test of the unfilled 4H fair value gap (FVG) highlighted in the chart, located around the $112,000 – $113,000 area. This zone also coincides with a strong historical support level, making it a logical area where buyers might step in and provide the momentum needed for a more sustainable bullish reversal.
Final Thoughts
While both scenarios remain valid, the price structure within the corrective channel currently leans slightly more toward a bullish outcome. The lack of aggressive selling and the potential for liquidity above the previous highs support this view. However, trading is never about certainty but about preparing for various possibilities. Being aware of both bullish and bearish setups allows traders to react with flexibility and discipline depending on how the market unfolds in the coming sessions.
-------------------------
Thanks for your support. If you enjoyed this analysis, make sure to follow me so you don't miss the next one. And if you found it helpful, feel free to drop a like 👍 and leave a comment 💬, I’d love to hear your thoughts!
Results from 7/21/25Just like I said -- it played out
WE hit the Daily FVG and then headed up hard.
If you got in buys this week, COMMENT down below
share why and how.

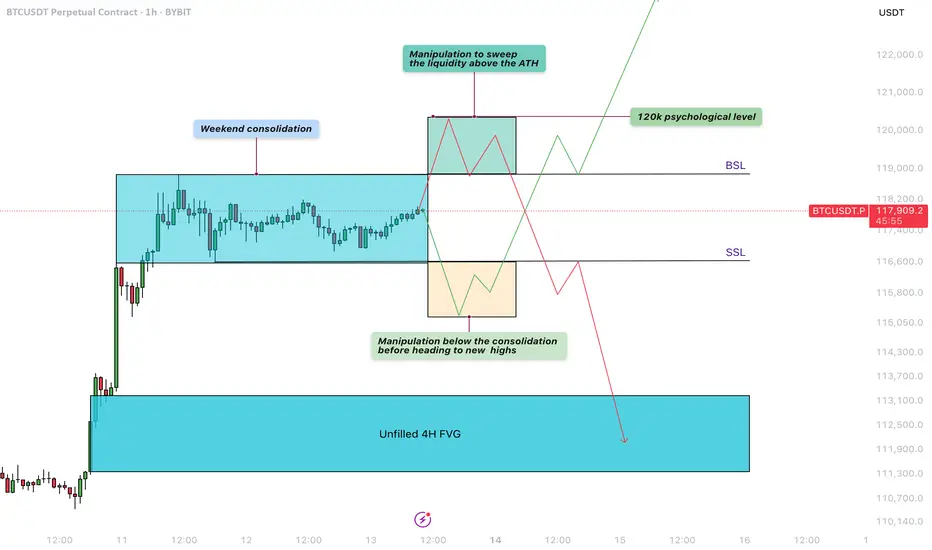
Bitcoin - Liquidity sweep before the next move!Weekend Consolidation
During weekends, Bitcoin often moves sideways as institutional players step back and retail traders prepare for the next move. During this consolidation phase between $117.000 and $119.000, liquidity builds up on both sides—sell-side liquidity below the range and buy-side liquidity above it. After these weekend consolidations, Bitcoin typically sweeps one side of liquidity before continuing in the opposite direction.
Manipulation Above the Buy-Side Liquidity
A significant amount of liquidity has formed just above the all-time high, right below the $120,000 level. Retail traders are positioning for a potential downward move, making this area a prime target for a liquidity sweep. This aligns perfectly with the psychological barrier of $120,000, a level where many traders are likely to take profits.
Manipulation Below the Sell-Side Liquidity
Over the weekend, traders are entering both long and short positions while placing stop-loss orders just below recent lows. This behavior creates a buildup of liquidity underneath the range. Bitcoin could dip below these lows to stop out retail traders before reversing to higher levels.
4-Hour Unfilled Fair Value Gap (FVG)
If Bitcoin sweeps the all-time high and enters a distribution phase, there’s a strong chance it will retrace to fill the unfilled Fair Value Gap on the 4-hour chart at $113.000 - $111.000. This imbalance was created during a sharp move up, leaving behind unfilled orders. Such levels often get revisited as price action seeks to rebalance.
How to Execute This Trade
Wait for Bitcoin to sweep either the low or the high of the weekend range. Avoid entering the market immediately after the sweep. Instead, wait for confirmation that price is returning back inside the range, signaling a clean sweep. On lower timeframes, such as the 5-minute chart, you can look for entry models like an inverse Fair Value Gap to refine your entry.
Final Thoughts
At this point, it’s unclear which direction Bitcoin will take next. The best approach is to wait for a clear liquidity sweep and signs of a reversal before entering any trades. That said, there’s a possibility we may first move up to test and claim the $120,000 psychological level before revisiting and filling the lower 4-hour imbalance zones.
Thanks for your support. If you enjoyed this analysis, make sure to follow me so you don't miss the next one. And if you found it helpful, feel free to drop a like and leave a comment, I’d love to hear your thoughts!
US100 - Reversal after liquidity sweep to target new highs?The chart presented shows a 1-hour analysis of the US100 (Nasdaq 100), illustrating a clean and structured price action narrative. Initially, we observe that the market swept liquidity at the lows, indicated by a sharp wick that pierced beneath the previous support levels. This type of liquidity sweep is common when smart money looks to grab stop-loss orders before reversing the trend.
Liquidity sweep to the downside
Following this liquidity sweep, price action aggressively moved upwards, breaking a lower high structure that had previously marked the bearish control of the market. This break of structure is a key bullish signal, suggesting a shift in momentum from bearish to bullish, and often signifies the beginning of a new upward leg.
1H FVG
An important element on this chart is the 1-hour Fair Value Gap (FVG), initially acting as a bearish imbalance. However, due to the strong bullish momentum, price not only reclaimed this level but did so decisively. As a result, this bearish FVG is now considered a bullish FVG, indicating that it may serve as a support zone on any short-term pullback.
Liquidity taken from the upside
After reclaiming the FVG and breaking structure, price surged further, taking out upside liquidity just above recent highs. This action typically leads to a short-term pullback, as profit-taking and new supply enter the market. The chart suggests that any retracement may find support at the 1H FVG, providing a potential entry point for bullish continuation.
Conclusion
In conclusion, the US100 demonstrated a textbook liquidity grab at the lows, followed by a break in bearish structure, a shift in momentum, and an inversion of a key FVG zone from bearish to bullish. The short-term upside liquidity has been cleared, and the next logical target is the high marked on the chart. Should the price respect the newly formed bullish FVG on any pullback, we can expect continuation toward that upper high, completing the bullish run.
Disclosure: I am part of Trade Nation's Influencer program and receive a monthly fee for using their TradingView charts in my analysis.
Thanks for your support.
- Make sure to follow me so you don't miss out on the next analysis!
- Drop a like and leave a comment!

eurusd outlook Eurusd overall bullish HTF, however I do identify alignments within wyckoff distribution. Keeping an eye on the 4hr sponsored candle, ltf fvg at 1.62 area for my next possible bullish swing into the weekly high. Until then let's see if the market can support short term bearish reversal into the area of interest.

EUR/USD BUY IDEA - SMT WITH GBPHere's my analysis , let me share my A+ set up with you :
1 - WAIT ON ASIA LOW SWEEP WITH EUR / USD
2 - WE WILL POTENTIALLY HAVE A SMT WITH GBP USD IF WE SWEEP ASIA LOW
3 - WAIT ON BOS + FVG IN 5 MIN TIME FRAME
4 - TARGET PREVIOUS WEEK HIGH AS DRAW ON LIQUIDITY
This is what I see happening . After full take profit, we will have our new Weekly Protected High I believe and from there we can start targeting Sellside Liquidity .
I hope you enjoyed the analysis , I will post updates during the day .
Talk to you guys soon ! =D

EUR/USD - Liquidity grabbed! Move towards the 4H FVG next?This chart illustrates a short-term bearish outlook on the EUR/USD currency pair, using smart money concepts like liquidity grabs, fair value gaps (FVGs), and structural levels such as support and protected lows. It is based on the 1-hour timeframe and references a higher timeframe (4H) for added confluence.
Liquidity Sweep
At the top of the recent price movement, a "Liquidity sweep" is marked, suggesting that the market pushed above recent highs to trigger stop-losses of short positions or entice breakout traders before reversing. This kind of move is common in smart money concepts and typically precedes a directional shift, which in this case, is anticipated to be downward. This sweep likely removed buy-side liquidity and indicates that institutional traders may now seek to target sell-side liquidity below recent lows.
Support Zone
The green shaded area labeled "Support" represents a previous consolidation or demand zone that temporarily held price after the liquidity sweep. This zone is seen as a short-term reaction point where price may consolidate or bounce slightly before continuing lower. However, the dashed black line projection suggests that this support is not expected to hold long-term, as price is forecasted to break below it.
Protected Low
A previous low is labeled "Protected low," implying that it hasn’t been violated during recent downward moves. This term often refers to a structural level that, if broken, confirms a shift in market structure. In this context, the projection anticipates that price will break below this protected low, indicating a bearish intent and unlocking further downside movement.
4H Fair Value Gap (FVG)
The large blue zone labeled "4H FVG" marks an imbalance or inefficiency on the 4-hour chart. This zone is referred to as a "Strong bullish 4h FVG," suggesting that once the sell-side liquidity is taken and the lower targets are met, this area is expected to act as a high-probability demand zone. Institutional traders often look for price to fill these FVGs before reversing, as they represent unmitigated institutional orders. The projected path implies that this is the ultimate downside target where price may react bullishly.
Conclusion
Overall, this analysis outlines a bearish short-term scenario for EUR/USD. After sweeping liquidity above recent highs, price is expected to respect the bearish order flow, break through the current support level, and move below the protected low. The ultimate downside target lies within the strong 4H FVG, where a significant bullish reaction might occur. This suggests a classic smart money play, manipulate (sweep liquidity), shift (break structure), and mitigate (return to FVG)—offering a well-structured trade idea for both intraday and swing traders.
Disclosure: I am part of Trade Nation's Influencer program and receive a monthly fee for using their TradingView charts in my analysis.
Thanks for your support.
- Make sure to follow me so you don't miss out on the next analysis!
- Drop a like and leave a comment!

Buys on Gold based on 50% candle range and order blockGold has been dropping but there has been lack of volume which indicates the sellers going out and we just took out the 4hr 50% of the long wick , also having an 1hr Order block, which makes me looking for buys

Mastering Inverse Fair Value Gaps (IFVG) - How to use them?In this guide, I’ll explain the concept of the Inverse Fair Value Gap (IFVG), how it forms, and how you can use it to identify high-probability trading opportunities. You'll learn how to spot the IFVG on a chart, understand their significance in price action, and apply a simple strategy to trade them effectively.
What will be discussed?
- What is a FVG
- What is an IFVG
- What is a bullish IFVG
- What is a bearish IFVG
- How to trade the IFVG
-------------------------------
What is a FVG?
A FVG is a technical concept used by traders to identify inefficiencies in price movement on a chart. The idea behind a fair value gap is that during periods of strong momentum, price can move so quickly that it leaves behind a "gap" where not all buy and sell orders were able to be executed efficiently. This gap creates an imbalance in the market, which price may later revisit in an attempt to rebalance supply and demand.
A fair value gap is typically observed within a sequence of three candles (or bars). The first candle marks the beginning of a strong move. The second candle shows a significant directional push, either bullish or bearish, often with a long body indicating strong momentum. The third candle continues in the direction of the move, opening and closing beyond the range of the first candle. The fair value gap itself is defined by the price range between the high of the first candle and the low of the third candle (in the case of a bullish move), or between the low of the first candle and the high of the third (in a bearish move). This range represents the area of imbalance or inefficiency.
-------------------------------
What is an IFVG?
An Inverse Fair Value Gap (IFVG) occurs when a traditional Fair Value Gap (FVG) is not respected by price, and instead of acting as a support or resistance zone, price breaks through it with strength. Normally, a Fair Value Gap represents a price imbalance left by a strong move, and when price returns to this area, it often reacts by respecting the gap, bouncing off it or reversing, because it's seen as a high-probability level where orders may rest.
However, in the case of an IFVG, price does not respect this imbalance. Instead, it slices through the FVG in the opposite direction, showing that the initial momentum behind the imbalance has weakened or reversed. This breach is a strong indication that market sentiment is shifting. What was once a zone of strength now becomes invalid, and this failed reaction signals that the opposite side of the market (buyers or sellers) has taken control.
The IFVG highlights a key transition in momentum. It tells traders that the prior bias, bullish or bearish, is breaking down, and the new dominant force is pushing price beyond levels that would typically hold. This makes the IFVG useful not only as a sign of failed structure but also as a potential confirmation of a trend reversal or strong continuation in the opposite direction. Essentially, where an FVG usually acts as a wall, an IFVG is what’s left after that wall gets knocked down.
-------------------------------
What is a bullish IFVG?
A bullish Inverse Fair Value Gap (IFVG) occurs when price breaks through a bearish Fair Value Gap (FVG) instead of respecting it. In a typical bearish FVG, the expectation is that when price retraces into the gap, it will react to the imbalance, usually by reversing lower, as the area represents previous selling pressure or inefficiency caused by aggressive sellers.
However, when price does not react bearishly and instead breaks cleanly through the bearish FVG, it signals a shift in market sentiment and momentum. This breakout through the imbalance suggests that buyers are now in control and that the bearish pressure in that zone has been absorbed or invalidated. What was once considered a resistance area is now being overpowered, often leading to continued bullish movement.
-------------------------------
What is a bearish IFVG?
A bearish Inverse Fair Value Gap (IFVG) occurs when price breaks through a bullish Fair Value Gap (FVG) instead of respecting it. In a normal bullish FVG, the expectation is that when price returns to the gap, it will act as support and prompt a move higher, as this area represents a previous imbalance created by strong buying pressure.
However, when price fails to respect the bullish FVG and instead breaks down through it, this signals a shift in momentum to the downside. The anticipated support fails to hold, suggesting that buyers are no longer in control or that their efforts have been overwhelmed by aggressive selling. This kind of move transforms the bullish FVG into a bearish signal, as it confirms weakness in what was previously considered a demand zone.
-------------------------------
How to trade the IFVG?
Trading the Inverse Fair Value Gap (IFVG) requires patience, precision, and clear confirmation of a shift in momentum. The process involves waiting for key conditions to form before entering a trade. Here's how to approach it step-by-step:
First, you need to wait for a liquidity sweep. This means price must take out a recent high or low, typically a short-term liquidity pool, trapping traders on the wrong side of the market. This sweep sets the stage for a potential reversal and indicates that the market is ready to shift direction.
After the liquidity sweep, watch for a 1-minute Fair Value Gap (FVG) to form and then get broken in the opposite direction. This break is crucial, it’s what creates the Inverse Fair Value Gap. The invalidation of this initial FVG confirms that momentum has switched and that the market is no longer respecting the previous imbalance.
Once the IFVG has formed, your entry comes on the close of the candle that breaks and closes beyond the IFVG, above it in a bullish scenario, or below it in a bearish one. This close confirms that the gap has not held and that price is likely to continue in the new direction.
Place your stop loss below the low (for a bullish setup) or above the high (for a bearish setup) of the structure that formed the IFVG. This gives you protection just beyond the level that would invalidate the setup.
-------------------------------
Thanks for your support.
- Make sure to follow me so you don't miss out on the next analysis!
- Drop a like and leave a comment!

Bitcoin - Will it explode up or down?Introduction
Bitcoin (BTC) is currently trading within a symmetrical triangle pattern, forming a series of higher lows and lower highs. This price action indicates a tightening range as the market approaches the apex of the triangle. A breakout is becoming increasingly likely in the coming days, and traders are now watching closely to see which direction BTC will choose. Will it break to the upside or the downside?
Pattern Trading
The symmetrical triangle has been a consistent feature of BTC’s recent price action. Price has been oscillating between the descending resistance and ascending support trendlines, gradually compressing the range. Based on the current structure, Bitcoin could continue moving within this pattern until around June 26th, when the triangle becomes extremely narrow and a breakout becomes imminent. Historically, such setups can produce false breakouts or “fake-outs,” where the price temporarily moves in one direction before sharply reversing and breaking out in the opposite direction. These moves often trap traders who enter too early, so caution is advised. Market manipulation is not uncommon in these tight formations, making it essential to wait for confirmation before entering a position.
4H Fair Value Gap (FVG)
Bitcoin has recently filled a 4-hour Fair Value Gap (FVG), a zone that often attracts price due to inefficiencies in the market. Now that this gap has been filled, there could be increased selling pressure, potentially pushing BTC back down toward the lower boundary of the triangle. If BTC is unable to break through the resistance created by this FVG, we may see more bearish momentum. However, should BTC manage to break and hold above this imbalance zone, it would be a strong sign of bullish intent and could open the door for a move to the upside. For now, though, this area remains a significant resistance level.
Upside Target
If BTC manages to break out of the triangle to the upside with strong volume and confirmation, the first major resistance level is around $109,000. This would be a logical target for bulls, as it represents a key zone of liquidity and previous interest. A successful move toward this level would confirm the bullish breakout and could set the stage for further gains, depending on broader market sentiment.
Downside Targets
Conversely, if BTC breaks below the lower trendline of the triangle, the first area to watch is around $103,500. This level is where a significant amount of liquidity has built up, and it could act as initial support. However, if that level fails to hold, the next key psychological level to watch would be $100,000. A drop below this milestone could trigger panic selling and further downside, especially if market sentiment turns negative.
Conclusion
At this point, BTC is at a critical juncture, and traders should remain patient as the market decides its next direction. While the current rejection from the 4H FVG suggests some short-term bearish pressure, the overall pattern remains neutral until a confirmed breakout occurs. Trading within the triangle can be risky due to the possibility of fake-outs, so it’s best to wait for clear confirmation before committing to a trade. Stay cautious, manage your risk carefully, and prepare for volatility as Bitcoin approaches a decisive move.
Disclosure: I am part of Trade Nation's Influencer program and receive a monthly fee for using their TradingView charts in my analysis.
Thanks for your support.
- Make sure to follow me so you don't miss out on the next analysis!
- Drop a like and leave a comment!

GBP/USD - SMT with EUR/USD, SHORTExcited to share my first idea with you guys !
To start with, my name is Soulayman and have started my trading journey in October 2024. It was very hard at first, but after hard work and dedication we all know we can make it happen. I basically studied ICT concepts, and was able to integrate those into a system that I have built myself ( this is what every trader should do in my opinion, it will make you understand better ).
And that is why I am here today on Trading View, sharing my first ever idea with you guys !
I'll make it very simple , no extravagant analysis or super complicated trendlines all over the place ... =D
This is what I see :
1 - GBP/USD potentially forming a SMT with EUR/USD after sweeping London High located inside a fair value gap (which makes this play stronger)
2- After the sweep occurs, I will be waiting on a 5 MINUTE break of structure (since 1 min break outs are manipulation most of the times so i prefer to stay safe). If this is followed by a fair value gap, it reinforces our idea showing the market has intent to push price lower.
3 - Now , let's talk about the HIGH TIME FRAME structure (4H) clearly shows the price wants to sell and that it is targeting Sellside liquidity Equal Lows. We could than anticipate a reversal from there.
We currently have price pulling back towards the HTF FVG, failed to close above the most recent high and having bearish reaction.
Since everything aligns with our BIAS, we will let it play out and wait on the sweep !
I will be posting updates during the day =D
Stay tuned ! Talk to you guys soon !

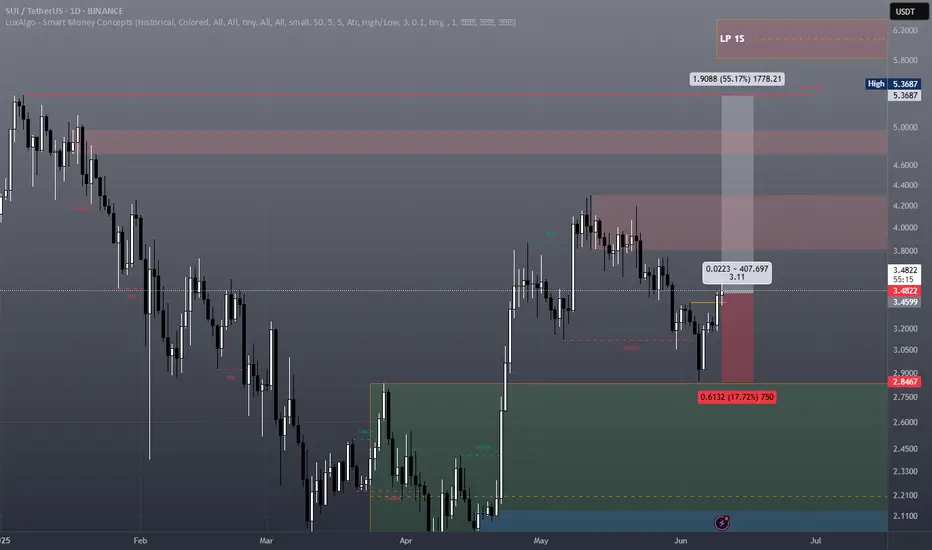
SUI - SWING TRADESUI – Swing towards the ATH and aiming to create a new one, reacting within a weekly Liquidity Pool between 5.83 and 6.35.
LFG!
BULLS VS BEARS. WILL GOLD MATCH THE ATH?Glossary:
Ged = Bearish scenario
Green = Bullish scenario
POI = Point of interest
ATH = All time high
LQ = Liquidity zone
Gold since the beginning has been moving in a range and break fashion you'll see this across the board, always. A 4hr range is in the process of being formed ideally what wed like to see is for the high to be matched first. That simply would give more confidence for the bears to get in and short the market however now we sit with the though of where will it go first?
preferred bias
Buys to sell, ideally and the most logical outcome is the highs do get matched forming a strong liquidity zone that can be targeted at a future date, as price begins to fall new points of interest can then be formed (since there isn't a lot to target above right now), this will allow the market to have areas it can market when we see the bullish side of this range play out when ever that may be.
Structure
Current structure allows you to get in trades, previous structure allows you to get out of trades use it to your advantage, think. where does the money want to move next where will the banks get the best bang for their buck and most importantly where can we cause traders to LOSE, a trade you win is a trade someone else lost. so long you stick with where the big guys want to go you'll be on the right side
Bullish bias (green)
Key points get broken, imbalance fill, ATH matched (this is where short orders get stacked, future sweep target.
Bearish bias (red)
Area 1, this is the first key low im looking to break if we see a candle close below continue to area 2, there are traders who WILL get stopped out at zone 1
Area 2, this is our next key point in structure there will still be traders with open positions here also, again if we see a candle close below this zone continue to monitor for Area 3
Area 3, this may be a final target, however there's still POI's sat below if price shows strong signs of bearish momentum target Areas 4 and below can be open for discussion
Conclusion
personally i would like to see POI's built on the buy side as of right now before we move down simply because the market NEEDS somewhere to move from and to without that it would be erratic.
If you found this helpful be sure to boost this idea, give a like and a follow, consistent charts will be posted on a weekly basis and let me know what you think down in the comment section too :)

BULLS VS BEARS WILL GOLD MATCH ATH?Glossary:
Ged = Bearish scenario
Green = Bullish scenario
POI = Point of interest
ATH = All time high
LQ = Liquidity zone
Gold since the beginning has been moving in a range and break fashion you'll see this across the board, always. A 4hr range is in the process of being formed ideally what wed like to see is for the high to be matched first. That simply would give more confidence for the bears to get in and short the market however now we sit with the though of where will it go first?
preferred bias
Buys to sell, ideally and the most logical outcome is the highs do get matched forming a strong liquidity zone that can be targeted at a future date, as price begins to fall new points of interest can then be formed (since there isn't a lot to target above right now), this will allow the market to have areas it can market when we see the bullish side of this range play out when ever that may be.
Structure
Current structure allows you to get in trades, previous structure allows you to get out of trades use it to your advantage, think. where does the money want to move next where will the banks get the best bang for their buck and most importantly where can we cause traders to LOSE, a trade you win is a trade someone else lost. so long you stick with where the big guys want to go you'll be on the right side
Bullish bias (green)
Key points get broken, imbalance fill, ATH matched (this is where short orders get stacked, future sweep target.
Bearish bias (red)
Area 1 , this is the first key low im looking to break if we see a candle close below continue to area 2, there are traders who WILL get stopped out at zone 1
Area 2 , this is our next key point in structure there will still be traders with open positions here also, again if we see a candle close below this zone continue to monitor for Area 3
Area 3, this may be a final target, however there's still POI's sat below if price shows strong signs of bearish momentum target Areas 4 and below can be open for discussion
Conclusion
personally i would like to see POI's built on the buy side as of right now before we move down simply because the market NEEDS somewhere to move from and to without that it would be erratic.
If you found this helpful be sure to boost this idea, give a like and a follow, consistent charts will be posted on a weekly basis and let me know what you think down in the comment section too :)

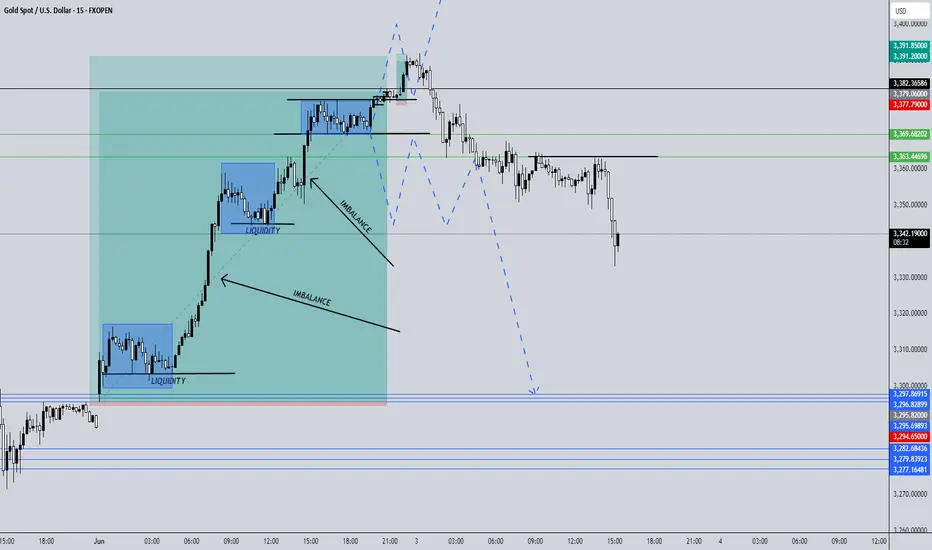
BULLS VS BEARS ? BEARS.gold moves in a simple pattern range then break. ALL THE TIME
pair that with injected money and liquidity targets you grant yourself the perfect area to get in and out
building upon the set ups looked at yesterday the bearish outcome is playing out well
this shows the importance of always having 2 scenarios not to play both sides. but to simply be able to pivot when the market does aswell
looking for a re entry off the first long position if gold shows signs of wanting to create a text book example of a supply and demand zone
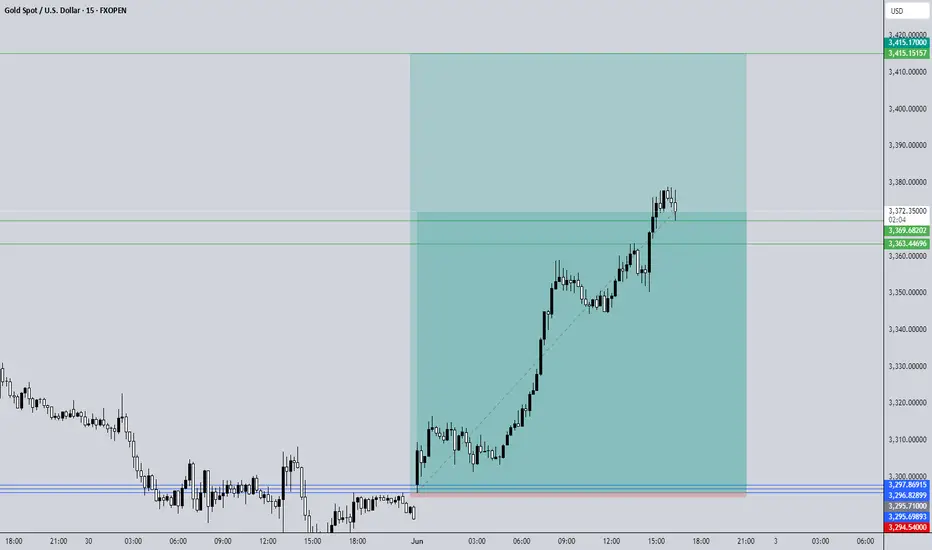
XAU/USD BUYthis idea stems from simple SMT concepts price will move the POI's ( this is money sat in the market either by traders= liquidity or money being injected = imbalances. by following these 2 areas you'll be able to gauge where price needs to go based off of structure.
Structure is where people got in lower highs traders get in, double top or bottom traders get in and you'll always see the market come back to these places, where they get in that's where we want to get out i see gold running higher than where we currently are with a final take profit marked at 3439 before price moves remember it needs a POI to move from
BULLS VS BEARS GOLD2 possible scenarios could be playing out on gold as of right now.
a 15 minute range has formed giving liquidity on both sides
wait the market out see what it tells you to do and not what you want to do
liquid highs have been taken price may take the lows before us seeing a continuation
on the flip side lows may be taken if bullish structure breaks look for shorts if we hold bullish structure continue long
THIS IS NOT FINANCIAL ADVICE YOU ARE RESPONSIBLE FOR ANY TRADES YOU TAKE

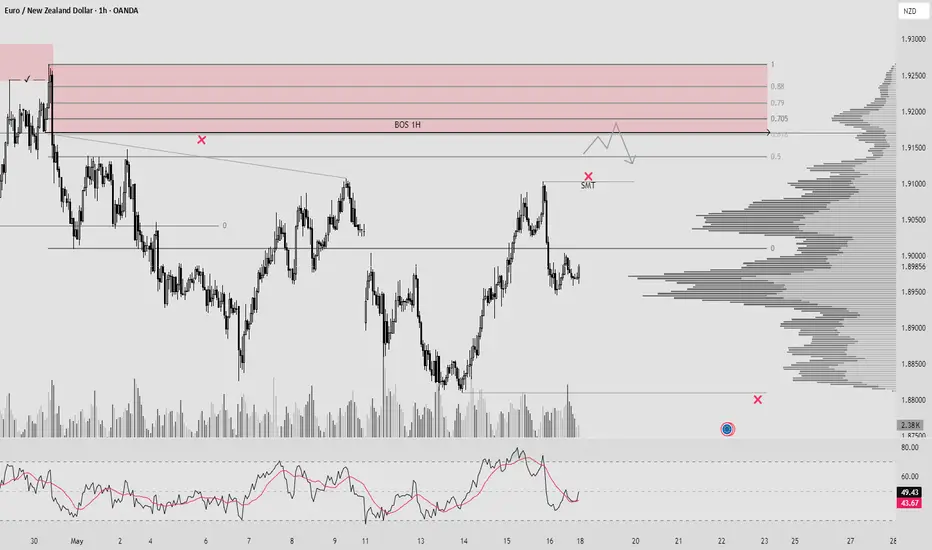
EURNZD (BOS 1H + INDUCEMENT + OTE + SMT + ORDER FLOW) Hello traders!
As you can noticed, we have unmitigated BOS on 1H - which is also our Supply Zone, under zone price built liquidity and make even SMT(Fake BOS). In Supply zone expecting reversal.
Have a profitable day and don't forget to subscribe for updates!
What Is SMT Divergence, and How Can You Use It in Trading?What Is SMT Divergence, and How Can You Use It in Trading?
SMT divergence, or Smart Money Technique divergence, is a concept used by traders to analyse imbalances in correlated markets. By identifying when price movements deviate between related instruments, traders can uncover potential shifts in market momentum, often linked to institutional activity. This article explores what SMT divergence is, how SMT divergence trading works, and its practical applications.
What Is SMT Divergence?
SMT divergence, short for Smart Money Technique divergence, refers to a specific type of price discrepancy between two correlated financial instruments. Part of the Inner Circle Trader (ICT) methodology, this divergence is often interpreted as a sign of institutional or "smart money" activity, as it highlights potential inefficiencies or imbalances in the market.
Here’s how an ICT SMT divergence works: correlated instruments—like EUR/USD and GBP/USD in forex, or major stock indices like the S&P 500 and NASDAQ—typically move in the same direction under normal market conditions. SMT divergence occurs when one instrument makes a higher high or lower low, while the other fails to follow suit. This inconsistency suggests that buying or selling pressure may be uneven across these markets, often caused by larger market participants adjusting their positions.
For example, if EUR/USD forms a new high, while GBP/USD lags behind and fails to break its previous high. This divergence could indicate waning momentum in one pair, hinting at a potential reversal or shift in the overall market structure. Traders analysing SMT divergence often see these moments as key opportunities to assess whether institutional players might be involved.
To identify an SMT divergence, you can monitor two correlated assets’ charts and observe discrepancies. Also, there are SMT divergence indicators for MT4, MT5, and TradingView available online that can automate the process.
The Core Components of SMT Divergence
SMT divergence relies on three key components: correlated instruments, divergence between price movements, and the involvement of institutional players. Understanding these elements is crucial for applying this concept.
1. Correlated Instruments
At the heart of SMT divergence is the relationship between correlated markets. These are instruments that typically move in tandem due to shared economic drivers. For instance, in forex, pairs like EUR/USD and GBP/USD often exhibit similar trends because they’re influenced by the strength of the US dollar, as well as their close regional ties and trade relationships. In equities, indices like the Nasdaq 100 and S&P 500 often align because they reflect broader market sentiment and contain overlapping stocks.
2. Divergence in Price Movements
The divergence occurs when these typically correlated instruments fail to move in sync. For example, one instrument may reach a higher high, while the other stalls or even reverses. This mismatch is more than just noise—it can signal a deeper imbalance in the market, often linked to uneven supply and demand dynamics. It’s these price discrepancies that traders scrutinise to identify potential turning points.
3. Institutional Activity
One of the reasons SMT divergence is so closely watched is its potential link to smart money behaviour. Institutions often use correlated instruments to mask their actions, creating subtle imbalances that only become apparent through careful analysis. For instance, when one correlated pair lags, it might reflect deliberate accumulation or distribution by larger players.
How Traders Analyse SMT Divergence
Analysing SMT divergence helps in understanding the nuanced relationship between correlated instruments and interpreting these imbalances correctly. Unlike leading correlations—such as oil influencing the Canadian dollar—SMT divergence doesn’t rely on one asset consistently driving the other. Instead, it focuses on shifts in momentum where neither instrument is the leader, but their combined behaviour hints at potential market moves.
Identifying Divergence
Traders start by observing price action in two correlated instruments or timeframes. SMT divergence becomes apparent when one instrument forms a higher high or lower low, while the other fails to do so. For example, if EUR/USD makes a higher high, but GBP/USD stalls below its previous peak, this inconsistency could signal fading bullish momentum in the broader market. The key is that neither asset leads; instead, the divergence itself provides the signal.
Some common correlations traders use include:
- Forex Pairs:
EUR/USD and GBP/USD
USD/JPY and USD/CHF
DXY and USD/CAD
- Cryptocurrencies*:
BTC/USD and ETH/USD
- Equity Indices:
S&P 500 and NASDAQ
FTSE 100 and DAX
- Treasuries:
US 10-Year Treasury Yield and USD/JPY
- Commodities:
Brent Crude and WTI Crude Oil
Interpreting Divergence at Extremes
SMT divergence is particularly significant when it occurs at market highs or lows. When divergence appears at highs—such as one instrument making a higher high while the other fails—it often signals a potential bearish reversal in the stronger instrument. Conversely, at lows, if one makes a lower low while the other holds firm, it may indicate a potential bullish reversal in the weaker one. This imbalance highlights where momentum might shift.
Adding Context
Traders rarely rely on an SMT divergence strategy alone. They often look for supporting evidence, such as volume analysis, market structure shifts, or order flow data, to confirm the signal. For instance, divergence combined with signs of institutional selling near a high could strengthen the case for a bearish move.
SMT Divergence in Different Market Conditions
SMT divergence behaves differently depending on market conditions, offering traders insights that vary between trending and ranging environments. Its effectiveness hinges on the context in which it appears, so understanding how it adapts to different scenarios is key.
Trending Markets
In trending markets, SMT divergence often signals potential reversals or pauses in momentum. For example, in a strong uptrend, divergence at a new high (where one correlated instrument makes a higher high while the other does not) can indicate waning buying pressure. This inconsistency might suggest that institutional players are beginning to reduce their positions or shift market direction.
A similar principle applies in downtrends: divergence at a fresh low, where one instrument breaks lower while the other doesn’t, could signal that bearish momentum is losing steam. Traders often use these moments to reassess their analysis and consider the possibility of a reversal or pullback within the trend.
Ranging Markets
In a range-bound environment, SMT divergence takes on a different role. Rather than hinting at trend reversals, it often highlights potential breakouts or false moves. For instance, during a consolidation phase, if one correlated instrument makes a sharp move outside the range while the other stays contained, it may signal that the breakout is unsustainable and a reversal back into the range is likely.
Alternatively, if both instruments diverge significantly at the edges of the range, it could suggest that smart money is accumulating or distributing positions in preparation for a breakout.
Different Asset Classes
SMT divergence isn’t limited to one market type. In forex, it often reveals imbalances caused by macroeconomic drivers like central bank policies. In equities, it can signal sector rotation or institutional adjustments. Commodities, particularly oil or gold, may show divergence influenced by supply and demand dynamics.
Limitations and Common Misconceptions
While SMT divergence is a powerful tool for analysing market imbalances, it’s important to understand its limitations and avoid common misconceptions. Misinterpreting divergence can lead to flawed decisions, especially if it’s viewed in isolation or without proper context.
Limitations
- False Signals: Not all divergences indicate institutional activity or meaningful shifts in the market. Low liquidity or erratic price movements can create divergence that doesn’t hold significance.
- Context Dependency: SMT divergence requires a solid understanding of market conditions. Its reliability decreases in highly volatile or choppy environments where correlations break down temporarily.
- Not a Standalone Tool: Relying solely on SMT divergence can be risky. Traders use it alongside other forms of analysis, such as market structure or volume data.
Common Misconceptions
- Always Linked to Institutional Activity: Not every instance of SMT divergence involves smart money. Divergences can also result from retail trading activity or macroeconomic events.
- Predicting Market Direction: SMT divergence doesn’t guarantee outcomes; it highlights imbalances. Further analysis is needed to evaluate whether the market will reverse, continue, or consolidate.
- Universal Applicability: While it works across various markets, not all instruments are equally suitable for SMT divergence due to differences in liquidity or drivers.
Practical Applications of SMT Divergence
SMT divergence is a versatile analytical method that traders use to refine their strategies and deepen their understanding of market dynamics. Here’s how it’s typically applied in practice:
Identifying Market Turning Points
One of the most common uses of SMT divergence is spotting potential reversals. When divergence appears at key highs or lows, it often signals that momentum is shifting. When combined with other common trading tools, such as support and resistance, as well as ICT methodology concepts like order blocks and fair value gaps, this can be used to time entries or adjust risk exposure.
Potentially Enhancing Risk Management
SMT divergence can potentially enhance risk management by offering early warnings about changes in market conditions. If divergence aligns with other factors—such as weakening volume or significant resistance/support levels—it can serve as a signal to tighten stops or reduce position sizes, depending on the trader’s broader approach.
At the same time, it can also provide clear boundaries for setting stop losses. If a trader has confidence that a reversal in one asset is likely due to an SMT divergence, then a stop loss can be placed immediately after the maximum or minimum of the divergence.
The Bottom Line
The SMT divergence is a valuable tool for understanding market imbalances and spotting potential turning points. By combining it with other analysis methods, traders can gain deeper insights into price action.
FAQ
What Does Divergence Mean in Trading?
Divergence in trading refers to a mismatch between the price action of an asset and a technical indicator or between two correlated instruments. It often signals a potential change in trend, as the imbalance suggests a shift in market momentum.
What Is SMT in Trading?
SMT in trading stands for Smart Money Technique. SMT divergence is one of the ICT trading concepts. It focuses on identifying market imbalances that may reflect the activity of institutional traders, seen through divergence between correlated instruments.
What Does SMT Divergence Mean?
The SMT divergence meaning refers to an occasion when two correlated instruments fail to move in sync. One can make a higher high while the other does not or one can make a lower low while the other doesn’t. This indicates potential smart money involvement and signals a possible trend shift.
What Is an Example of SMT Divergence?
A common example is in forex, where EUR/USD forms a higher high, but GBP/USD does not. This divergence could suggest fading bullish momentum, signalling a possible reversal in EUR/USD.
What Is the Strongest Divergence Indicator?
While SMT divergence itself is powerful, traders often combine it with indicators like RSI or volume profiles for added confirmation. The strongest signals come from divergence paired with a broader market context.
*Important: At FXOpen UK, Cryptocurrency trading via CFDs is only available to our Professional clients. They are not available for trading by Retail clients. To find out more information about how this may affect you, please get in touch with our team.
This article represents the opinion of the Companies operating under the FXOpen brand only. It is not to be construed as an offer, solicitation, or recommendation with respect to products and services provided by the Companies operating under the FXOpen brand, nor is it to be considered financial advice.

Class A/B RSI Bearish Divergence on SPY Futures?Really posting here to see if anyone would validate this for me but I was looking on the chart and this idea came about. On the weekly chart for ES1!, there seems to be class A or B Bearish Divergence developing on the Weekly timeframe.
Listen, of course we all know SPY trends upwards over time but is this an indicator of a larger sell the market needs to go higher every once in a blue moon? This is guarenteed a macro trend and I probably will have to wait a year for this analysis to play out but hey, at least we're here. (***ponders on how I charted Gamestop at $10 but never traded because of lack of knowledge***) Anyways, this is something I will of course monitor but let me highlight instances in history this has happened. Please feel free to give your input on this analysis!
Jan 1998 thru Apr 2001 (News Driver: Dot-Com Bubble)
Price makes higher highs from Jan 98' thru Mar 00'
From Mar 98' thru Mar 00', the 3 peaks formed on the RSI leading to price establishing a lower high (SMT) on Sep 00'. Fails to make new all-time high
From Sep 00' to Apr 01' price moves down as much as 30% over the next 224d
Jan 2013 thru Feb 2016
Price makes higher highs from Jan 13' thru May 15'
From May 13' thru Jun 14', the 3 peaks formed on the RSI leading to price establishing a lower high (SMT) Jul 15' and a following lower high on Nov 15'
From Jul 15' to Aug 15' (42d) (News Driver: Lagging China Market) price moves down as much as 14% and as much as 14% on the Nov '15 lower high to Jan 16' (78d) (News Driver: Oil Prices)
Current: Jan 24' thru Nov 24'
Price has been making higher highs all year
From Mar 24' thru , the RSI has been making lower highs while price is making higher highs
We are now at a point where price is pushing to go higher but what I would want to see based off of historical data is for price to consolidate or some type of Bearish Turtle Soup forming. If this happens and the RSI returns to Fair Value, we could be in for a sizeable sell of for at least a couple of weeks in the near future.
I will come back to this in the next few months. Happy Trading!

Swarm Markets still in a downtrend. Give me a chochSMT is still in a clear downtrend with no clear signs of a market structure pivot. A choch will provide evidence that the bulls are ready to respond. The momentum is looking good as it is diverging bullish however, the price has yet to get any follow-through.
Full TA: Link in the BIO
