EURUSD Potential Longs before FOMC on Wednesday.EURUSD has made a beautiful leg down on the 4H and on Monday (yesterday), we initiated a pullback phase. 1H has already changed and I am looking for potential longs into the 4H sell area, which is above 50% of the overall leg!
I also share some long zones on the 15M:
Sniperentry

GBPJPY trade idea... How to Get a Sniper EntryGBPJPY trade idea... How to Get a Sniper Entry
I missed my entry! Danggit! But I believe there is a teaching moment here. In this video, I would like to share with you how to get
a sniper entry and maximize your risk to reward for bigger profits!
Macro analysis to micro executions.

SNIPER ENTRY ON GBP/CADPlease trade with your own risk... you can check my previous setup.. i only publish high quality analysis. good luck all trader.
follow me to get my idea and setup

Sniper entry on the EUR USDOn the two hour chart there was a retracement then scaling down on the 15 min for a sniper entry.

USDCAD IDEA COMPLETEThe idea was completed
Reversed at the first reversal point
Then dropped all the way to the TP
70pips profit

GBPJPY SHORTYes, it seems to me that after Brexit Great Britain is slowly losing economic stability. I think we can get ready for a longer short. Haha, yes I am HnS mental ... We are now on the top of the right arm so this is the best time for entry! Price is creating double top with top from august 2020 . Keep in mind that we are entering the March 2020-covid zone ... a zone full of surprises :)Look at the areas marked in the ellipses ... if you deduce what and how it will make your life easier :)
sl:20 pips above the highest red zone
tp1: 140.445
tp2:139.700
Yellow zones is mostly s/d area(h4-d1), red zones is major areas of overlapping multiple confirmations in one place.
If u have any questions just msg me amilerski@icloud.com
~~the market is always right...not you ~~
:)

GBPJPY LongLets see... Price consolidating right now. Waiting on last wave to complete. Target came from fibb exp ran on the H4 TF.

GBPJPY LongI do not have any doubts that this pattern will emerge, but I do know that I've seen it on the smaller TFs up until now. If you're in a buy, be patient. Price may drop closer to NY close, but will most likely consolidate for the next two sessions. You have to make the choice to get in on this pair because the bears will bring in the volume and chase those lows. Being aware during minor structure break assisted me a lot in these positions.

EURNZD to 1.70500Just examined the weekly timeframe, wicks thrown to the upside at a significant zone/resistance, the daily makes the price action more clear as we can identify the sellers are present at the resistance(purple zone) identifying the lower timeframe price action, market came back to a huge liquidity spot, and now momentum has kicked in(as the 15M timeframe bullish market structure has been violated, we now see first signs of the bear rally as price breaks major lows and 15M key levels) this behavior and structural behavior pattern tells us that orders has been filled and we can expect a new bear rally to 1.70500 or even lower as price is just correcting itself(ranging, showing indecisions, exhausting) from an initial impulse move to the downside for another bearish rally/leg however a break above of the purple zone would invalidate the trading setup..
For the time being, my targets at 1.70500 as its a good psychological round off number!

This can be a good place to join short position on GBPAUD. 1. Price has been using 20MA as dynamic resistance on its downward path.
2. 20MA is preparing for a cross with 200MA to the downside.
3. Price is at fib level of move AB. This fib level confluences with 20 and 200MA, acting as resistance.
4. Price is currently showing rejection around this area.
Though bulls have flexed their muscles strongly for this correction, these confluences suggest that price is around an area where we can expect opposing pressure to step in and take price down again. It will be better timing to wait for a bearish reversal pattern and enter at the open of the next candle following the reversal pattern.

TEA CUP ANALYSIS LONG1st step: Looking for a bearish Candle followed by a bullish candle, even or close to the bottom of the body7
2nd step: The 3d candle must be a higher high or higher low, 85%-95% of the time the 3d candle is a higher high
3d step : Place a horizontal line at the bottom of the body of the bearish & bullish candle
4th step: The number attached to your horizontal line is your BUY LIMIT price
LET'S SEE.. ( I am already in )
---> LET ME KNOW IF YOU LIKE MY IDEA AND IF YOU ACCEPT IT :)
WISH YOU GOODLUCK AND A BEAUTIFUL AND PROFITABLE WEEK

USDJPY Ideas2 potentia plays for UJ, We could see a retracemtent down to 106.015 before heading up to 106.650.


Fancy a QuickyWe should see a retest of the support level. What makes this a more desirable trade for be is the trend line is a nice confluence.
Quick trade easy 30 pips. We love sniper set ups


Gold LongExtremely nice liquidity sweep on the 1hr.
Overall Structure remains bullish so we should see a little pullback before shooting to the upside.
Happy Trading

Plausible Sunday Snipe set upGBPAUD coming off a strong push up from last week. . .
I can see a correction/retracement into back to key zones of Interest before going up
Wyckoff accumulation possible spring pushing up then possibly correcting into a "spring Range " for Reentry Buy opportunities . . . .
Set alarms for key zones 1.795-1.79000 (half & Quarter LEvels alarms for buy in if price delivers specific acumm lower time frame fracal buy in with narrow parameter of risk as always
HAppy trading HAppy week Let's stay in Abundance ;]

EURAUD 4H Analysis.I expect price to break the trend line and rally up to form a double top pattern, then continue in its bearish move to the down side.

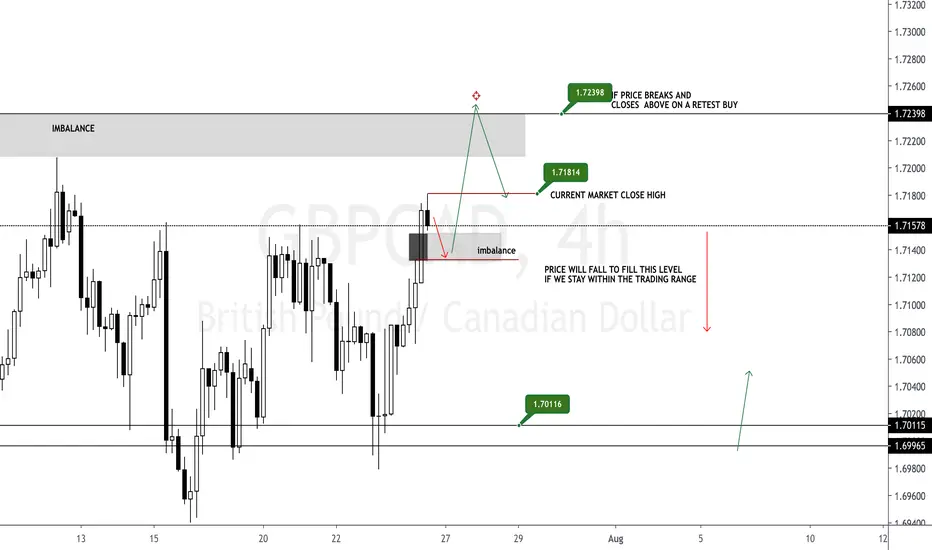
THE KEY AREAS FOR GBPCAD THIS COMING WEEK WE WILL HAVE OUR EYES ON THESE
SIGNIFICANT LEVELS FOR GBPCAD WHEN TRADING THIS PAIR
OUR PERSONAL BIAS IS FOR BUYS SHOULD WE KEEP MOMENTUM
TO BREAK THE RANGE
HOWEVER WE STAY PREPARED TO ADJUST TO MARKET FLOW
AND SHOULD WE STAY IN THE RANGE WE LOOK TO TRADE
THIS PAIR BACK DOWN TO THE KEY LEVELS
WHAT ARE YOUR THOUGHTS?
USDCAD short Waiting for a nice retest after the sell off but price can wick past to hunt stoploss's... however we maybe range bound

EURGBP 4H AnalysisProposed short position for EURGBP. Waiting for price to fail at the resistance zone, or a reversal pattern, then I go short on the trade.

EURUSD COULD WE WITNESS THE DROP?Could we witness the drop this coming week on EURUSD? so many short traders are waiting for
this epic fall! lets see how the Numbers do for the DXY but my bias is to the down side
should we get the momentum on the DXY
what are your thoughts do you see this different;y? comment and let me know
