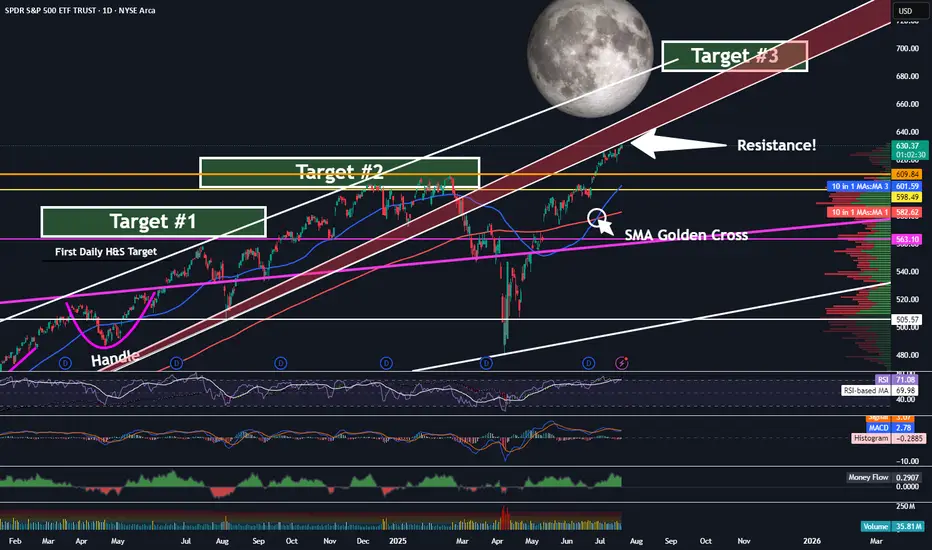
SPY - On Our Way To Target 3 ...But First?Trading Fam,
It's been a while since I updated you all on the SPY, which, as you know, we track closely to help us determine the overall market trend. Since we have now exceeded my Target #2, it's time for me to give you all another update. But first, a little context for my new readers which I have been getting a lot of recently, thanks to my new indicator hitting it out of the park.
So, we began marking targets on our chart here after spotting an inverse H&S on the daily chart a few years ago. Many of my followers back then were doubtful the pattern would fully form, or if it did, that it would actually play out. But the pattern completed about 14 months ago and subsequently broke the neckline in June of last year. I then knew we were going full send and have been predicting a 700 SPY final target since. This target has been made utilizing both that inverse H&S pattern as well as a longer-trend Elliot Wave, which I don't have denoted here at this point. The chart gets too messy with all of my markings. Regardless, we are currently in wave 5 and heading steadily towards that 670-700 target #3, my final target.
But be careful! Today, we have hit the underside of that RED area, which is HUGE resistance. I would expect that we will NOT break straight through this without some pullback prior. Indeed, the market is overextended at this moment, and we'll need the volume to be able to push through. Could this occur? Of course, anything is possible. But, it is not likely right now.
My guess is that we'll at least pull back to one of those levels below us or possibly even re-touch that 200 SMA in red before the final push.
Anyways, it is worth taking note of what may be ahead of us in the next few weeks or months so that you can plan your trades accordingly. Stay with me. We're almost there.
✌️Stew
SNP
What Is The Market Waiting For?Good Morning Trading Fam,
Our stock and crypto markets seem to have stalled. You may be wondering what they are waiting for. Quite simply, the S&P 500 has reached a double-top. That's all. There may be some more pause here for the next week or so. Barring any significant bearish geopolitical or other events, I expect us to move higher. Any FUD at all will send the market back down again. So yes, unfortunately, the next move(s) will be mostly predicated on news. Traders are rather fragile rn. Trade accordingly.
Best,
Stew

ES1 2025-03-31 SPOOZ 15minOBHello everyone, I hope you won, stayed out, or learned something form the market today 😂.
Today was a easy grab.
Drawdown: 17. Tics
TP: 111. Tics Grabbed (out of 438)
Spooz Open Manipulation,
Broke near high,
Retraced to 15min Order Block,
TP Hit at 3 equal Highs (volume).
If you found this inciteful, join our group discussion! (link in bio)

Combined US Indexes - Time to make a Lower HighFrom the last time, the Combined US equity indexes did keep into the Extension Zone (EZ) as marked out. This Zone is defined from the lowest point of the TD Setup and the range is determined by the range of the candle that has the lowest point, this case being Candle 9 (4 March).
So after the expected two week in the EZ, we see an indication of the week ahead to continue the Sell Setup and break out of the EZ for the week, at least from mid-week where it would be candle 9.
According to TD rules, this Sell setup is NOT bullish, and can be expected to turn further down from resistance (Orange Line). This orange line is determined from the weekly chart where there is an ongoing TD Buy Setup (bearish) that needs to be kept intact for the trend to continue.
So, based on the techincals, the combined US equities may be seeing a last week of bullishness which goes through the yellow ellipse, then face strong resistance and continue the main Bearish trend (as depicted by the prevailing Buy Setup (20Feb to 4Mar). Noted that the main trend changed to Bear once the TDST was broken down on 3Mar.
Here are very good live examples for those keen on (Thomas) Demark indicators; watch and wait for it to develop...

Hellena | SPX500 (4H): LONG to the area of 6136.8 (Wave 3).Colleagues, I believe that wave “2” has completed its development and now I expect the upward movement to continue in wave ‘3’, which should break the maximum of wave “1”.
So far, I set the target as a minimum in the area of 6136.8.
Manage your capital correctly and competently! Only enter trades based on reliable patterns!

SPY Gap Filled - Local Bottom - More SendTrading Fam,
I am not overlooking the small H&S pattern seen on this chart. I am simply presenting alternative data. What if that H&S pattern fails? It can happen. Even if we do drop further, our target down is that pink horizontal trendline. Will we get there before more buying ensues? Possibly. But this market is still bullish. The larger bull trend is still very much in tact.
Additionally, we can see that an important gap has been filled. Therefore, it is very possible that the small H&S pattern we see here will not reach its target down. If that is the case, we'll turn up again, continue through my Target #2 which was already hit, and proceed onward and upward to my final Target #3 (670-700) until that is reached sometime in 2025. Therefore, you are not wrong to start DCA'ing in at this point.
✌️ Stew

SG10Y - a peek into the next few weeks.As pointed previously for the last few years... the SG10Y Singapore Govt 10 year Bond Yields chart have an uncanny correlation to give us a heads up on when the US Equity markets like the S&P500 SPY SPX are going to keel over and drop.
On such instance is here and now.
A higher high and a clear breakout after a Fibonacci retracement, within a bigger retracement. This is a clear and present indication that (US) equity markets are going to keel over and drop.
Bears are just around the corner.
Pain till Mid-Feb
Heads up.

Combined US Equities - not nice end, not expecting a great startQuick analysis of the Combimed US Equities daily chart...
A significant rebound last week put the closing back into the decision box. Thing is, it went out the other end, as expected it would, BUT ended with a doji (indecision candlestick) and came back into the box... which suggest an exit to thru the lower end. This is abou to happen over the last days of the 2024.
And IF it exceeds the last low, then it is a tell all that 2025 is not going to be bullishly exciting.
In any case, a good retracement is overdue and likely comes in 1Q2025
Technicals here show weakening MACD and a decelerating rate of VolDiv.
Let's see how bullisht the first day of 2025 and the first week of 2025 can be... not terribly optimistic IMHO.
In any case... HAPPY NEW YEAR 2025 everyone!
Stay safe and stay happy!

SG10Y SG Govt Bond Yield UNCANNY heads up on US EquitiesHere is a rehash of the relationship between the Singapore 10Y Govt Bond Yields and US Equities ETF, SPY (Blue Line).
Noted that when the SG10Y technically breaks out, the SPY technically breaks down, and vice versa.
This is not 100% but happens an estimated 80% of the time, and recent occurences since September are marked out with bullish green or bearish red time lines, respective to SPY from the SG10Y leading indications.
Just middle of this past week, the SG10Y spiked strongly and broke out, the next day saw the SPY tank significantly. In fact, the MACD for the SG10Y had already pre-warned of the breakout two days earlier!
Given the current set up, as usual, I do my technical and charting projections. And in this case, it is clear that the Santa rally fizzled, year closign and next year opening should be weak until early February. Now, if this projection works as it should, then we would likely see a weak 2025 for the US equities... not only to take profit, but also offers opportunities to buy in at some point.
(side note: as far back as 2020, 2025 was marked as the year of some resurgence of affliction from the neck upwards. It is a little sketchy, but it would very well be the surprise to tank the markets enough... watch for it)

Hellena | SPX500 (4H): Long to resistance area 6117 (Wave “3”).Dear Colleagues, I believe that price will still make new highs. I expect that the wave “5” of the middle order is not yet complete.
Perhaps the price will test the 50% Fibonacci level of 5847 and then start an upward movement to the resistance area of 6117 (Wave “3”).
This correction may not happen, then it would mean that the price continued the wave “3”.
Manage your capital correctly and competently! Only enter trades based on reliable patterns!

S&P500 (SPY) Hits Target #2 Today!Traders, though we've still got a ways to go to our final target of 670-700 on the SPY, it is worth celebrating our direct hit of 600 today. I remember a year ago drawing out 563 as a first target for our blow-off top and I was laughed at. Bears were in their mood and hungry. They wanted more blood. But a combo of our Elliot Wave and a daily inverse head and shoulders showed us exactly where we would hit.
Then I spotted this nice cup and handle on the weekly. If you remember, it was almost invalidated with that China carry trade flash crash. But I stood my ground and stated that we would need to see another weekly open and close below our neckline before the bet was off. That did not happen and we are well on our way to that 670-700 final target. However, before we get there, I do believe our 600 level on the charts will provide some psychological resistance. Admittedly, this was more of a guess than anything when I had drawn it up and placed it on my chart several weeks ago. But now, we are seeing overbought conditions on both the daily and weekly charts. Are we a bit over-heated? I think we may be and should be prepared to see a bit of a drop, or at least a week or so of sideways price action, before we break 600.
Unlike my first target at which I sold and buy the carry trade dip for massive profit, I don't know that I will be selling here. 600, as I stated already, was more of a guess than anything. But I am pretty decent at making these guesses. Experience and lots of psychology and chart study has taught me. Before I get ahead of myself though, let's watch and see what the market decides to do next week.
✌️ Stew

SPY WILL KEEP GROWING|LONG|
✅SPY is already making a
Bullish rebound from the
Horizontal support level
Of 586$ while trading in
An uptrend so we are bullish
Biased and we will be
Expecting a further move up
LONG🚀
✅Like and subscribe to never miss a new idea!✅

Hellena | SPX500 (4H): Long to area 5915 (Wave 5).Dear colleagues, I believe that the upward movement is not over yet and the end of the movement in wave “5” is ahead.
At the moment I see the support area of 5800, from which I assume that the price will reach the area of 5915.
Then we will look for a short trade entry, but for now all my thoughts are only on long positions.
Manage your capital correctly and competently! Only enter trades based on reliable patterns!

VIX for a blowout Another VIX post which have been received well in the past.
SPX is due for a huge correction and I think this will begin today, alongside all other major indices.
We see a Cup & Handle formation in the making and I believe that this is soon to be confirmed.
It is also resting on a historical trend line as well as various other resistance related metrics.
Target is very conservative with a lot of room to go past the highs in August. Re asses as this moves.

SPX500USD M15 Not Perfected SetupSpoken about the not Perfected Setup… where the highest of the sixth and seventh candle It’s not superseded by the highest of the eighth or ninth candle.
So you can expect that in the next 3 to 5 candles, the Setup high (Also, the highest of the sixth or seventh candle) should be superseded before retracement proper.
They noted in this chart that the purple box should be broken into and above.
Let’s watch the demonstration…

Combined US Index - Bullish flip overdone. Retracement now... As previously marked out, the bullish flip was done, and is pretty overdone. Yesterday's close sealed it for a retracement, and technicals (MACD and VolDiv) support that view.
should be seeing a downdraft to the last low visit (yellow ellipse).
Possible stall at blue ellipse, but look for further breakdown.
Exceeding the last low to close below is Bearish.
Let us see...

Double-Top In PlayAs expected, SPY double-top looks to be playing out. I don't expect us to drop much lower than the pink ascending trendline. Maybe we'll touch that 200 dma before our full send. Let me remind you that the pink ascending tl is the neckline of a large cup and handle pattern on the bi-weekly, the target of which remains 650-700. This is still in play on the longer timeframe and as long as we don't break below the pink tl with confirmation on the weekly, I will start to buy back at or around the pink tl and down to the 200 dma. Batting 1000% thus far and hoping to keep it perfect.

Combined US Indexes - Warning Trend Change to DOWNFrom the last post, there was a Gap closure and breakout... well, almost. What happened was a stall after the gap closure. This is the first indication that something is not right and a strong resistance is in the way.
After more than a week, a decisive down candle wiped out two prior days of bullish candles, and reopened the earlier gap. This by itself is very bearish... first on the candlestick pattern, and next on the reopening of the gap.
MACD have crossed under the signal line, in support of the bearish undertone.
Now, we wait for a full reopening of the gap, meaning a further breakdown of the supports.
By simple projection, the down wave from mid July to August (blue arrow) is projected from the last lower high in mid-August.
This brings the target to mid-September, at an old critical support level of 780.
Oddly enough, am expecting this to happen by the end of next week.

Preparing For A Potential Double-Top HereTraders,
As you all know, the SPY has been moving EXACTLY as anticipated by me the last two years. And that worries me. Don't get me wrong, I have thoroughly enjoy the profits that have come with getting it right, but what we have to be careful about when doing so well is over-confidence. Because if we don't take a couple of steps back and say to ourselves, "I could get it wrong this time", then we could likely get it wrong. The market loves to humble cocky traders. And that is why I have sold half of my longs once again ...just in case I could be wrong.
So, you can all read my previous posts and calls on the SPY, but for new readers, let me just catch you up with a brief summary to give you some context.
About 2 years ago, after the market had dropped and many investors thought it would continue down, I came under the persuasion that it would soon reverse. Though, I am a rookie when it comes to Elliot Wave, I had noticed some other contrarian traders and chartists had begun to explain from a fundamental basis why it would move up soon. These same investors began plotting a likely blow-off top scenario based on fundamentals, market psychology, and Elliot Wave theory. It made sense to me but I was hesitant to go full in based on this information alone.
I began reading more about market fundamentals and psychology and learned that most of what I read actually supported the idea of a blow-off top. Then I spotted another pattern on the daily chart (an inverse head and shoulders pattern) which strengthened the theory even more. This pattern gave me my SPY target of 570. You can still see that Previous Target outlined here on my chart. We nearly reached that target. Missed it by a few dollars. It was there that I sold half. And right on time. The Japanese carry trade flash crashed the markets and down we went. As we were nearing the 200 DMA, I spotted a new bullish pattern on the weekly chart. This was a Cup and Handle. I bought back in near the bottom recognizing that this blow-off top was probably not at an end ...yet.
Fast forward to today.
We are once again nearing my Previous Target of SPY 570 and though we could move even higher (and I honestly believe we will), I want to prepare for a scenario where I could be wrong. You can see from the chart here that we may also be forming a bearish double-top or M-Pattern. If this is the case, it is wise for me to prepare for another drop soon. Thus, I have once again, sold half. Should the M-Pattern play out, I will likely buy back in around the 200 DMA (wherever this happens to be at the time) because I still believe that Cup and Handle pattern on the 2-week chart will play out and that the blow-off top will not end until we reach 650-700 on the SPY.
Obviously, this forcast could change based upon significant geo-political/global events. But for now, this is how I see it going.
Scenario 2: If we do not drop and that M-Pattern becomes invalidated. I will also buy back in should we exceed my previous target on the chart. In either case, updates will follow.

Will The SPY Hit 650-700?Just an update on progress in the markets. The dollar has hit my support level already. Because of the quick drop, I expect it to continue to drop even further, though we may get a bit of a bounce first. The Vix is back down and inside of our long-standing sideways channel. And gold has hit its target to the upside.
Plus we'll talk about where the SPY (and U.S. Stock market) is going. That section of the video begins around 07:30 if you want to skip right to the title content of the video. And towards the end of the video, we'll of course discuss where I think Bitcoin is still going before the end of the year and also, where I think it will end up by the end of next year.
These are longer-term targets but they are not solely predicated upon technical analysis. Though the technicals do help support my claims, there is also some fundamental rationale for why I believe the markets remain so volatile, but overall, they will continue their journey upwards.

Combined US Equities Since the last heads up analysis before the bearish pullback, some more new developments came into play, particularly how the equity market turned bullish...
1. Heads up given for RISK ON in the green ellipse. The weekly chart is actually very obvious with a long tail candlestick;
2. The latter part of that week finished with a combination of a long bullish candle, breaking and closing above a resistance trendline;
3. Then continued by another breakout of a range; and
4. This week closed with another colid bullish candle that closed the gap resistance, with another bullish candle to boot.
5. MACD and VolDiv indicators are bullish since the early part of the week.
Can easily expect a revisit to the last high of 906.50, but not before a retest of the gap support.

Combined US Equities - D-Day +1on 31 July, heads up given about D-day. That was based simply of a few compelling technical factors observed.
Outcome was that there was a blow out rally, followed by an awesome Dark Cloud Cover and then a confirmation bearish candle that gapped down and tanked the week to a low. The spike in volatility was just so awesome and it caught many off guard, unfortunately.
Technical indicators were previously mentioned to be bearish already and now it is very evidently so.
Projecting further using supports and TD Sequential, it is also evident that by breaking below the support that closes the gap too was so critical... it broke the TDST support as well. This means that the TD Sequential trend is now bearish, with an expected one bearish week to go.
So all together... a significant technical breakdown.
Some bounce expected, but week ahead looks bearish.
Projected target marked (red ellipse).
Take care!

Full Send Incoming - Through The Van Allen Radiation Belt We Go!Put on your oxygen masks ladies and gentlemen. The U.S. stock market is about to go ballistic.
You all know from my daily chart, we nearly hit the target of my inverse head and shoulders pattern to the dollar. Target was 570. One of my recent posts indicated that I was selling half at 560, taking my profit, and parking it in cash. But now, I will take that cash and pack my bags again as the market is getting ready to blow minds.
Literally, everyone is predicting a market crash soon. And that may happen. But not before a rocket launch to the moon that will rip faces off.
Pack your bags and BTFD folks. Ticket sales will be on fire for this rocket ride.
