#ES_F Day Trading Prep Week 03.03.24 - 03.08.24Last week - we were able to consolidate inside the Edge that we broke out of and get a squeeze for another test of upper VAL and a push inside Value. We were able to reach the Mean but no continuation through it towards next Key Resistance and a sell back under end of Day.
Going into this week are inside a new ranges Value and our goal is to see IF more buying comes in to try to take out Current high to test next Key Area at 5159.25 - 54.25 and try to go above it ? IF we accept here and start balancing within new current range of 5154.25 - 5112.50 or IF stronger selling comes in to takes us back under VAL back inside Previous range ?
We have built up a good amount of stops inside a T2 Range at the lower Edge which took a week to build, if we start holding under 5140 - 5125 - 5112.50 that could bring in Weakness to try and take lower Stops. We would need a strong bid to take out current upper Stops and build above them to try and accept over next Key Resistance. If no strong selling comes in then we could start balancing in current range.
Levels to Watch : Current Resistance 5144 - 5140.25 // Key Resistance 5159.25 - 54.25
Levels Above : 5174.25 - 5188.25 // 5188.25 - 84.50
Current Support 5129 - 25 ? Untested // Key Support 5112.50 - 07.50
Levels Below 5095.50 - 92.50 // 5081 - 77.75 Key Support 5066.50 - 60.75
Snp500

Major Indices: Macro SR Fibonacci SchematicsHere we have every major American indices in the world including the S&P-500, Dow Jones, Nasdaq, and the Russell 2000. This list excludes major foreign indices. For this idea, we have 2 boxes per indices. This is so we have room to include all schematics in the blueprint (chart). Let us define each indices and then we can talk about what makes each individual box up.
1. S&P-500 = (Standard and Poor's 500) Largest publicly traded companies in the US. (Benchmark for the overall US stock market and economy)
2. DJIA = (The Dow Jones Industrial Average) Tracks 30 large, publicly owned blue chip companies. Indicator of the health of the US economy, especially in the Industrial sector.
3. NASDAQ Composite = Heavily weighted towards the tech sector. Includes 3,000 stocks/all stocks listed on the Nasdaq stock exchange.
4. RUSSELL 2000 = Measures performance of 2,000 smaller-cap American companies. There's a distinct difference from the small cap measurement of the Russell and big caps like the S&P.
Now, each set of boxes are entirely different. There are no schematics in more than one box AT ALL. EVERY SINGLE BOX is 100% unique. Now that we know this lets examine...
1. Both S&P boxes include the following. 2 sets of schematics, a set of fib circle pairs, and a set of Fib Forks for EACH BOX.
2. Both DOW JONES chart have a schematic each. The 1st box has a set of fib circles but not the 2nd. The 2nd has a set of Fib Forks and so does the 1st.
3. Both NASDAQ boxes have a schematic each. Also, each has a set of Fib Spikes AND Fib Forks.
4. Both RUSSELL boxes have a schematic each. Each has sets of Fib Forks with the important ones highlighted in either black, yellow, or white to show the variety and how each different set reacts differently.
One must see that the different thickness and colors of separate sets of schematics are to distinguish them from its surroundings. My own forged Market Theory is that there is a BASE SET of Fib Extensions in the background which makes up our structure. Then, in the foreground, we have our Fib Spikes and then we lay over our Fib Forks. Finally, we have a totally finished, CLUSTERED, Schematic. SO, every single schematic that I make is all just individual schematics clustered together.

SPX500USD Swing Trade BuyMy investor, Mr Goh pumped in 300$ SGD into my account yesterday by bank transfer and asked me to trade for him first.
I saw the opportunity today on SPX500USD and I long-ed it.
My initial analysis took place on the Daily Time Frame, where the previous Black Friday Sales discount was around the price zone of 10EMA(plot it to see how the price rebound from that discount zone in the previous few moves).
I expected the same strength from this year's Black Friday Sale, too, and the discount offered was similar to previous years traditional price.
I am going for two TPs.
First TP : 1R
Second TP : 1.41R
As usual, I might take things off when the price shows that it doesn't have enough demand to push prices higher.
WIll be setting the first and second order to near Breakeven when the 1st TP gets triggered(or almost get triggered).

S&P-500 E-Mini: Full Fibonacci SchematicsThis is a completely full and completed schematic of CME's E-mini S&P 500 Contract. This contract started in 1997 so there are decades of data not accounted for on the real chart. However, these are just as viable and important as the Standard & Poors 500 Indice. Let us take a look at the separate (chronological) boxes and understand what they are...
#1 is VERY IMPORTANT as this has the first pair of Fib Spikes for ES1 which are the red and white lines coming across the chart. ALSO, we see an extension from the COVID low ( YELLOW ) and this extension exactly determined the high at 4800 and the approximate bottom.
#1 and #3 also have two up schematics in RED originating from the local low from 3500. These are VERY IMPORTANT SCHEMATICS IN 1 and 3.
#2 and #4 are the first two pairs of Fibonacci Extensions for ES1. In both, we have fib forks. In #4 there are 2 of the forks. ( yellow and white )
#3, #5, #6, and #7 are the start of the next structured schematic. #3 contains the second set of fib forks for ES1. 5, 6, and 7 are all from the same structure but have completely different schematics.
#7 Contains a very important schematic of Fib Forks stemming from the inception of ES1. (YELLOW)
#8 is a formation from the COVID lows of 2020. We see the third set of Fib Spikes/Forks on ES1 here and also a Fib Schematic too. One piece of the schematic is in #1 in YELLOW and is a very important extension. It belongs in #8 but I have it in #1 because it has shown its utility.


Crypto vs Stocks - Interesting Times🕝Over the past four days, Bitcoin has surged by 20%, while the US500 index experienced a modest decline of 0.35%.
This notable discrepancy in performance reflects significant market movements, influenced by recent events such as the approval of Bitcoin ETFs and the impending Halving.
Let's delve into these factors and their impact:
📈 Market Sentiment:
The recent approval of Bitcoin ETFs has infused the cryptocurrency market with renewed optimism. Institutional adoption, catalyzed by ETFs, signifies a broader acceptance of Bitcoin as a legitimate investment asset. This approval likely contributed to Bitcoin's surge, as investors seek exposure to the digital currency through regulated avenues.
💲 Halving Anticipation:
Anticipation surrounding the upcoming Bitcoin Halving event is driving market sentiment. Scheduled to occur in a couple of weeks, the Halving will reduce the block reward for miners, diminishing the rate at which new Bitcoins are created. Historically, Halving events have spurred significant price rallies, as reduced supply increases scarcity, potentially leading to upward price pressure. The looming Halving has likely fueled demand for Bitcoin, contributing to its recent surge.
📊 Risk Appetite and Diversification:
Bitcoin's outperformance against the US500 index also underscores varying risk appetites among investors. Cryptocurrencies like Bitcoin attract risk-tolerant investors seeking higher returns, particularly in anticipation of significant events such as the Halving.
🤖Technological Disruption:
Furthermore, Bitcoin's surge highlights the disruptive potential of blockchain technology and decentralized finance. Investors are increasingly recognizing the innovation behind cryptocurrencies, allocating capital towards transformative technologies.
As Bitcoin continues to assert its dominance in the financial landscape, one cannot help but wonder:
Are we witnessing the dawn of a new era in finance, where decentralized assets challenge traditional norms and reshape the way we perceive value?
📚 Always adhere to your trading plan, especially regarding entry points, risk management, and trade execution.
Wishing you all the best of luck!
All Strategies Are Good; If Managed Properly!
~Rich

SG10Y forewarns of a blowout top in the S&P500...
The SG10Y had been previously established to be a reliable indicator of the US S&P500 index, and US markets in general. It has had a 100% read accuracy in forewarning of imminent volatility, particularly when the SG10Y breaks out of trendlines.
So the end of the week saw Nvidia spark a rally in the S&P500, and closing at record highs for the week.
Usually, I would be excited about this, but the SG10Y break out of the Finbonacci fan trendline, as well as the correlated bearish zone for S&P500 (red box) and MACD turning more bullish again... all these tells of a blow out top on the S&P500, which we must be wary about.
Clear indicator that in the coming week or two, we should see a quick reversal on the S&P500.
Check out the previous linked posts to see how reliable and accurate this has been since I started tracking and reporting.
Stay safe!

Is the steady rate bullish for stocks?Hello community. The Fed's goal is to promote maximum employment and stable prices. So in recent times the Fed has rapidly hiked rates by 5-¼ percentage points while also reducing their security holding by $1 trillion to help influence inflation expectations.
Large companies like Amazon, Meta, Alphabet, Microsoft, Salesforce and many more began cutting their workforce in order to adjust to extant economic conditions. While price stability is key, it must not be at the detriment of conducive labor conditions. The past monetary policy tightening periods came with job losses that negatively impacted the economy. The Fed is beginning to carefully hold rates at restrictive levels so as to avert similar economic damage.
Moving from an environment of low rates to rising fed rates caused stock prices to fall rapidly. So now that the Fed is pausing the hike and giving favorable projections, investors are beginning to increase their stock holdings. Things may be coming back to normal considering the large capital raised in the recent ipos.
We project a new all time high to be made after the correction that started in January 2022 is completed.
Trade set up
Buy entry price: 4229.46
Target price: 4677.76
Stop price: 4022.85
As the trade progresses we will update the idea and indicate the time to move stops to break even. Please like and share if the idea is helpful.
Nedium Team

#ES_F Day Trading Prep Week 2.18 - 2.23Shortened week ahead, lets break down structure and areas of interest to lean on this week.
Last Week :
We opened the week above VAH and under Key HTF Edge, we knew that this is the area where we can see size sellers step in and an area where size longs could be taking profits which creates different sets of sellers to give more pressure to the lower levels, as mentioned this could be the Edge that will stop our run at least for time being.
Market consolidated above VAH, pushed into the Edge, tagged 5066.50 to the tick and failed to take it out which gave a nice sell back into VAH. Tuesday before the data we knew we had Supply trapped above and if Key Support gets taken out we can see a move lower and if we followed down level to level we ended up testing the bottom Edge, taking out one of the weak lows but we only had enough to barely take it and found buying again. By end of the week we ended up back in 5013.75 - 5066.50 Range and Friday we balanced inside under the Key Resistance without tagging it and with a few Key Support tests.
This Week :
Market closed on Friday inside Key Support with what looked like end of day break but Globex opened and pushed away from Key Support again keeping us inside 5013.75 - 5066.50 Range for now. We have a shorter week coming and question is will we stay consolidating in this Current Range and try to push out of VAH towards the Edge again or will the market stay inside Value with a possible move through the Mean towards VAL.
If we end up holding under VAH under 5048.75 - 45.75 // 34-31 areas could bring in weakness once enough supply builds up to break Current Key Support and if that happens we could target move to lower levels towards VAL, we have to be careful looking for too much downside unless Key Levels break and market shows continuation because we could stay balancing inside our Value unless stronger volume comes in. First targets under to watch would be 5001.75 - 97.75 and VAL top at 4988.25 - 84.25 which could find buying to hold us over, if not we have Key Support at 4972 - 67 which we would need to take out for any continuation towards bottom Edge.
If we do end up holding this range and can't take out Current Key Support, we can see more balance in Current range again and if enough buying comes in and we can take out upper Resistance areas at 5034-31 we would need to hold over 5041.50 and take out 5048.75 - 45.75 to see another attempt at the upper Edge. We would need to take out and accept over 5066.50 - 60.75 for any more upside from this range and above target would be towards the top of the Edge where we could watch for failure or continuation.
Area over 5066.50 - 60.75 is big Resistance for now and if we finally have selling from size longs and shorts don't need to pay over Value too much then we could continue to hold under so need to be careful with any pushes over 34 - 41.50 area as they may not hold unless we get strong buying through them.
Levels to Watch :
Current Resistance 5034 - 31 // 5048.75 - 45.75
Key Resistance 5066.50 - 60.75
Targets if above 5086.25 - 81 - 77.75
Current Key Support 5019 - 13.75
Targets below 5001.75 - 97.75 // 4988.25 - 84.25 Needs to break for attempt lower
Key Support 4972 - 67 Would need to hold under for any continuation towards lower Edge.

#ES_F Day Trading Prep Week 02.11 - 02.16Lets check out market structure from last week and see what we can lean on this week.
Last Week :
Last week started off at VAL of current HTF Range, market opened Sunday over Key area but wasn't able to hold over which provided sells back towards the Edge but was only able to hit a couple lower targets before it found more buying at and over the Edge which told us we weren't ready to continue lower from there. Once we got over and held 72-67 area as Support which brought in more buying, we took out 88-84 Resistance which trapped shorts below and gave a nice push towards higher targets. We hit resistance at Key Area of 5019-13.75 but market again wasn't able to get back under the mean and instead we created a cost basis, got over Key Resistance and pushed to test VAH. First VAH Test in Pre-market gave a nice sell back into previous Key Resistance but failed to break making it our Support, once selling over 28.50-34 area ran out we were able to continue to next level up at 48.75-45.75 which provided Resistance for the day.
This Week :
So far Friday market was able to hold VAH and gave a push over it end of day. Going into this week we have a Cost Basis at the Mean area of the HTF Range and we have our Key HTF Edge right above us which is a great spot for profit taking from size longs.
This to me is kind of hinting on possible balance action inside our new range which is 5013.75 - 5066. Cost Basis at the Mean could provide the needed Support and the selling from/under the Edge could provide the needed resistance to keep us inside this range until we either have enough Supply/Volume to break back under and continue towards VAL or give another consolidation and if more buying comes in try to push through the Edge.
I feel like this Edge is the one that will kind of stop this train from going further, of course we never know and can continue if buying comes in but if not this is a perfect spot for market to find good HTF Resistance and start a distribution process under it filling in the shorts who got trapped on the way up, holding the market here will also bring in new buyers as well who will be looking for continuation higher towards 5100 but if they aren't strong enough to actually push us through this area then that would be our Supply when we are ready to accept back in Value and head for VAL. This might take time to play out and wont be surprised if we spend the whole week in this current Range without acceptance over/under for now. We could see tests out of Key areas but need to be careful for continuations from them.
I will be looking to trade back and forth level to level inside this 5066 - 5013.75 Range until I see acceptance over/under.
Levels to Watch:
Current Resistance 5048.75 - 45.75
Key Resistance 5065.75 - 60.75
IF Accept Over Next Level up is 5077.75-81 Area
Current Support 5034 - 31 - 28.50 Area
Key Support 5019 - 13.75
Would need to hold under to see anything lower
IF it does levels under are 5001.75 - 4997.75 // 4988-84.25

Combined US Index potential breakdown imminentHere is how I see it...
1. MACD Bearish divergence on both MACD and VolDiv and being extended further, increases probability of a retracement happening;
2. Sequential counts completed... retrace ent could begin within the next 5 candles;
3. Candlestick pattern shows a toppish doji;
4. SG10Y heads up for volatility and retracement incoming,
So there... heads up!!! Going down for a good bit.

SG10Y suggesting another round of volatility Track record of tracking the SG10Y yields in giving heads up to the S&P500 or US market direction has been quite uncanny...
This time, the technical outlook for the SG10Y is suggesting a breakout, and in doing so, should see market volatility to the downside.
MACD is suggesting a potential breakout, as is a recent close to the high and breaking the Fibonacci fan resistance.
Any quick pop up would be confirmation of market volatility being imminent.

S&P 500 2024-2025 OutlookSP:SPX is not going to crash in the Q1 or Q2 2024. I have measured that we will continue the rally atleast until the resistance zone around 5200-5800.
I used fibonacci retracement to determine the rally target and the pullback target. If we topped at 5200-5800, we will most likely drop to the support area around 3500-3200. I highlighted some area in the RSI graph, if we reached that area we most likely will have a pullback. Another case is if we still continue the rally up until 7000-8000, an economic bubble perhaps, the crash would be more deadly.
Overall i think 2024 will be good for people to make money and prepare for a major crash. Stocks & crypto will be making new all time highs, the first two quartals should be fine for us. Fourth quartal will be the most decisive because of US election, could turn very good or very bad. My advice is to also follow all the latest news about geopolitical tension, we might have a world war 3 or at least a major war that will play a very big factor on the economy in general.
Prepare.

buy microsoftmicrosoft is doing good with gamepass and chat gpt also.
This bad boy is about to blow to 315 soon>
I see some exciting pattern from the chart.
Looks like earning will be nice also.

✅SPY BULLISH BREAKOUT|LONG🚀
✅SPY is trading in an
Uptrend and now we are
Seeing a bullish breakout
Of the key horizontal level
Of 479.88$ and the breakout
Is confirmed which reinforces
Our bullish bias and makes us
Expect a further move up
LONG🚀
✅Like and subscribe to never miss a new idea!✅

S&P 500 Rally InboundOverall Order Flow is Bullish, And With this Market Maker Buy Model I see it rallying Today,
And with that Breaker in Mind I can see it Trading Down into that Creating a Judas Swing,

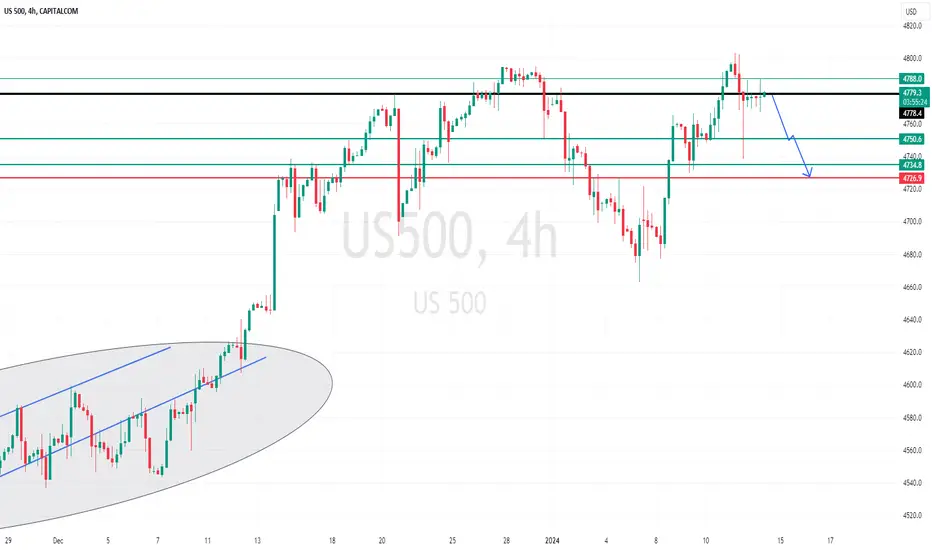
US500. high are placed? or not?#US500 (S & P)... market sustain from lat couple of 4 hours candle.
and as we discussed in our perveious us500 analysis that 4780 is market resistance area.. market break it but did not sustain above that area,
now again that is our resistance area if market hold it then now drop expected from here,
keep in mind guys that is market key level 4780.
manage accordingly.
trade wisely
good luck
sharp fall is expected in global marketI analyzed s&P500 index today but it includes all of global markets.
dollar index's power is gaining strongly.
Biden's economic strategy with china seems not working well and USA and China's bond are too tight since 2008 financial crisis. the second possible Lehman brother's crash is on the way.
I don't know which banks will lead the crash but this time it will be wider and wild.
MACD is getting weaker and Russia's sharpy raising interest 350bp hikes is also the issue.
The too much unsolved disasters are on the way which is not good for all traders.
Higher high, the Lower low.

SNP likely flipping lower...looking for shorts on h1 etc...Hello fellow traders , my regular and new friends!
Welcome and thanks for dropping by my post.
Flipping on the index to the downside, correlating with the strengthening in USD?Let's see...
Do check out my stream video for the week to have more explanation in place.
Do Like and Boost if you have learnt something and enjoyed the content, thank you!
-- Get the right tools and an experienced Guide, you WILL navigate your way out of this "Dangerous Jungle"! --
*********************************************************************
Disclaimers:
The analysis shared through this channel are purely for educational and entertainment purposes only. They are by no means professional advice for individual/s to enter trades for investment or trading purposes.
*********************************************************************

US500/S&P hold his resistance ? keep close#US500.. well guys now a deep look on us500 chart. market smoothly trade with higher high pattern and now market is at his upside resistance area,
4780 will be our resistance area if market hold it then now a dip or retrace expected from here.
keep close it and don't be lazy here,
if not hold then upside areas will update in our next idea about s S&P
trade wisley
good luck

SPY Will Go Down! Sell!
Hello,Traders!
SPY went up to retest
A horizontal resistance level
Of 480$ from where I think
We will see a local
Bearish correction
Towards the horizontal
Support level below at 460$
Sell!
Like, comment and subscribe to help us grow!
Check out other forecasts below too!

✅SPY POTENTIAL SHORT🔥
✅SPY price grew again to retest the resistance of 480.00$
But it is a strong key level
So I think that there is a high chance
That we will see a bearish move down
SHORT🔥
✅Like and subscribe to never miss a new idea!✅

SPY Bullish Breakout! Buy!
Hello,Traders!
SPY is trading in an uptrend
And the price broke the key
Horizontal level of 460$
Which is now a support and
After the pullback and retest
I will be expecting a
Bullish continuation
Buy!
Like, comment and subscribe to help us grow!
Check out other forecasts below too!
