Combined US indexes - Where the spike up?IF you are getting a little frustrated, I am too... something is building up and meanwhile there is a lot of conflicting signals.
The week passed, and it appears to suggest the opposite now... a breakdown is more likely... 60/40 in favour of a breakdown, if I may quantify.
Set up the Breakout and Breakdown levels, and waiting for some real commitment.
Meanwhile, MACD histograms indicate a bearish divergence
VolDiv crossed down too.
Very simply... volatility coiling to spring, and if no break out soon, it will breakdown. Sounds a bit obvious, but watching it pan out is half the fun.
Enjoy!
Snp500

ES1! SPX500USD 2023 MAY 15 WEEKCME_MINI:ES1!
Are we seeing the bearish ascending triangle already?
As with NQ, tendency to take rotational trades has diminished.
Scenario Planning:
1) If market remain within 4163 - 4118 = No trade
2) Larger rotation 4198 - 4068 = trade at boundary of range
Volume Analysis:
Weekly: Lower vol down bar close off low = some demand present
Daily: Lower vol down bar close off low = some demand
present
Price reaction levels:
Short = Test and Reject | Long = Test and Accept
4303 4198 4163-4118 (No trade zone)
4065
Remember to like and follow if you find this useful.
Have a profitable trading week.
*For educational purpose only.

S&P 500 (SPX) Potential Downtrend VibrationUsing cycle theory and WD Gann method, we've found out that there's a potential for downside movement on S&P 500 (SPX) price vibration.
Disclaimer: Not financial advice!

S&P 500 - bull and bear thesis$ES_F AMEX:SPY SP:SPX
Hourly timeframe
* The next obvious move for SPY is to fill the gap at $422.16 and possibly go to the $327.83 gap fill as well
Bull: A continuous close above $416.14 will take us to the $422.16 gap fill
Bear: Another rejection at $416 will take us to $405

TIP off?Overlayed the TIP a chart with SPY (blue line). Quite clear that TIP (amongst JNK/HYG and even copper) precedes the index.
Given all previous analyses and outlook, what we would like to see is that TIP break out and above its trend line resistance, as does its VolDiv. When this happens, can expect a bullish advancement.
MACD has not yet turned to crossover, but VolDiv is already giving us a heads up tip off! < Pun not intended >

Combined US indexes suggest a spike upThe Combined US indexes chart ended the week with a bearish candlestick that had a little bullish indication with a longer tail and closing above the support line (aka Fake Out Line #2).
This is slightly bullish and represents a chance for the earlier projected target of 668 to be achieved in the coming week or two. Yes, technical indicators appear to suggest that it is a bit stretched but it does look as if it would like to spike up, maybe in a blow off top fashion.
This is aligned to the USD drop described earlier.

ES1! SPX500USD 2023 MAY 08 WEEKCME_MINI:ES1! ES1! SPX500USD 2023 MAY 08 WEEK
Are we seeing the bearish ascending triangle already?
As with NQ, tendency to take rotational trades has diminished.
Scenario Planning:
1) Rejection short at 4175 / 4068
2) If market decides to spring a surprise, long on test of break of
4198 and finds support
Volume Analysis:
Weekly: Ave vol up bar close off high = minor weakness
Daily: High vol narrow spread S>D bar = weakness
Price reaction levels:
Short = Test and Reject | Long = Test and Accept
4303 4198 4068
3928 3788
Remember to like and follow if you find this useful.
Have a profitable trading week.

S&P500 RISK-OFF Q2Looking for a turtle soup of the February highs before we drop aggressively.
The rest of Q2 seems like a risk-off situation for me for stocks.
Like always do your own due diligence.
DISCLAIMER: I am not a financial advisor and nor is this financial advice.

So now back down to the 200 day?Traders,
We have now touched the underside of our macro uptrend (3) three times and the bulls have been unable to break to the topside again. Is is time for them to sit the bench for a few weeks, get their wind back, and let the bears take us back down to retest that 200 day one more time? It might be.
Stew

Combined US market analysis - Going UP!From the combined weekly chart, it appears that the indices are bullish and on the way up.
1. Tested, bounced off and broke above the Fake Out Lines;
2. Last week's candle is obviously bullish with momentum
3. MACD and VolDiv are both supportive of bullish upside
4. TD Sequential primary trend is bearish, but the current setup appears to aim for a completion over the next 2-3 weeks.
5. Closed at the highest point for 2023 last week
Taken together, there is enough bullish momentum to push forth and upwards.

✅SPY NEXT MOVE|SHORT🔥
✅SPY is going up now
But a strong resistance level of 418$ is ahead
Thus I am expecting a pullback
And a move down towards the target at 412.5$
SHORT🔥
✅Like and subscribe to never miss a new idea!✅

SPY Local Short From Resistance! Sell!
Hello,Traders!
SPY is going up now
And is about to retest
A strong horizontal resistance
Of 416.8 from where
A local pullback towards the
410 level is to be expected
Sell!
Like, comment and subscribe to help us grow!
Check out other forecasts below too!

ES1! SPX500USD 2023 APR 17 WEEKCME_MINI:ES1!
ES1! SPX500USD 2023 APR 17 WEEK
Friday's bar closed below 4175 and showed a rejection
of higher prices.
Scenario Planning:
1) Rejection short at 4175
2) Market rotation continues = trade at boundary (80pt range)
of range (grey box)
3) Rotation breakout long at support of 4175
Volume Analysis:
Weekly: Ave vol up bar close off high = minor weakness
Daily: High vol narrow spread S>D bar = weakness
Price reaction levels:
Short = Test and Reject | Long = Test and Accept
4303 4175 4096
3928 3788
Remember to like and follow if you find this useful.
Have a profitable trading week.

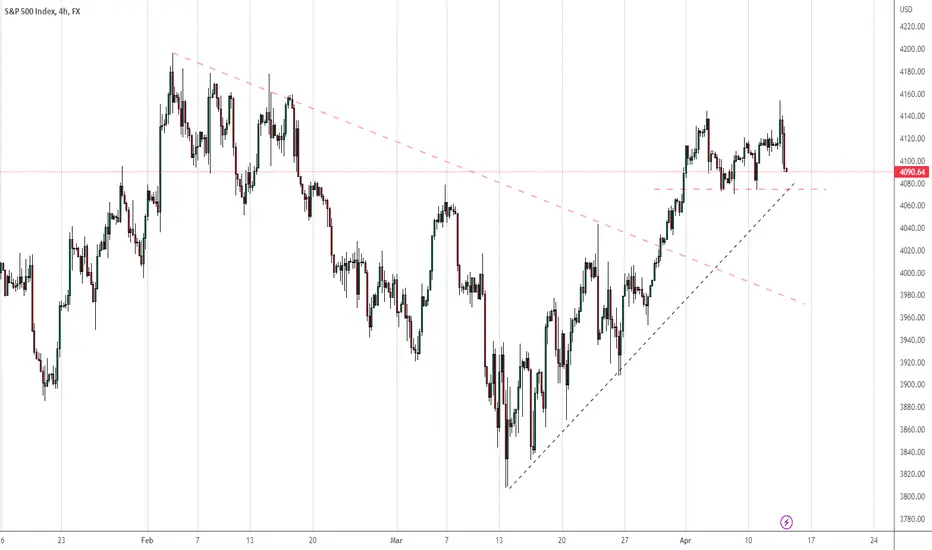
Nas and Snp could be turning down...4080 for snp is a important level to watch..
**Find out more from my Tradingview Stream this week**
***************************************************************************************
Hello there!
If you like my analysis and it helped you ,do give me a thumbs ups on tradingview! 🙏
And if you would like to show further support for me, you can gift me some coins on tradingview! 😁
Thank you!
Disclaimers:
The analysis shared through this channel are purely for educational and entertainment purposes only. They are by no means professional advice for individual/s to enter trades for investment or trading purposes.
The author/producer of these content shall not and will not be responsible for any form of financial/physical/assets losses incurred from trades executed from the derived conclusion of the individual from these content shared.
Thank you, and please do your due diligence before any putting on any trades!
S&P500 Developing as a Corrective StructurePrice seems to be developing corrective at the moment. Overall we remain neutral. We'll give it some time before committing to any trade setup.
If we can get a corrective structure development from here, we can expect more upside.

Bullish above last month HIGH Buy signal still valid SPX SPY SNPWith all the Doom & Gloom regarding recession worries we liked our idea even more so into Q1 close last month.
So far so good however we are still very early in Q2.
We remain bullish above last months high (March 2023)
Seeking Pips will be managing our positions on the Weekly and Daily charts.
We also note that the current price is also in a key Fib retracement zone to SELL SPX on the monthly chart so we will not be surprised to see another pullback, again we would consider adding to our core position if this happens and volatility is right.
Our Bull & Bear price level is clear and as long as we above it we want to be buyers only.
A failure of March 2023 Low we would have to revaluate our current thesis.
Happy trading have a GREAT WEEK.!
===============================================================
SUBSCRIBE TO OUR CHANNEL & FOLLOW THIS TRADE IDEA FOR UPDATES.

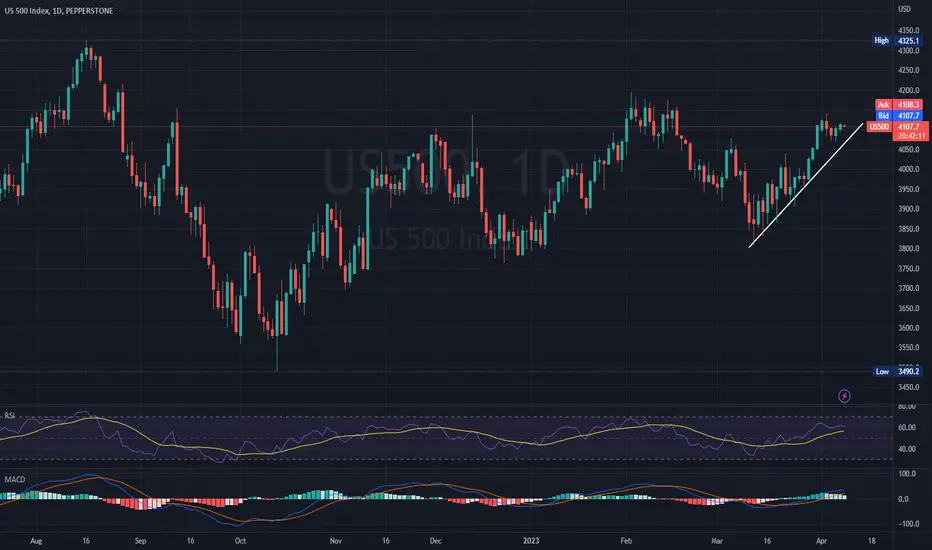
SPX RALLY CONTINUESAll indicators are showing a continuous rally on the SPX. Despite closing lower on Tuesday and Wednesday, the index rebound in the next two trading days and almost managed to reach the opening levels from Tuesday.
Both MACD and RSI are confirming the bullish trend, with MACD histogram being above zero and RSI above 50 neutral line.
If this scenario continues, the price might reach levels of 4312.In the opposite scenario, as a pivot point might be viewed the price of 4000, after it new lows of 3925 might be reached.
Risk Disclosure: Trading Foreign Exchange (Forex) and Contracts of Difference (CFD's) carries a high level of risk. By registering and signing up, any client affirms their understanding of their own personal accountability for all transactions performed within their account and recognizes the risks associated with trading on such markets and on such sites. Furthermore, one understands that the company carries zero influence over transactions, markets, and trading signals, therefore, cannot be held liable nor guarantee any profits or losses.
SG10Y Govt Bond and SPY relationship Part IIITime for yet another update in this uncanny inverse relationship between the SG10Y Government Bonds and the S&P500 Index ETF, SPY...
Recall that the SG10Y GBond yields are in apparent inverse correlation to the SPY. When there is a trendline breakdown on the yields, the SPY is bullish; and when there is a trendline breakout, the SPY is bearish.
So far, it can be observed that this relationship is intact and predictable, with the SPY forging bullishly when the SG10Y GBond yields are falling...
Note that a support is approaching and this can mean either or both of two things:
1. There should be a brief stall in momentum incoming soon; and
2. The primary trend for the SG10Y GB Yields is bearish, expected to break the support and head further down until the end of April 2023. This also suggests that April should see a surge in the SPY (and S&P500), denoted by the larger green arrow.
So far, now change in the yield downtrend, at least for the next week, until it reaches the expected downside target (red circle).

US500 H4 | Potential bounce off from 23.6%?Looking at the H4 chart, it appears that the price is nearing our buy entry at 4058.68. This level is a pullback support level, accompanied by a 23.6% Fibonacci retracement. Our take profit level is set at 4135.55, which is a swing high resistance. We will set our stop loss at 4007.06, which is a pullback support level that aligns with the 38.2% Fibonacci retracement
Any opinions, news, research, analyses, prices, other information, or links to third-party sites contained on this website are provided on an "as-is" basis, as general market commentary, and do not constitute investment advice. The market commentary has not been prepared in accordance with legal requirements designed to promote the independence of investment research, and it is therefore not subject to any prohibition on dealing ahead of dissemination. Although this commentary is not produced by an independent source, FXCM takes all sufficient steps to eliminate or prevent any conflicts of interest arising out of the production and dissemination of this communication. The employees of FXCM commit to acting in the clients' best interests and represent their views without misleading, deceiving, or otherwise impairing the clients' ability to make informed investment decisions. For more information about the FXCM's internal organizational and administrative arrangements for the prevention of conflicts, please refer to the Firms' Managing Conflicts Policy. Please ensure that you read and understand our Full Disclaimer and Liability provision concerning the foregoing Information, which can be accessed on the website.

VXX (VIX ETN) showing bullish divergence for volatility comebackJust noted that the VXX (the VIX ETN) is showing a bullish divergence in both the MACD and the VolDiv as it returns to the consolidation zone and bounces near the support.
Breaking out above 46 and then 47 should trigger another bout of volatility... question is IF 58 will be a good resistance or is it to break beyond that level the next round?
IMHO, expecting a massive breakout...

ES1! SPX500USD 2023 APR 04 WEEK
ES1! SPX500USD 2023 APR 04 WEEK
Market may be continued to be marked up. However, exercise
caution as weekly bar may be showing a bull trap.
Scenario Planning:
1) Possible short if 4175 is rejected
2) Continuation Long if 4082 // 4175 are supported
Volume Analysis:
Weekly: Low vol up bar close toward high
= no commitment to higher prices, possible trapping longs
Daily: Ave vol up bar close toward high = non-trend changing
Price reaction levels:
Short = Test and Reject | Long = Test and Accept
4303 4175 4082
3928 3788
Remember to like and follow if you find this useful.
Have a profitable trading week.

Double Harmonic Shark PatternsCTCUSDT looks super bullish to complete the inner Harmonic Shark Pattern for the near future then will start a huge decline in price (50% drop) towards that lower Order Block.

SPX shortA sweep of the level of 4080 will give a reaction and we will go down, in general it is not yet clear why, after yesterday's negative report on GDP, the index continues to grow. Bull trap.
