SPY Breakout Long! Buy!
Hello,Traders!
SPY broke the resistance
Cluster of the falling and
Horizontal resistance levels
And went up so I am
Bullish biased and I think
That more growth will follow
Buy!
Like, comment and subscribe to boost your trading!
See other ideas below too!
Snp500

ES1! SPX500USD 2023 FEB 06ES1! SPX500USD 2023 FEB 06
Last week's Scenario1 short and breakout trade
both offers TP of 50pts each.
Market is back into supply zone (circled), 3 TFs
showing supply coming in. Temporary short
opportunity may arise if market moves up on lower
volume and narrow spread.
Scenario Planning:
1) Short if 4209-4175 is resisted
2) Long on support and acceptance at 4094-4048 level when
breakout level is tested.
Volume Analysis:
Weekly: High vol up bar close off high = supply coming in
Daily: Higher vol down bar, possible 2BR formation = supply coming in
H4: High vol down bar close at low (UT) = S>D. If up bar(s) after this
is narrow spread and low volume, we may have a temporary
short opportunity
Price reaction levels:
Short = Test and Reject | Long = Test and Accept
4175 4094-4048 3928-3788
3580 3502 3231
Remember to like and follow if you find this useful.
Have a profitable trading week.

#ES_F Friday 2.03.23 Prep Review: Today we saw that our suspicions about possibly finding a place to tighten up a bit to get ready for next move might have been correct, still have to see what we do in Globex but so far the information we have is we have accepted in this 4220 - 4137 intraday range, we have supply over 4220 - 15, we have built a support last night Globex under 4061 - 62 and still have short holding us up under 4143 - 37. As long as we don't break down and fall apart or break out tonight this might be our range until we are ready for next move out or to drop the bid for lower distribution.
Prep: As Mentioned above we are currently in 4020 - 4137 Intraday Range with 4191 - 62 being our Value. Until we set up for a move outside of this range we can probably expect to spend some time in or around it and should be able to trade level to level once it sets up for a move away from value or back to value. Our T2 Range is under us which should give us support but we might dip inside it, if we do start taking out taking out Key Support or Resistance areas that is where we need to watch for reversal or continuation for a bigger move out of range or back to the other side, as mentioned it might take time now until we are ready for the move and right now is the time of patience to let things properly set up and show the way... long to set up, moves quick and reverses quick which means need to be patient and ready. I think once we are ready we have that nice space blow us to drop our bid to, we have 4100 - 4080 as potential lower support when we do but until then we might take our time.
Levels to Watch:
Resistance : Key Daily 4214 - 4191 // Key Intraday 4220 - 4215 // Intraday 4191-85
Support : Key Daily 4123 - 4084 // Key Intraday 4143 - 37 // Intraday 4168-62

#ES_F Thursday 2.02.23 Prep Review For 2.01.23: Fun day with the Fed today, not sure I how missed so many signals today for a long trade and why I was so short biased coming into today after mentioning Friday that we had more in the tank the way we closed and from our pre Fed price action. If long at the break over 4084-77 was caught, it made a nice little run over our Daily Resistance area. Our signs today were that we flushed trapped supply Monday leaving short stops above 4103 then yesterday the dip was bought and we made a lower high getting in more shorts at the area, Globex opened below and we consolidated around 4084-77 all night. When RTH failed to continue higher we built up inventory and flushed it twice but each time we failed to tag our lower Support at 4061-56 that was a big red flag because to continue lower we needed to take out 4060 area and build structure under it to be within striking distance of T2 low but we didn't do that and when Fed data came out at 2pm and 2:30pm Periods we both dipped under breaking the support but quickly coming back out signaling no supply, once 84-77 was taken again strong we had shorts trapped under us and once we took the stops over 4090 and 4110 that covering provided the buying to get us higher. Question going forward is will we accept here for now and attempt to distribute lower or will we come back in and how long will this move hold before continuing or reversing?
Overview For 2.02.23: We are currently over our Daily Resistance area of 4123-4084 over this intra day range top of 4143-37, over T2 range with position below us at 4084-77 area. Question going forward is are we ready to keep moving, reverse or is this a good area to tighten up the range a bit while we still have Support below us and Supply above us too keep us from running away too much? If they wanted to keep this in some balance to clean out more traders before we decide on direction then this would be a good spot to do it but at these areas anything can happen really so its best to watch level to level. Going into Globex for me this 4143-37 area is like out middle for tonight with our Resistance being 4168-62 and possible Support down at 4123-19. Until things are clear we watch for set ups around resistance and support and trade towards the middle unless there is a break and continuation or break/hold over to either side, if we are to keep ranges small that might be the case going into RTH tomorrow but all will depend on what we do tonight if we drop the bid at night and start taking out our lower Support areas then we need to watch out.
Levels to Watch:
Next Daily Resistance 4214-4191 Intraday Resistance 4168-62 // 4191-85 // 4220-14
Possible Daily Support? 4123-4103 ( Previous Resistance not really tested)
Intraday Support 4123-19 // 4103-99 // 4084-77 If we happen to do reverse at night or some point and break those levels next daily Support is 4012-3990
****** There are a lot of split views right now with people thinking we should reverse fall apart or keep going to 4300-4500 which might give us some indecision and smaller ranges with moves taking longer to clean people out unless our business is concluded today and shorts are covered to drop the bid lower or we get over 4168-62 and hold to continue higher AND IF we do get under 4143-37 tonight and just continue to drip lower don't look to buy at support but instead this might be a reversal back towards 4084-77 and under don't stand in the way if we can hold lower areas

✅SPY GROWTH AHEAD|LONG🚀
✅SPY will keep growing
Because the price is in the uptrend
And recently broke the key level
So we will be expecting
Bullish continuation
LONG🚀
✅Like and subscribe to never miss a new idea!✅

SNP500 Short-Term Bullish Analsyis.GLOBALPRIME:US500
Factors of confluence for the analysis:
* On the higest Degree of structure (Daily). We are coming from building equal highs.
* coming from the equal highs, the price had built a Distribution and right after its completion, there was an accumulation that reversed the effort of the sellers.
*On the purple trend, the last bearish retracement, came from the Bearish POI. However, the sellers failed to break the structure and the buyers took control of the market.
Conclusion:
The purple trend is likely to have as target the equal highs.
We identify the highest volume interests to select the levels from which the Smart Money (the purple trend) might keep buying from. This is represented by the white dashed arrows.
Click on Boost (like) to support these free analyses
This expectation is a framework to look for a potential trading setup; I recommend you to not just execute based on these levels. I always wait for confirmations on lower timeframes
This Analysis was done using my complete Strategy which includes:
- Smart Money Concepts
- Multi Timeframe Liquidity and Market Structure
- Supply And Demand
- Auction Theory
- Volume Analysis
- Footprint
- Market Profile
- Volume Profile
- Wyckoff
- Etc.

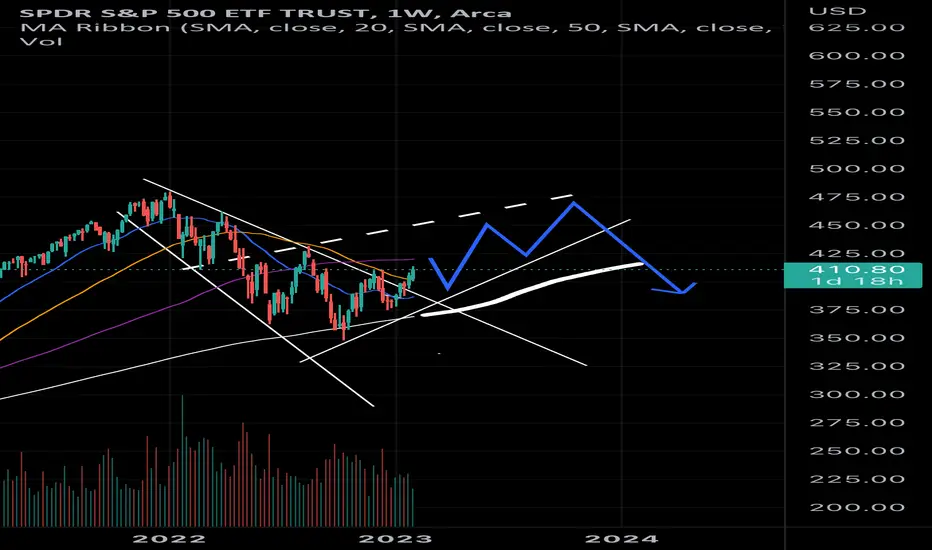
InspyreThe market does what she wants, could be an interesting set up for a drop in September.
Seems to have broken out of decending triangle.. could be an opportunity to bounce into the 430’s June/July. Delaying any recession news and pumping “soft bottom” articles. Transitioning from put to call dominant late into August. Triggering a large outflux and negative news dump, easily sliding down into the 360’s to print puts.
#ES_F Wednesday 02.01.23 Prep Review: Tuesday Globex opened and held under 4046-42 and after we built up enough supply we broke 4030-25 Range low and hit the top of our daily support at 4012. After we got over and held over 4030-25 pre market the shorts from the morning were trapped under 4030 giving us support. As long as 4030-25 wasn't taken out our trade was to the upside back to resistance areas with final target being 4084-77 area but for some reason I formed a very short bias for a reversal today even though we found a bid at support area and did look below and fail away from key level but couldn't help but try to catch reversals from 61-56 and over until finally lost that thinking to see what was happening and figured an end of day probe over into resistance would be in order for todays close and caught a nice pull back reversal from above 61-56 level from 67.50 to 88.50 to end a day.
Overview: We are back in the same place we opened Sunday Globex.... Did anyone get washed out??? Hope not! We are on a mission right now and size is getting their fill. Opened today right at 4084-77 lower end of key Daily resistance with some supply above, currently right on top of T2 High and inside Previous Days Range with two data releases and the fed.... Fun fun, not the best day to try to predict what will happen and think you can catch those moves safely or predict where we will go but for now we know this... we are possibly in distribution mode, we are currently at the top of at our bigger resistance level but doesn't mean we are ready to go down, data tomorrow will bring volume. Depending or not if we are ready to move out of this range we will have to see if key locations get taken out and watch for continuation.
Levels to Watch:
Daily Resistance: 4123-4084 Intraday Resistance: 4084-77 // 4104 // 4124-19 // 4143-37
Daily Support: 4012-3990 Intraday Support: 4061-56 // 4061-42 // 4030-25 // 4012-08 // 3994-89 IF Broken lower cost basis is in 3957-3940 area
We are currently in distribution balance covering the shorts and cleaning up the supply, we have to be careful at these areas as supply can be cut quick and introduced the same way, we see that we are still holding up and prices are bringing in buyers so business up here is not over just yet but in the mean time we can trade level to level and watch for continuations outside.

Can dumb money outwit smart money?
I decided to try looking at the insider buys and sells recently to see if I can get an insight into what may happen in the coming months.
I was specifically looking for CFO & COO buys and sells larger than 5% of their portfolio, I figure the CFO and COO have good insight into the company and if they are taking a sizable portion of their holdings it should have some meaning. Here are the results
# of CFO or COO who sold 5% or more since friday: 13
# of CFO or COO who bought 5% or more since friday: 3
# of CFO or COO who sold 5% or more in January: 150
# of CFO or COO who bought 5% or more in January: 16
Overall It looks like the hedge funds and insiders are trimming their positions while retail is buying the dips.
There have been cases where retail actually managed to outwit the institutions but more often than not in scenarios like this there is another leg down.
I am really feeling the rug pull double top scenario drawn in orange, but I figured I would throw up the bullish case as well drawn in blue.
Just my opinion, hope you enjoyed the pictures.

#ES_F Tuesday 1.31.23 Prep Review: Sunday Globex opened right at key level of 4084-7, attempted to get back over but failed trapping the buyers and yesterdays end of day supply above. We sold got the move lower which broke 4061-56 and found buyers at lower support area of 4046-42 pre market. At RTH Open we corrected short inventory back to our Resistance area of 4084-77 where more sellers stepped in. Selling back down and holding under 4061-56 was showing us that this is now our resistance making possible target at 4046-42 which was already tested multiple times and T2 low below it at our 4031-25 Support. We did get our move lower but it happened towards the end of the day which makes us think there are still buyers below and we didn't have enough supply to break it just yet. Good trades today from resistance down, stayed with the trend.
Overview: We are currently in distribution mode and our range is 4077-4030, we got up against big resistance last week and trapped some more supply over 4084 which we saw today coming out under 4061. We had enough short covering today to keep us up over resistance and not test T2 Low which was at key support until end of day... does that tell us that the buying is so strong and keeping us up or are we just taking our time dropping the bid lower to not scare off willing buyers? Tonight our nearest Resistance is at 4046-42 and Support is at 4030-25 since we are in distribution mode we are not sure when they will be done and ready to move out of this range. We are currently below T2 range but inside Previous Day range, as long as we are holding under 4061-56 that is a sign of continued weakness from above but must see a break of 4030-25 for first sign of lower continuation and then get under 4012-08. For signs of reversals to the upside we must hold 4030-25 and start taking out higher resistance areas and especially holding over 4061-56. Can we stay in distribution range until data starts hitting this week to bring more volume or will we make a move outside the range again?
Levels to Watch:
Daily Resistance: 4123-4084 Intraday Resistance: 4084-77 // 4061-56 // 4046-42
Daily Support: 4012-3988 Intraday Support: 4030-25 // 4012-08 // 3994-89 If Broken then 3957-53 // 3944-40

S&P500 Technical Analysis-2023Hello everyone, hope you all are doing good.
Bullish Probability:(at least one or two weekly candle closes above 4100 than there is a possibility of this playing out).
There is an active Bullish Divergence playing out in RSI, so there are chances S&P500 may put new high above 5k.
If S&P500 put new High, then it can be a Triple Bearish Divergences, so after that it can be a massive dump of markets.
In this case the 1st Bottom will be 3500, so the 2nd Bottom can be massive drop from 5k to 2000, previously S&P500 dropped its 2nd Bottom from 1580 to 670(-57%).
Bearish Probability:(at least one or two Weekly candle closes below 3700 than there is a possibility of this playing out)
Currently the Fractal of SnP500 looks like similar to the previous oct-2001 to july-2002 Fractal.
S&P500 -> falling in a Descending parallel channel -> Breakout/Fake Out little and finally put lower low or 1st Bottom.
If this plays out than RSI may fall below 30 - invalidating the current Bullish Divergences. (Sometimes Divergences get invalidated due to forceful movement of Markets).
Target = around 3200 OR there is a possibility to fall on the sky Blue trendline.
Thank you, please like and share, if you have any questions please comment.

SnP500 - bad risk/reward outlook 5% upside potential compared to 13% downside.
Best guess: Hard landing by Q4 followed by money printer go Brrrr.

#ES_F Monday 1.30.23 PrepThis week we find ourselves opening right against bigger resistance area of 4120-4080, its a big market moving data week which will bring in volume. Lots of traders are looking for this to either reverse hard or keep going to 4150-4200-4300 those two are great options and another is to use this to maybe shake things up on both sides. It feels like there is still more covering to do and at the same time we are at an area of bigger supply which warns us of uncertainty. We have been making some big moves and maybe we found a location to range a little bit? Do some cleaning and get ready for next step? We will have to see what action we get this week but if that turns out the case then will be looking at 4120-4000 as our bigger range for now until we fully break through either side.
Areas to watch tonight are 4084-77 // 4061-56, If we completed our business over 84 for now and trapped that supply then we will want to buy it back cheaper. If we cant get back over 84-77 that might give us a test of Fridays low and that 4061-56 level to see if we can shake things up and from there will have to watch it level to level with our potential support being at 4046-42 and lower with T2 Low being right at 4030-25 Support. Thinking that if we stay in this bigger range then we might get some good two way trading this week because of this indecision with buyers under 4000 and sellers over 4100 but also a chance to see quick reversals.
We are currently accepted in 4077-4030 area and Friday move was a stop run but we have to watch if we build structure around it then get back over it.
Levels to Watch:
Daily Resistance 4120-4084 Intraday 4143-37 // 4123-19 // 4103-4100 // 4084-77
Daily Support 4012-3990 Intraday 4061-56 // 4046-42 // 4030-25 // 4012-08

SPX and Nasdaq for 1-2Q 2023*Fundamental Analysis*
February market perspective summary
In January, the market started with the Fed's interest rate freeze and China's reopening expectations, and as the performance of worrying tech stocks passed smoothly, upward pressure eased and a rebound came out.
In February, the gap between market participants and the Fed widened.
Market participants expect the Fed to finish raising rates by 25bp x 2 times after judging that inflation is over.
However, China's reopening is making room for inflation to pick up again and the US labor market is still strong, the Fed cannot easily be complacent and stop raising interest rates.
I expect a price correction to occur as the gap between the Fed and market participants closes on the Fed side.
After that, if the gap is closed after mid-February, it is expected that an additional rebound in March will be possible as interest rate freezes and China's reopening are the story again.
In other words, this February, rather than aggressively building additional positions, we will respond with a strategy of maintaining our remaining positions and cash ratio and buying again in case of a downward correction.
*Technichal Analysis*
The view that the US economy is relatively healthy, It is good to get position USD from now on as a hedging of the recession.

✅SPY SWING LONG🚀
✅SPY will keep growing
Because the pair is in the uptrend
And recently broke the key level
So we will be expecting
Bullish continuation
LONG🚀
✅Like and subscribe to never miss a new idea!✅

ES1! SPX500USD 2023 JAN 29
ES1! SPX500USD 2023 JAN 29
Market presented scenario2 for Long with TP1 at 29pts & TP2
at 80pts.
Supply observed on H4 and Daily TF. Supply may be back to
defend their position.
Scenario Planning:
1) Watch for H4 bar, possible scenario
- if next H4 bar close higher but on narrow spread and lower vol,
market may present a temporary short opportunity
- if next H4 bar closes lower, weakness is confirmed. Short when
market retraces to a recent high and is rejected.
2) If market breaks through on very high vol, retraces and finds
support, it will be opportunity to go long.
Volume Analysis:
Weekly: Ave vol up bar close off high = No Demand
Daily: Ave vol up bar close at middle = Supply coming in
H4: High vol down bar close at low (UT) = S>D. If up bar after this
is narrow spread and low volume, we may have a temporary
short opportunity
Price reaction levels:
Short = Test and Reject | Long = Test and Accept
4175 4094 3928-3788
3580 3502 3231
Remember to like and follow if you find this useful.
Have a profitable trading week.

SPY Breakout Long! Buy!
Hello,Traders!
SPY is going up now
And the price has broken
A long-term falling trend-line
And the breakout is confirmed
So It seems that after the
Pullback and retest
We will see a further
Move up
Buy!
Like, comment and subscribe to boost your trading!
See other ideas below too!

ES_F Week Recap. Is there more upside? Review: This weeks agenda was short covering, market got too short under 3930 and we used the covering do drive us higher to our bigger supply areas where we can find more selling. We have successfully arrived at our next bigger time frame supply level. Wasn't an easy week to trade as they didn't make this move up as fun for everyone but levels held nicely and targets were reached. Last few data releases were different than what we are used to and trades take longer to set up so extra patience is required. End of day today we used the short stops that we built second half of the day to unload our inventory and run it up over 4103 where we found more sellers from where we dropped the bid end of day. The way we closed at first seemed bad for the longs in a way that we have trapped inventory over 4084 and that was that, after review it makes me think that possibly we just found supply and dropped our bid to cover lower but I think there is still some more covering to do up here. Doesn't seem like we are ready to reverse just yet..
Overview: Coming week has lots of data so it wont be an easy one, best to take it day by day and let the market show us what we are doing. Sunday Globex will have to show us the next set up... our potential support is under 4084-77, our position end of day was in that area as well. Monday is no news/data day which means less volume and after todays end of day drop we might have less bullish traders in globex so they can buy it back cheaper and try to make another run at it, depends where we open but we should be over T2 range which tells us more shorts are trapped under for potential support and if we run out of supply in 4100-4084 area then we will need to get more over Fridays high which if broken will create more buying to possibly get us to test next supply area. Our support is under 4084-77, red flag if we break and start holding under 4061-56, ideally we consolidate under or above support then start pushing away from 4084 again during RTH BUT since its a big supply area they might try to consolidate then get over 4100 during Globex since there is less volume and use that as support later in the day, if that happens we might will have to watch potential support under 4100 and resistance areas stay the same. Have to be careful up here because size is doing business here and they don't care what anyone thinks as they will get their fill or do what they need to do. We are towards an edge where things like reversals happen but that takes time to play out or can be very quick.
If we did happen to finish this move higher and longs are trapped, we have to start seeing price break and hold below our lower support areas and moving away from this supply, until then they might keep moving it higher.
Levels to Watch: Resistance: 4168-4162 //4143-37 // 4123-19 // 4100 Support: 4084-77 // 4061-56 // 4030-25 // 4012-08 // 3957-53

SPY about to break out OR fail?The week to close leaves Friday (today) and currently, the weekly candle is looking really really good... A potential weekly break out is in the cards IF Friday can hold current levels and/or rally further above 400.
Furthermore, note that the MACD is in alignment for an uptrend. albeit the VolDiv is slightly less than ideal, being flattish-ly up trending somewhat.
Also, this should be the third weekly close above the 23 week EMA... and what we really want to see is a close above 410.5, for a higher high.
DeMark Sequential started as this week is the third candle, and noted that there is no completed Buy Setup since late 2022 when the down trend started. Oddly, without a completed Buy Setup, the primary trend is actually UP, which suggests this deep retracement is about over.
IF all goes really well, expect upside target at 442-448, a good 10% upside.
For now, this is just a technical heads up and plotting of the next couple of week's projections.

ARE YOU BULLISH????Hello!
Bullshort is here!
An interesting spectacle amid news. But as I said the Fed rate will only start to show itself closer to March. In the meantime, you can arrange a false breakdown of the downward channel. From a chart perspective, the price should bounce off 4077 and return below the trend line.
The government is about to remove the restrictions on public debt which is fascinating.

#ES_F Overview for 1.24.23 Review: Short covering continued today, during Globex we held above 3976-71 Support, consolidated under VWAP before then open and once we took the open out off we went, we flushed most of the supply out of this area last Wednesday so this move over 4030 was much easier without much consolidation needed on the way up. We saw our first decent correction and need to consolidate to go higher at 4046-42 which was first resistance target. We were able to take it out and hit next level at 4061-56 where we found more supply which gave a nice correction to VWAP, the higher it gets the more supply there will be so have to be careful at these areas as we might have found our range for distribution.
Overview: We have possibly found our distribution range between 4077-4030, have to see how we hold Globex but there is a good possibility to see a test of today's high at some point, will it hold or not is for us to find out. Ideally we hold 4030-25 support but very likely we could see some sort of flush under it before, as long as we hold over 4012-08 the upside has a chance of playing out. If we take a dip under 4030-25 and can consolidate under without breaking it will be a good information, unless we make some move over it tonight.
Levels to Watch: 4012-08 // 4030-25 // 4046-42 // 4061-56 // 84-77

My Blowoff Top Prediction has begun. SPY 5500 Incoming!You all know that I have been talking about this blowoff top thesis for quite some time. I have good reason to believe we are beginning that run today. Let's talk about the details: where we're going, what is the time frame, and, most importantly, how should we trade this?
Stew

#ES_F Overview for Monday 1.23.23 Review: Last week Thursday we got back to our possible support area under 3930 and we could see the short covering stabilize the price before RTH at 3915-10 area which was important going forward, during RTH we failed to continue lower and only did a look below Globex low and came back in without reaching next level and taking out the low from 1.10 signaling that sellers are running out. Friday Globex we consolidated more getting all the supply secured, RTH open gave us a flush under VWAP to get the last sellers out and once we got over 30 again shorts were trapped and we began mark up back to our Supply area which is over 3990.
Overview: That flush Wednesday took out a lot sellers from this area so now we might be able to get through it easier and head for our next Resistance area. As we know the goal is to sell product higher to willing buyers and we need to create some demand, ideally we can hold over this 76-71 area or at least over 60 as we now have support below those areas and see a move higher to take out last weeks high which will bring in more demand to the store. I will be looking to see if we get any pull back tonight towards 76-71 area and if it holds or not, the way we high closed Friday we might not get much of a pull back and instead take out 94-89 area first and head for 4000 pocket, if that happens then any pull back to and under 94-89 could be a good opportunity to buy and eventually if we hold over this area and get through that 4000 pocket we can see a push higher into next resistance area to 4046-61 maybe little over it depending how much buying we get.
Levels to Watch: 3976-71 // 3995-89 // 4012-08 // 4030-25 // 4046-42 // 4061-56
For better confirmation we can wait until 4012-08 gets taken/hold either in Globex or RTH tomorrow, if in Globex then we might see a re-test in RTH but either way if we get over this area we could see our move to 4030-25 // 4046-42 and if that is that 61-56. Trading it level to level is a safer bet since we would be in supply area and never know what can happen but ideally everything holds up nicely and we get the full move.
IF we don't hold 76-71 first red flag, breaking under 60 big red flag and will need to wait because if that happens then trip lower could happen but being up here I would think that they will try to run the highs to bring in more buyers to sell product into.
