Two Factors Weighing on StocksStocks have wavered as the markets digest higher weekly unemployment rates and new statements from the Fed. The Fed remains unconvinced at how effective the 'Inflation Reduction Act' will be and Kashkari has stated that the Fed has 'more work to do' to bring down inflation. The S&P 500 has topped out at 3810 with multiple red triangles confirming resistance. We are seeing support in the 3750's, suggesting that we may be forming a bull wedge or other consolidation pattern. If things turn south, 3714 should provide support. A breakout could test 3825.
Snp500

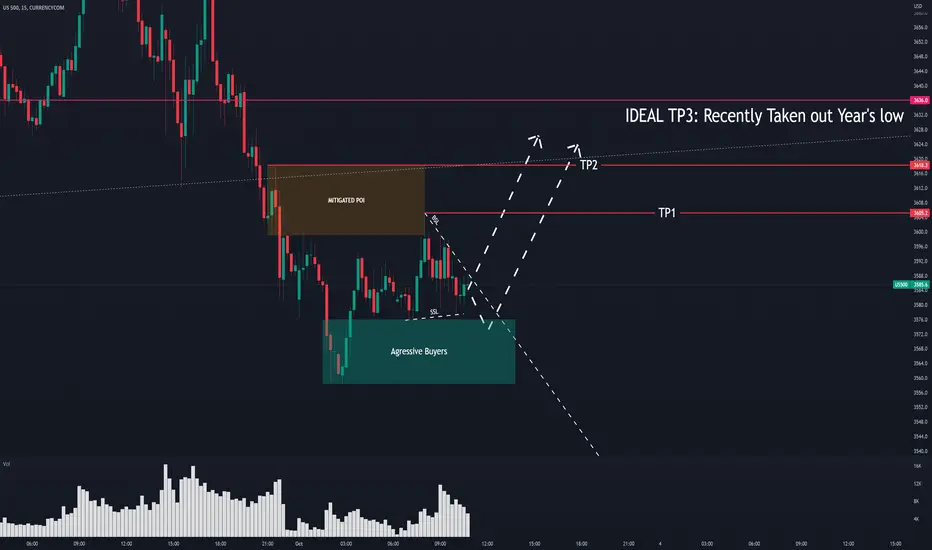
SNP 500 Short-Term SHORT ExpectationHelp me keep on posting by clicking on BOOST! (it's like "liking")
This expectation is a framework to look for a potential trading setup; I don't just execute based on these levels, I always wait for confirmations on lower timeframes
This Analysis was done using my complete Strategy which includes:
- Smart Money Concepts
- Multi Timeframe Liquidity and Market Structure
- Supply And Demand
- Auction Theory
- Volume Analysis
- Footprint
- Market Profile
- Volume Profile
- WYCKOFF (IS THE KING)
- ETC

Stocks Meet ResistanceAs mentioned in our report yesterday, stocks have edged higher but are facing resistance at 3792. A red triangle on the KRI confirms resistance here. We are seeing support at 3749, after the pullback. The Kovach OBV has gained strength but has receded. If we can see another burst of momentum, we may make a run for the 3800's. If not, expect further support at 3714.

US500 IS DIVING DEEPER INTO BEAR MARKETAfter policymakers have shown more appetite for interest rate hikes, S&P500 recorded its lowest close in almost two years and it is 24% down from its record high.
The technical indicators on 1H graph are also putting the index into bear territory, with MACD histogram below 0 and keeps decreasing and RSI well below 50 neutral line.
If the downtrend continues, the index might reach and test levels of around 3530 USD. If opposite scenario occurs, the price might test its previous high at 3800 USD.
Risk Disclosure: Trading Foreign Exchange (Forex) and Contracts of Difference (CFD's) carries a high level of risk. By registering and signing up, any client affirms their understanding of their own personal accountability for all transactions performed within their account and recognizes the risks associated with trading on such markets and on such sites. Furthermore, one understands that the company carries zero influence over transactions, markets, and trading signals, therefore, cannot be held liable nor guarantee any profits or losses.

short term bottom is inS&P500 has fallen enormously
I been calling short for a year now.
Bigger they fall it will bounce back higher.
I personally don't belive that economy will recover anytime soon.
But I strongly analyze that this 3500 support line will create some reasonable bouncing back and FOMC will stop raising interest rate or they would raise only a little.
It is also overselling area now.

SPX LONG 10-03-22This was the Analysis I posted yesterday before it got hidden by Tradingview for breaking one of their rules. It hit all the TPs!
Let's blast off these analyses, click on BOOST!
This expectation is a framework to look for a potential trading setup; I don't just execute based on these levels, I always wait for confirmations on lower timeframes
This Analysis was done using my complete Strategy which includes:
- Smart Money Concepts
- Multi Timeframe Liquidity and Market Structure
- Supply And Demand
- Auction Theory
- Volume Analysis
- Footprint
- Market Profile
- Volume Profile
- WYCKOFF (IS THE KING)
- ETC
Stocks Rally Expecting A Fed PivotThe S&P 500 rallied off of increased confidence that the Fed will pivot their pervasively hawkish stance. This is likely to be transient and the market was due for a relief rally, anyway. We are currently testing a dense patch of levels in the 3740's, and will face significant resistance here. If we can break through, then 3792 is the next target. If we reject current levels, the most likely scenario, we should have support from 3714 or so, at the base of the 3700 handle.

More Gloom For Stocks?The S&P 500 has edged lower yet again, showing little buying interest even at these levels. The fourth quarter has just begun and all indications point to more gloom for stocks. We have broken our level at 3584, finding support just above the next level down at 3547. Multiple green triangles on the KRI are suggesting good support here at these levels, but the lack of a buyback suggests we are not out of the woods yet. We are looking incredibly oversold and due for a pullback. If so, we must break through 3610 and 3617, which seem to be providing significant resistance. If we edge down yet again, then 3547 is the next target.

ES1! SPX500USD 2022 OCT 03 Week
ES1! SPX500USD 2022 OCT 03 Week
Last week, ES' yielded the following results
- Scenario1 short on rejection 3717 level yielded 90pts
- Scenario2 long on dotted trend line + 3600 support yielded 50pts
Observation:
- Converging trend line - prefer to wait as range narrows
Possible Scenarios are considered:
1) Wait till price shows definite direction by exit of converging trend line
as price converge, meaning narrowing range.
2) Short on retracement after breakdown of support or converging trend channel
3) Long retracement if price breakout of converging trend channel and
finds support
Weekly: Higher vol narrow spread down bar close at low = demand coming in
Daily: Ave vol down bar close at low = minor supply
H4: UHV down bar close at low = demand coming in
Price reaction levels:
Short = Test and Reject | Long = Test and Accept
3903 3792 3717
3642 3540-3600
Remember to like and follow if you find this useful.
Have a profitable trading week.

SNP Bears AttackSNP500 Bulls will need to defend 3521.
If price action starts consolidating below 3521, then we could get a lower degree pullback and breakout for the next motive wave down.

S&P500 Will Keep Falling! Sell!
Hello,Traders!
S&P500 is trading in a downtrend
And the ETF broke the key horizontal level
Which reinforces our bearish bias
And I think that S&P500
Will keep falling down
Sell!
Like, comment and subscribe to boost your trading!
See other ideas below too!

✅SPY WILL GO DOWN|SHORT🔥
✅SPY is going down currently
And the pair is breaking the key structure level
So if the breakout is confirmed
It will become a resistance,
And after the pullback and retest
I think the price will go further down
SHORT🔥
✅Like and subscribe to never miss a new idea!✅

TLT, UST10Y and SPY - a heads up relationshipI read somewhere recently about two co-relationships between bond prices/yields and the SPY.
First was about TLT - where TLT goes, the market (SPY) follows it was said.
Second, was about the UST10Y (US Treasury 10 Year Yields) having to abate its bull run before the SPY cools its bearish rout.
So, I took the opportunity to put these thoughts together visually and overlaid their charts.
Interesting observations between these three it seems...
There are three highlighted periods in 2022, all of which provide a very similar pattern.
Notably, the UST10Y has a tight inverse relationship with the TLT (UST 20Y Bond ETF), which is expected. And if we follow the markings in order...
The time line starts the cycle where TLT brings the SPY higher as the two are in alignment to move higher, where the UST10Y drops. Then there is a period where the UST10Y rises, and the TLT falls, but the SPY continues to countertrend (from TLT) and head upwards. This is not sustainable and TLT gave heads up of that (red shaded red box). Int he rest of the red box period, this is where the SPY stop diverging with TLT and follows TLT int he downward move. The shaded red box is the period where TLT is like a leading indicator of the SPY. To restart this whole cycle, it also seems that TLT needs to have a MACD crossover, and a MFI Histo crossover; the time lines mark the MFI Histo crossover after the MACD cross over.
Given these patterns, the current situations appears to favor a continued downside drift, at least until a MACD crossover, post MACD bullish divergence, and then a MFI Histo crossover. This would appear to take several weeks more.
Heads up!

SPY closes the week and month decisivelyFurther yesterday's pre--market post, The SPY closed the week and month in a rather decisive fashion - at the low.
The weekly chart (left panel) shows the SPY follow through the downward momentum, after breaking down the HULL EHMA and failing the 55EMA. The close at the week's low, pretty much, also set a new lower low close, having gone through the June low support. This candlestick shows downward momentum, although it might be easing off with a relatively shorter candle compared to the weeks before. The technical indicators support this view with the MACD crossing under and extending further below the MACD signal. Downside target of 325 (yesterday mentioned 330) still remains in sight.
The monthly chart of the SPY (right panel) shows that as expected from the previous month candlestick, the failure to break and maintain above 416, with a long upper tail, followed through with a rather bearish monthly candle. This candle ended at its low for the month, with indication that there is great downward momentum due to the similar candle but larger body. The next candle for the month of October will be testing the monthly 55EMA at 354, just a few points away from the week and month close. Technically, the MACD and MFI all indicate further downside momentum to be expected, which also means a likely break of the monthly 55EMA should be expected.
Not a very bullish outlook for October at all, with almost no slowdown in sight. From these charts, it would appear that October may start of slightly bullish, but should be overwhelmed by the bears to head further down to target at 325/330 as the month continues to the end.

XAUUSD - GOLD CURRENT SITUATION#XAUUSD
According to the analysis given to XAUUSS earlier, GOLD went down very fast, BREAKING the TREND LINE because the US INFLATION DATA was UP. Due to this, US10Y went up a lot. And US RETAIL SALES DATA also rose rapidly. It also affected GOLD especially last week. So GOLD sold fast. And the FOMC also pushed GOLD to the lower MINOR SUPPORT LEVEL.
We have some very important NEWS coming to USD this week. PCE DATA is key to that. So we have to wait a bit until we get them.
Anyway, with US10Y UP, GOLD is going down a bit now. Anyway, we expect GOLD to go down to 1647 LEVEL. After that, GOLD can definitely go up to 1744 LEVEL. Be careful..

Bear Wedge in StocksStocks look incredibly weak as persistent risk-off news and a hawkish Fed are impacting the markets. The S&P 500 is forming a bear wedge at 3617, and the Kovach OBV is bearish, and has flattened. We are long overdue for a relief rally, but we will need more momentum to come through before we see anything significant. If we break down further, then we should expect further support at 3584 or 3547.

SPY can't get it up...Just a quick pre-weekend analysis and update about the SPY.
Previously, it looked like the SPY was about to do a technial bounce, but the week panned out to be more fear overwhelming than anything else. The MACD is not divergent, so any bounce can be expected to be shallow; just like Wednesday's bounce, and not following through the next day. It appears a little oversold, and at support cross-roads. With the bearish Buy Setup in force indicating a bearish primary trend, a bounce of some sort is still in the cards. So we play the bull and bear case scenario again.
(Slight) Bull case sees a mild rally to about 380 (most likely, as it meets a set of resistances) or perhaps stretch to 390, where should start to stall and turn down again. The TD Seq Sell Setup should start with a TD Flip, then proceed to build but not likely to change the primary trend by exceeding 403. In fact, it might even truncate. If this scenario happens, it would take us to almost mid-October, and the rest of October might be pretty bearish to reach the projected downside target(s), 305 and 330, which have been readjusted for time.
The bear case here is a consolidation around 370 and then most of October fall off the cliff type of bear market to 350, then to 330.
The slight bull case appears more probable at this point with a favourable 70/30 skew. But whichever way, it is in the middle of a bear trend and it is not quite over.
For now, I'd be watching the next week or two to see how this pans out...
PS. So far, the projected lines (based on the symmetrical HH and LL pattern) is still robust and uncanny, which was posted on Aug 3.

SP500 CONTINUES ITS DOWNTRENDAfter the Wednesday rebound, SP500 went into downturn again in Thursday, amid investors fears of economic slowdown and further interest increase.
The benchmark hit new low on Wednesday, before rebound, of 3602, which was not tested yesterday, but if the downtrend keeps its momentum, this level might be tested and even levels of 3480 might be reached. In the opposite scenario, if the trend reverses, the price might reach its high of 4160.
All technical indicators are confirming the bearish trend, with MACD histogram below 0 line and RSI approaching oversold zone of the 30 line.
Risk Disclosure: Trading Foreign Exchange (Forex) and Contracts of Difference (CFD's) carries a high level of risk. By registering and signing up, any client affirms their understanding of their own personal accountability for all transactions performed within their account and recognizes the risks associated with trading on such markets and on such sites. Furthermore, one understands that the company carries zero influence over transactions, markets, and trading signals, therefore, cannot be held liable nor guarantee any profits or losses.

Critical Supports are holding strong! Double bottom?SPY (and other indices) supports are holding strong traders. Dollar is dumping. Do we get a double-bottom pattern followed by a blow-off top the likes of which most investors will have never seen coming? Support must hold.

📉 Short-term bounce on S&P500Price bounced off the 3608 level yesterday rather impulsively. At the moment we can start to anticipate a 3-wave pullback towards 3780 and 3825 area.

Dead Cat Bounce in StocksStocks caught a massive bid, breaking through highs, and finally met resistance at 3737. The Kovach OBV has picked up substantially, validating the pivot. It is likely this rally is transient and we will retrace back to lows or support around 3645. But if we can break through 3758, there is a vacuum zone until the next target at 3792. We can expect 3800 to hold as an absolute ceiling for now.

NZDJPY - DAILY TECHNICAL BIAS WITH FUNDAMENTAL BIAS#NZDJPY
NZDJPY should be slightly SELL because the MARKET RISK is off now. Also, since NZD RATES are high, we expect NZDJPY to go UP again. We look forward to the future behavior of NZDJPY. The reason is because the interest rate of NZD is higher compared to JPY.
Either way, NZDJPY should be a LONG TERM BUY.
Anyway, the PRICE can go down again on the NZDJPY MAIN SUPPORT, if the MARKET RISK remains in the OFF state, to the 80.50 LEVEL. Earlier NZDJPY was SELL due to strong JPY and MARKET SENTIMENT is RISK OFF. After that, you can definitely BUY at 86.86 LEVEL. For that, MARKET RISK should be ON. STOCK UP, VIX DOWN, JPY WEAK. Besides, the USD should be WEAK.

EURJPY - FUNDAMENTAL AND TECHNICAL VIEW#EURJPY
- There is currently a DOWNSIDE BIAS for EURJPY. With JPY being STRONG, XXXJPY CURRENCIES are selling very fast right now. MARKET RISK is still being OFF. EVEN IF VIX UP, XXXJPY CURRENCIES BUY VERY FAST WITH JPY WEAKNESS. Sometimes EURJPY can reach the 137.00 LEVEL and it has gone down.. 137.00 is a very good SUPPORT LEVEL..
- Some NEWS coming for the USD will help to weaken or strengthen the EURO. But in the future, if the RATE HIKE SENTIMENT is PRICED by the ECB, EURO may be BUY more. For that, the support of EURO STOCKS and VIX must be received. We have no more confirmation that the EURO is likely to be WEAK.
- Anyway, the price can move to the area I mentioned and after that the EURJPY price can move back to the 144.70 LEVEL. For that, VIX should be DOWN and JPY should be WEAK. For that, MARKET RISK should be ON.

VIX Magic Bowls in ActionAs you can see from the images below, all of the bowls are the same size with similar action from the support lines.
This time out the VIX has broken out of the fallen wedge and looks to have confirmed it by touching down.
These have been quite accurate so far and I believe that we'll reach 34 by next friday.
Sounds quite silly, but the bowls are all of the same size and have performed quite well over the last 5 of them and I'm in a long position to take advantage of them again.
