SPY STRONG BREAKOUT|SHORT|
✅SPY made a bearish breakout
Of the key horizontal level
Of 568.00$ which is now
A resistance and the breakout
Is confirmed so we are bearish
Biased and we will be expecting
A further bearish move down
SHORT🔥
✅Like and subscribe to never miss a new idea!✅
Snp500

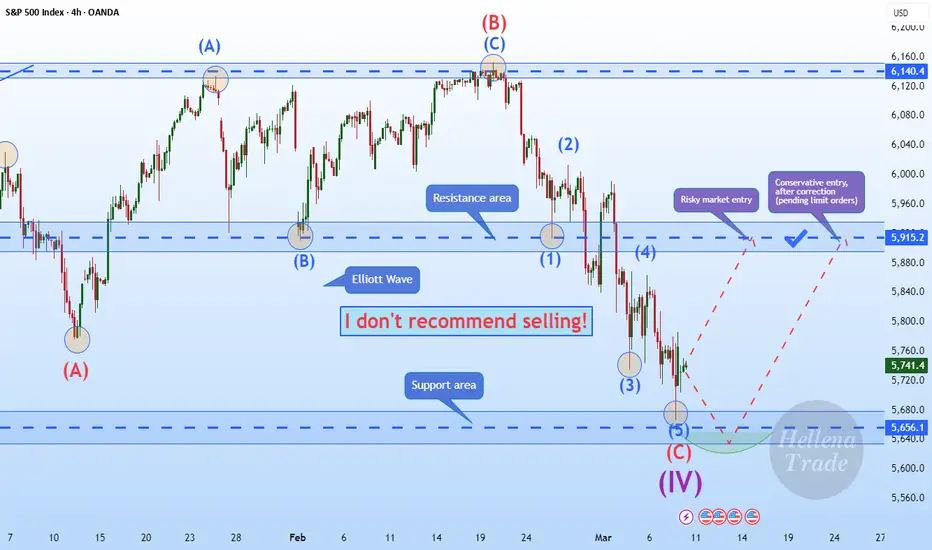
Hellena | SPX500 (4H): LONG to resistance area of 5915.Colleagues, I was waiting for the price to reach the support area of 5656, because the big corrective wave “IV” should end soon.
I am still looking for a long entry point. I expect that wave “IV” has either ended or will soon end its downward movement in the 5656 area and we will see the beginning of an upward wave.
I expect that the first target is the resistance area of 5915.
Manage your capital correctly and competently! Only enter trades based on reliable patterns!
BITCOIN - WHERE ARE WE? When zooming out and looking at the Bitcoin chart, despite how crazy the market has been in recent weeks it comes down to a simple market structure with three separate clearly definable ranges:
RED RANGE (Accumulation) - From FEB '24 until the US election BTC chopped in primarily the top half of a range with five separate midpoint retests with progressively shallower rallies that eventually broke out with a catalyst from the political world.
BLUE RANGE (Expansion) - After a 10 month accumulation range the next phase in the bull cycle was expansion, a rally above ATH and into price discovery. An extremely thin inefficiency rally.
Now price currently is at the midpoint of this range and despite the geo-political waterfall of bad news BTC has held up better than I had expected given that usually a rally that goes straight up has no support levels on the way back down. The chart does suggest a retest at $73,700 at some point before deciding which direction to go in after that.
GREEN ZONE (Distribution) - For the last 3 months Bitcoins price has been extremely volatile, bouncing between $91-108K, the range containing price perfectly with weekly retests of the range bottom and a swing fail of the range high. That SFP set off the beginning of BTCs sell-off eventually breaking through the bottom and back into the blue range.
With Bitcoin at the midpoint of the middle range it's a perfect time to have a data release in CPI, A volatile news event that can be a catalyst for a larger market move and with Tradfi selling off, this CPI is the most important of the Trump administrations term so far:
CPI DAY
PREVIOUS: 3.0%
FORECAST: 2.9%
ACTUAL: ??
Bullish - sub 2.8% print. At least the market sell-off is having a positive effect on inflation and isn't painful for no reason. BTC reclaims blue midpoint with a view to retest blue high.
Bearish - 2.9% or higher. Market sell-off hasn't has an immediate effect on inflation so the sell-off is bad in all aspects, except for the Trump admin moving closer to their wish of a weaker dollar and lower interest rates. FWB:73K blue range bottom retest on the cards.

SPY/S&P500: in the mid-term resistance zonePrice has approached the upper border of the mid-term resistance zone: 598-612.
Until price closes bellow 612, I am preparing for the start of a correction to mid-term support: 564-540.
If price moves confidently above 612, than next resistance target is at 635 level.
The macro-structure of the uptrend from 2022 lows is well intact until price holds above 540 level and assumes higher targets for 2025 at 635-640-670 levels.
I wish everyone Merry Christmas and successful and profitable 2025!
Thank you for your attention.

SPX500 at Key Support Level: Rebound Towards 5,860?FOREXCOM:SPX500 has reached a significant support zone, highlighted by previous price reactions and strong buying interest. This area has acted as a key demand zone, increasing the likelihood of a bullish bounce if buyers step in.
The current market structure suggests that if the price confirms support within this zone, we could see a bullish reversal. A successful rebound could push the price toward 5,860. However, if the price breaks below this zone, the bullish outlook may be invalidated, opening the possibility for further downside.
Just my take on support and resistance zones—not financial advice. Always confirm your setups and trade with solid risk management.
Best of luck!

Combined US Indexes - Breakdown and JittersMarked out previously, the US indexes broke down a tad earlier and retested to fail only to drop further based on jitters and jitter-induced expectations.
While the candlestick is long and solid pretty much, there is an extension zone to expect more of the downside to overreach and be oversold before a bounce.
You should be able to see that the Buy Setup is pretty much done and can expect a bounce reversal soon... but only after momentum ebbs and a base support is found.
Watch for it...

MES!/ES1! Day Trade Plan for 03/06/2025MES!/ES1! Day Trade Plan for 03/06/2025
📈5798 5818 5838
📉5759 5739 5719
Like and share for more daily ES/NQ levels 🤓📈📉🎯💰
*These levels are derived from comprehensive backtesting and research and a quantitative system demonstrating high accuracy. This statistical foundation suggests that price movements are likely to exceed initial estimates.*

MES!/ES1! Day Trade Plan for 03/04/2025MES!/ES1! Day Trade Plan for 03/04/2025
📈5840 5858 5875
📉5800 5780 5760
Like and share for more daily ES/NQ levels 🤓📈📉🎯💰
*These levels are derived from comprehensive backtesting and research and a quantitative system demonstrating high accuracy. This statistical foundation suggests that price movements are likely to exceed initial estimates.*

SPY GROWTH AHEAD|LONG|
✅SPY is trading along the rising support line
And as the pair is going up now
After the retest of the line
I am expecting the price to keep growing
To retest the supply levels above at 604.00$
LONG🚀
✅Like and subscribe to never miss a new idea!✅

#ES_F Day Trading Prep Week 03.02 - 03.07.25Last Week :
Globex opened above VAH of 6054 - 5933 HTF Range and February RTH Cost basis which gave a hold to start the week to push us into the above Edge but more strength didn't come in, instead we ended up holding under 6074 - 60s and closer to Monday RTH open price failed in the Edge giving us a move into lower Value with a close inside it. Holding under Cost Basis meant weakness for longer term buyers and triggered moves lower all week as they needed to get out closer to month end we got. Lower Edge kept giving bounces back into Value which kept building more supply and when MM Month end came on Thursday we were able to take the stops under 5930 to give us continuation to test lower Value under 5870s. To finish the week we found buying inside lower Value and what I think was end of the Week short covering before the weekend which pushed us back into the Edge in the afternoon, all momentum traders had to do was buy it up under the Edge to push price back inside which triggered stops on the way up to give us end of day squeeze back into above VAL where all the supply was.
This Week :
We are starting a new Month and things can be tricky to start, we are at interesting locations on Weekly, Daily and Hourly charts with quite a few options going into this week so we really have to be open to different scenarios as things are not as clear as they were last 2 weeks going into Month End.
On Daily TF we have showed a failure over Daily Edge Top and at the same time have transitioned into a correction mode under it which gave us the move from Daily Edge into Daily VAH at 987 - 67 and flushed the buyers under it through Daily Mean towards Daily VAL at 846 - 28 without tagging it. End of week covering took us back into Daily VAH but left Daily TF in Correction mode under its MAs.
On Weekly TF we had a long consolidation in new Weekly balance over 5950s but we never transacted through the whole balance which means no acceptance in it, instead we built up a lot of Supply inside which at the end of the Month gave us this move back into lower Balance with a strong break and close under smaller MA with price closing right at the top/bottom ( depends which way we look at it ) of Weekly Balance. For now this tells us that we could see more weakness going into this new Month, as long as we hold under Weekly Smaller MA which is around 6010s and don't accept back above Daily VAH of 5987 - 67 then that could bring in continued weakness to rotate lower back towards Daily Mean and possibly test Daily VAL and maybe see a push under it.
Holding under the Daily Edge of 6073 - 43 implies continued weakness as well and will continue to target lower Daily areas all the way down into its bottom Daily Edge at 5754 - 24 which has Weak Stops and a Gap to fill under which was made during contract roll. Does not mean we will go there right away or go there at all of course BUT there are lots of things stacked up for more downside so far, of course we have to watch each area for continuation through but if there is still more sell volume to come out then we have to watch out looking for much higher prices from here and instead look for balances with weakness and rotations back down.
This week could play out as an inside week with weakness towards the bottom of previous week and IF there will be stronger volume then we could see last weeks lows get taken to give us pushes towards Previous Distribution Balance that we have made back in October which would be next big spot to visit.
On the Upside IF buying from Friday sticks and we start holding over 5930 - 40s then need to be careful forcing downside as we could build up enough and bring in more buying to push into above Value again, we do have trapped buyers inside it from last week so it would be a spot to be careful at as we could continue to see selling out of that Value on any pushes into it, for more strength inside that Value we would really need to push through VAL and start holding over 5970 - 90s which would signal stability and could have the price balance inside that Value and of course for anything higher we would need to take out February RTH cost basis above VAH because we have most of the buying from last few months trapped over it.

SPY Will Go UP! Buy!
Hello,Traders!
SPY is trading in an
Uptrend along the rising
Support and we are already
Seeing a bullish rebound
So we are bullish biased
And we will be expecting
A further bullish move up
Buy!
Comment and subscribe to help us grow!
Check out other forecasts below too!

MES!/ES1! Day Trade Plan for 02/28/2025MES!/ES1! Day Trade Plan for 02/28/2025
📈5915
📉5860
Like and share for more daily ES/NQ levels 🤓📈📉🎯💰
*These levels are derived from comprehensive backtesting and research and a quantitative system demonstrating high accuracy. This statistical foundation suggests that price movements are likely to exceed initial estimates.*

Hellena | SPX500 (4H): LONG to resistance area of 6140.Dear Colleagues, price has gone lower than I thought it would and now we need to redraw the waves. Apparently, the price has updated the minimum of wave “2”. Therefore, I believe that the price will soon continue the upward movement in wave “3” anyway.
The “ABC” correction seems to be completed and the 5915 area served as support for the second time.
I expect the price to touch this area once again and then continue to the resistance area of 6140.
Or it will immediately start moving towards this area.
Manage your capital correctly and competently! Only enter trades based on reliable patterns!

MES!/ES1! Day Trade Plan for 02/27/2025MES!/ES1! Day Trade Plan for 02/27/2025
📈6016
📉5976
Like and share for more daily ES/NQ levels 🤓📈📉🎯💰
*These levels are derived from comprehensive backtesting and research and a quantitative system demonstrating high accuracy. This statistical foundation suggests that price movements are likely to exceed initial estimates.*

MES!/ES1! Day Trade Plan for 02/26/2025MES!/ES1! Day Trade Plan for 02/26/2025
📈6035
📉5955
Like and share for more daily ES/NQ levels 🤓📈📉🎯💰
*These levels are derived from comprehensive backtesting and research and a quantitative system demonstrating high accuracy. This statistical foundation suggests that price movements are likely to exceed initial estimates.*

Combined US Indexes - Incoming Break or Bounce ?From the previously marked timeline on 18 Feb 2025, just days later, you see the combined US Indexes plummet to cut through the middle decision box (purple), and extrude out below. This formed the double top second peak in essence, and the days following just closed at a two month low.
While this might appear Bearish, it is worth noting the lower tails in previous candles which are followed by rallies to the upper resistance. Would this happen the third time?
I would beg to differ...
In fact, marked out is a critical support point which should be tested in early March. At that point (yellow ellipse), there is a confluence of a previous trend change support, the current TDST and just below that the larger consolidation range support.
While the RoVD is slightly bullish, the MACD is dipping with MACD in bearish lower half, and the signal line tapering down towards the boundary into bear territory.
In summary, it looks slightly bearish to the critical support point. From there, it would be good to see if it bounces or it breaks down.

MES!/ES1! Day Trade Plan for 02/24/2025MES!/ES1! Day Trade Plan for 02/24/2025
📈6075, 6095
📉6035, 6015
Like and share for more daily ES/NQ levels 🤓📈📉🎯💰
*These levels are derived from comprehensive backtesting and research and a quantitative system demonstrating high accuracy. This statistical foundation suggests that price movements are likely to exceed initial estimates.*

Hellena | SPX500 (4H): LONG to 100% Fibo lvl 6214.4.Colleagues, I believe that the upward movement is not over yet and the lower and middle order wave “3” is not yet complete. This is a good chance to go long, but it should be remembered that even though a correction to the uptrend line is possible, I do not recommend selling.
The target area is the 6214.4 level area - this is slightly higher than the 100% Fibonacci extension level.
Manage your capital correctly and competently! Only enter trades based on reliable patterns!

SPY Bearish Breakout! Sell!
Hello,Traders!
SPY was trading in an
Uptrend but then the index
Made a bearish breakout
From the bearish wedge
Pattern and we are locally
Bearish biased and we will
Be expecting a local
Bearish move down
Sell!
Comment and subscribe to help us grow!
Check out other forecasts below too!

MES!/ES1! Day Trade Plan for 02/21/2025MES!/ES1! Day Trade Plan for 02/21/2025
📈6135-6145
📉6115-6105
Like and share for more daily ES/NQ levels 🤓📈📉🎯💰
*These levels are derived from comprehensive backtesting and research and a quantitative system demonstrating high accuracy. This statistical foundation suggests that price movements are likely to exceed initial estimates.*

MES!/ES1! Day Trade Plan for 02/20/2025MES!/ES1! Day Trade Plan for 02/20/2025
📈6155-6165
📉6135-6125
Like and share for more daily ES/NQ levels 🤓📈📉🎯💰
*These levels are derived from comprehensive backtesting and research and a quantitative system demonstrating high accuracy. This statistical foundation suggests that price movements are likely to exceed initial estimates.*

MES!/ES1! Day Trade Plan for 02/19/25MES!/ES1! Day Trade Plan for 02/19/25
📈6150-6155
📉6120-6115
Like and share for more daily ES/NQ levels 🤓📈📉🎯💰
*These levels are derived from comprehensive backtesting and research and a quantitative system demonstrating high accuracy. This statistical foundation suggests that price movements are likely to exceed initial estimates.*

SPY Bullish Breakout! Buy!
Hello,Traders!
SPY is trading in a strong
Uptrend and the index made
A bullish breakout of the key
Horizontal level around 608$
So we are bullish biased and
We will be expecting a further
Bullish move up
Buy!
Comment and subscribe to help us grow!
Check out other forecasts below too!
