MES!/ES1! Day Trade Plan for 02/13/25MES!/ES1! Day Trade Plan for 02/13/25
📈6100-6120
📉6060-6040
Like and share for more daily ES/NQ levels 🤓📈📉🎯💰
(💎: IF THERE IS NOT MUCH VOLATILITY; FOCUS ON ZONES VERSES INDIVIDUAL PRICE LEVELS)
*These levels are derived from comprehensive backtesting and research, demonstrating over 90% accuracy. This statistical foundation suggests that price movements are likely to exceed initial estimates.*
Snp500

Hellena | SPX500 (4H): LONG to the area of 6136.8 (Wave 3).Colleagues, I believe that wave “2” has completed its development and now I expect the upward movement to continue in wave ‘3’, which should break the maximum of wave “1”.
So far, I set the target as a minimum in the area of 6136.8.
Manage your capital correctly and competently! Only enter trades based on reliable patterns!

MES!/ES1! Day Trade Plan for 02/07/25MES!/ES1! Day Trade Plan for 02/07/25
📈6148-6154
📉6075-6068
Like and share for more daily ES/NQ levels 🤓📈📉🎯💰
(💎: IF THERE IS NOT MUCH VOLATILITY; FOCUS ON ZONES VERSES INDIVIDUAL PRICE LEVELS)
*These levels are derived from comprehensive backtesting and research, demonstrating over 90% accuracy. This statistical foundation suggests that price movements are likely to exceed initial estimates.*

MES!/ES1! Day Trade Plan for 02/06/25MES!/ES1! Day Trade Plan for 02/06/25
📈6132-6140
📉6060-6050
Like and share for more daily ES/NQ levels 🤓📈📉🎯💰
(💎: IF THERE IS NOT MUCH VOLATILITY; FOCUS ON ZONES VERSES INDIVIDUAL PRICE LEVELS)
*These levels are derived from comprehensive backtesting and research, demonstrating over 90% accuracy. This statistical foundation suggests that price movements are likely to exceed initial estimates.*

MES!/ES1! Day Trade Plan for 02/05/25MES!/ES1! Day Trade Plan for 02/05/25
📈6067-6069 ; 6107-6109
📉6030-6027; 5990-5987
Like and share for more daily ES/NQ levels 🤓📈📉🎯💰
(💎: IF THERE IS NOT MUCH VOLATILITY; FOCUS ON ZONES VERSES INDIVIDUAL PRICE LEVELS)
*These levels are derived from comprehensive backtesting and research, demonstrating over 90% accuracy. This statistical foundation suggests that price movements are likely to exceed initial estimates.*

Two Daily Gaps attract market for pullbackAlthough S&P500 is within uptrend, recent days has left two clearly visible gaps behind. That means that it is highly possible that SPX will come back to cover those gaps in the near future, before it continue uptrend (if it will). Same picture at NDX chart with two 4H gaps.
I take this idea to apply to all markets including crypto. While chances to resume higher timeframe uptrend are valid for Bitcoin, Stock Indices will most probably influence it's short term price action.

Trade the Crude OIl Range Shorts and Longs Crude oil perspective going into Inventories data highlighting solid levels for longs and shorts

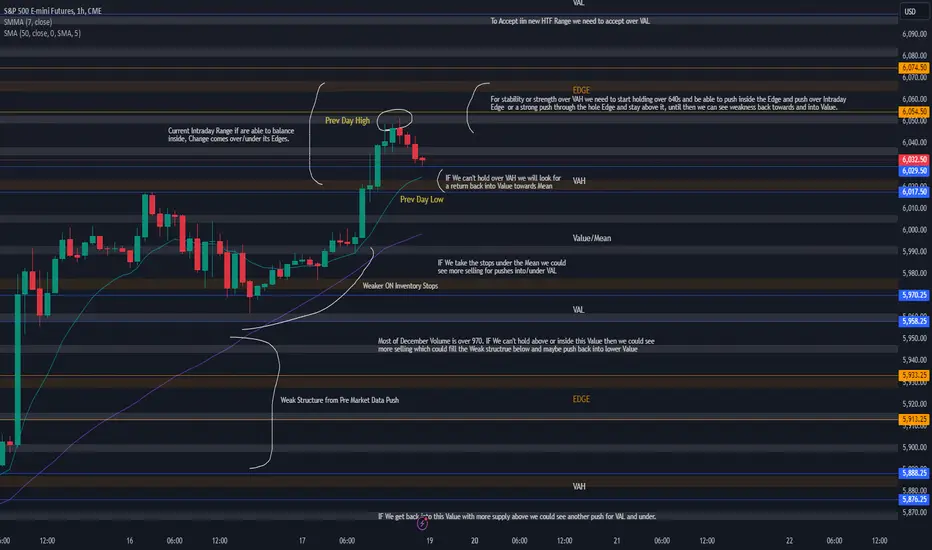
#ES_F Day Trading Prep Week 2.02 - 2.07.2025Last Week :
Globex opened inside VAL under the Weak stops from previous sessions that we have market off which signaled weakness, under 6100 market started taking out lower stops and key areas which gave a big flush into lower Value during ON hours to start the week but we ran out of selling after looking below lower VAL and rotated out of Value from there. RTH Session did not bring anymore size selling, instead we were able to hold above Value take in all the Supply and move back into/above upper Edge which brough stability and pushed us into 6114 - 064 Intraday Range where we found balance. End of week price made a push into upper Value again but the move was done during ON lower Volume hours and once we hit the bigger area of supply/where we previously found bigger sellers over 6144 the whole push came apart and gave us another move under VAL into the Edge where we closed right at a big area without really breaking under.
This Week :
This week is really tricky to try and call because we have new month starting, we had some news over the weekend which has made a lot of people bearish or at least think that we should be bearish and either open on gap down or continue lower, we have seen strong selling from above areas which probably trapped buyers to give us more weakness BUT as much as I like to cheer for the downside and a good correction most of the time as I am a short seller, we have to be careful here because we are at important HTF areas which if we don't get the needed volume to stay under could bring stability and continue to give us balancing action over them.
We will have to see what we do on the open tonight and during ON sessions to really get a better picture but we can have a plan and keep things in mind that IF they start happening then we can be ready. Daily TF for now is still in uptrend after a failed correction in mid January and we are just grinding over smaller Daily MA with buying interest running out over 6100s which is giving us this sideways/selling action, weekly TF also grinding over its smaller MA and has closed right around weekly balance mid area after failing to hold under its low which is in 940s this could mean that we may potentially continue holding and grinding/sideways with weakness until we see some bigger change.
Daily Edge top is around 6070 - 40s we would need to either see a push that can close under 50s to signal acceptance back in lower HTF Range or a push under with continuation to/through lower VAH which can then bring in more sellers and give us continuation towards lower targets at VAL/Edge and if things get really ugly to push us through 933 - 913 Edge from where we need to watch out for further continuation towards our Previous Distribution Balance.
On the other hand we need to be careful forcing the short side under 6060-50s unless market can clearly show us that it wants to be under, if it does not then we can watch for us to stay inside Current Intraday Range where we could balance and maybe tighten up the ranges as things have been pretty wild, if this will be the case then we could see stronger sells coming from areas closer to above VAL and from inside/above it, weakness from VAL can continue until we can push into Value and start balancing around the Mean area without getting back under 6114.

SPY POTENTIAL SHORT|
✅SPY price went up sharply
But a strong resistance level was hit at 610.73$
Thus, as a pullback is already happening
And a move down towards the target shall follow at 596.00$
SHORT🔥
✅Like and subscribe to never miss a new idea!✅

SPY Move Down Ahead! Sell!
Hello,Traders!
SPY is trading in an uptrend
So we are bullish biased
Long-term, however the index
Has hit a horizontal resistance
Level of 610.93$ and we are
Already seeing a local bearish
Pullback from the level
So we will be expecting
A further local move down
Sell!
Comment and subscribe to help us grow!
Check out other forecasts below too!

MES!/ES1! Day Trade Plan for 01/31/25MES!/ES1! Day Trade Plan for 01/31/25
📈 6138.80, 6154.60
📉 6115.25, 6090.50
Like and share for more daily ES/NQ levels 🤓📈📉🎯💰
(💎: IF THERE IS NOT MUCH VOLATILITY; FOCUS ON ZONES VERSES INDIVIDUAL PRICE LEVELS)
*These levels are derived from comprehensive backtesting and research, demonstrating over 90% accuracy. This statistical foundation suggests that price movements are likely to exceed initial estimates.*

Hellena | SPX500 (4H): SHORT to the low of wave “a” 5920.Colleagues, the price reached the 5920 level too quickly, so I tend to believe that wave “2” is not completed. It should consist of 3 waves “abc” so I expect the low of wave “a” 5920 to be updated.
Manage your capital correctly and competently! Only enter trades based on reliable patterns!

Hellena | SPX500 (4H): SHORT to the area of 50% Fibo lvl (5972).Colleagues, I believe that price is completing wave “1” and I believe that a correction in wave “2” is inevitable.
I expect the price to reach the area of 38.2% - 50% Fibonacci levels (5972.9). I believe that a small update of the maximum of wave “1” is possible.
Manage your capital correctly and competently! Only enter trades based on reliable patterns!

#ES_F Day Trading Prep Week 1.26 - 1.31.25Last Week :
Last week we opened over the Value of 6054 - 5933 HTF Range and were able to hold over, when we got over the Edge that brought in more buying that gave us a push into new HTF Value of 6195 - 6074 Range where we have sold off from before after contract roll and we closed Friday with a rejection from a push into VAH.
This Week :
Last week of the month, new president is in, what can we expect this week ?
Well looking at the structure we had a perfect rejection from the top on Friday which of course doesn't exactly have to be a top but if it were one it would be a very good looking one on the Daily TF if it was one.
Going into this week IF we can't get over VAH and hold over 6160 - 70 to build supply to take higher over upper Edge then we could see balancing inside the Intraday Range of current Value to build supply and digest the move we had last week that is IF we have truly accepted in this 6195 - 6074 HTF Range. IF we have not found the needed acceptance here and we start getting continuation into VAL we have Poor/Weak RTH Lows there at 6111 which we could aim for, If taken out that could give us more selling to at least fill the Gap we created into 6093 area.
From there we would watch if we absorb all the selling and can get back into above Value or if we can't and we hold under 6100 then we could see more selling to push into lower Edge and IF we happen to get inside it under 6070 then moves back towards lower VAH/Value are not out of the question as long as we can get through 6050s

MES1!/ES1! Day Trade Plan for 01/24/25MES1!/ES1! Day Trade 🎯 for 01/24/25
📈 6190.25 (NEXT LEVELS: 6166.25, 6220)
📉 6094.75 (NEXT LEVELS: 6118.75, 6075.5, 6065.25)
*The target levels have experienced some discrepancies over the past few days, prompting adjustments to enhance accuracy. We are highly confident in the revised target levels for tomorrow, Friday, the 24th. Thanks!*
Like and share for more daily ES/NQ levels 🤓📈📉🎯💰
*These levels are derived from comprehensive backtesting and research, demonstrating over 90% accuracy. This statistical foundation suggests that price movements are likely to exceed initial estimates.*

MES!/ES1! Day Trade Plan for 01/23/25MES!/ES1! Day Trade 🎯 for 01/23/25
📈 6166 (NEXT LEVELS: TBD)
📉 6056.75 (NEXT LEVELS: TBD)
1/2 way mark 📈 6138.75 & 📉 6084.25
Like and share for more daily ES/NQ levels 🤓📈📉🎯💰
*These levels are derived from comprehensive backtesting and research, demonstrating over 90% accuracy. This statistical foundation suggests that price movements are likely to exceed initial estimates.*

Hellena | SPX500 (4H): LONG to resistance area 6104 (Wave 3).Colleagues, I see that the price has completed wave “4” and is now forming wave “5” of the higher order.
I believe that the price may go into correction in the lower wave “2” to the area of 50% Fibonacci level 5896.9, after which I expect the upward movement to continue to the resistance area 6104.
The upward movement is the priority, so I warn that the price may just continue to move upward, updating the wave “1”.
Manage your capital correctly and competently! Only enter trades based on reliable patterns!

MES!/ES1! Day Trade Plan for 01/22/25MES!/ES1! Day Trade 🎯 for 01/22/25
📈 6143 (NEXT LEVELS: TBD)
📉 6049 (NEXT LEVELS: TBD)
1/2 way mark 📈 6120 & 📉 6073
Like and share for more daily ES/NQ levels 🤓📈📉🎯💰
*These levels are derived from comprehensive backtesting and research, demonstrating over 90% accuracy. This statistical foundation suggests that price movements are likely to exceed initial estimates.*

#ES_F Day Trading Prep Week 1.20 - 1.24Market closed outside of Value after failing under 6074 - 54 HTF Edge.
We are set to open inside 6064 - 23 Intraday Range unless market gaps under/over after Mondays Holiday but if we open inside it then that tells us we are over Value and there are two thing we can do here, continue grinding/balancing inside the Intraday Range and try to push towards/into above Edge ?
Or do we find more selling over Value that would bring us back into/under VAH, if we get under VAH we would be under Daily Stops so that could trigger moves towards the Mean/VAL of the range. If we do get back inside the Value we could find support and holds around it BUT careful if we take out out and get under Value, that can bring in more weakness for lower targets where we would watch for any continuation.
IF the strength from last week stays, for us to see any bigger prices out of this HTF Range we would need to hold over VAH and have a strong push into or over the above Edge that would stay over, until then we have December supply trapped over 6050 - 74 so we may stay under this area and most of December Supply is valued over 930 - 70s and we have January month end approaching which means if more size needs to lighten the bag that could trigger some lower destinations.
MES!/ES1! Day Trade Plan for 01/17/25MES!/ES1! Day Trade Plan for 01/17/25
📈 6047.25 (NEXT LEVELS: 6066, 6075.5, 6084.75)
📉 5969.75 (CLOSER LEVELS: 6018, 6008.5, 6000)
1/2 way mark 📈 6027.75 & 📉 5989.25
Like and share for more daily ES/NQ levels 🤓📈📉💰
*These levels are derived from comprehensive backtesting and research, demonstrating over 90% accuracy. This statistical foundation suggests that price movements are likely to exceed initial estimates.*

MES!/ES1! Day Trade Plan for 01/16/25MES!/ES1! Day Trade Plan for 01/16/25
📈 6060
📉 5940
1/2 way mark 📈 6031 & 📉 5969
Like and share for more daily ES/NQ levels 🤓
*These levels are derived from comprehensive backtesting and research, demonstrating over 90% accuracy. This statistical foundation suggests that price movements are likely to exceed initial estimates.*

SPY Gap Filled - Local Bottom - More SendTrading Fam,
I am not overlooking the small H&S pattern seen on this chart. I am simply presenting alternative data. What if that H&S pattern fails? It can happen. Even if we do drop further, our target down is that pink horizontal trendline. Will we get there before more buying ensues? Possibly. But this market is still bullish. The larger bull trend is still very much in tact.
Additionally, we can see that an important gap has been filled. Therefore, it is very possible that the small H&S pattern we see here will not reach its target down. If that is the case, we'll turn up again, continue through my Target #2 which was already hit, and proceed onward and upward to my final Target #3 (670-700) until that is reached sometime in 2025. Therefore, you are not wrong to start DCA'ing in at this point.
✌️ Stew

Weekly Leading Indicators are all GO BearPretty much enough said.
Warning given weeks ago.
Now it is turning.
ALL the leads are bearish, red flags ON
Just waiting for the playbook to pan out with a hard pull back. Last week we already saw the equity markets do a trend reversal pattern of Lower Highs and Lower Lows.
Time to deliver the main Bearish course...
Stay safe!
