SPY Long From Support! Buy!
Hello,Traders!
SPY is trading in a strong
Uptrend an the index is
Already making a bullish
Rebound from the local
Horizontal support below
At 584$ which reinforces
Our bullish bias and makes
Us expect a further move up
Buy!
Like, comment and subscribe to help us grow!
Check out other forecasts below too!
Snp500

#ES_F Day Trading Prep Week 11.17 - 11.22.24Last Week :
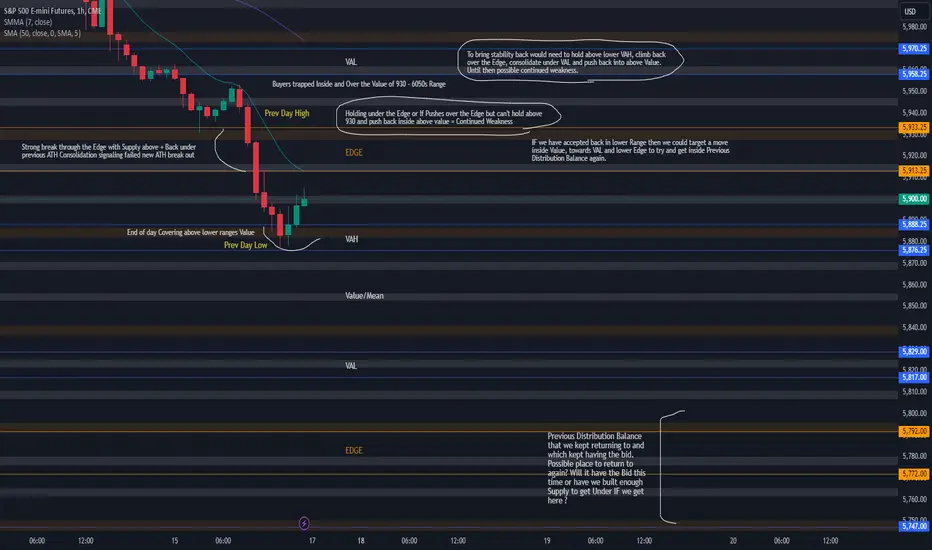
Last week played out very well even though middle of the week had us thinking that maybe market will continue to hold inside Value above 970s as we kept getting buying in that area but it just took time to build up for the break of that cost basis at VAL to give us more selling end of week. Sunday Globex again opened over Value and grinded towards the upper Edge but we had no tag or push inside it which signaled weakness and as noted if that did no happen we needed to be careful looking for acceptance inside that new range and instead possibly look for this move to return back toward previous Edge and get back under 930s to possibly signal a failed new ATH break out by getting back under Previous ATH Consolidation. We first failed over Value and got the push back inside to correct the Poor low from Previous Weeks Friday Globex which was around the Mean area of that range which kept getting buying that gave us moves back to VAH but we slowly transitioned into correction first on Hourly then on 2hr and finally on 4hr to end the week on Friday with a break/hold under VAL smaller cost basis which gave us more weakness and selling to finish the Week under the lower Edge.
This Week :
So far looking at the structure of Daily/Weekly and the way we closed on Friday we could gather some info to help us go into this week. On Weekly TF we had a failed break out into new balance over 5950 which returned back inside Previous Balance of 950 - 660s, on Daily TF we hit a key upper Edge of the Range, held under it, built some supply and got back trough its VAH and made a move under its Mean area, under Previous ATHs consolidating potentially signaling a failed new ATH break out with a strong close under the smaller Daily MA. On Hourly's we have trapped Supply in above Range and reversed the whole move back under 930 - 13 Edge.
All of this so far screams weakness and continuation lower to me, of course we have to be careful as market could hold and start balancing here above lower Mean/Value and even try to get back inside and over upper Edge which could bring stability back but I think we would need to do all that and be able to hold over 930s AND get back over above VAL in order to see real stability or strength return.
Holding under the Hourly's Edge and under Daily Mean/under Previous ATHs we are looking for possible continuation towards 840s - 20s areas which would put us inside lower Value with a visit of its VAL which is also Daily VAL, these areas could provide covering if we get there BUT if we get through them then we can't forget about our favorite Previous Distribution Balance which market liked returning back into so much into 800 - 750s area which kept having our strong bids that would give us pushes away this is also Daily Edge low as that is a potential return target after failing at upper Edge. Will we get all the way there this week or not ? who knows but that is our possibility and something to watch moves towards as the week develops, question is when or if we get there will that area act as absorption area of all this Supply coming out and be enough to give us a good hold OR we have some nice longer TF stops under it which if we took could give us more supply to try another push for our lower Roll Gap which we have been building up to fill. This seems like a big move so maybe not all the way to fill the gap but it is in the cards if the weakness continues as that is also around Previous Weekly balance lows and if we get under 820 - 05 ( Weekly mid ) then that open the doors for it.
To think higher prices from here again we would need either a strong bid to push us back through the upper Edge and be able to hold over 920-30s AND have the buying to eventually get us back inside above Value, or at least hold over 860s, consolidate without going lower and make a push for upper Edge. Until then will watch the short side or some sort of consolidation balance to be playing out.
Weekly Leading Indicators: BEARISHManaged to streamline down to these couple of charts for a set of leading indicators. Simple trend analysis and techincals are being used here for Weekly charts and so weekly analysis is appropriate to set the stage for a top down view.
First up (on the top right corner) is the Combined US equities chart that shows a strong marubozu the previous week (from elections outcome). However, the following week was not a confirmation, but instead casts doubt on the sustainability of the spike to rally on.
Point being, the massive breakout is met with a Dark Cloud Cover that breaks back into the Decision Box (purple box) which was previously marked out for the consolidation range boundaries. Typically when a breakout is followed by a breakin, it tends to follow through to the other end... a break down from the box support. Yellow circle is where it should go through or bounce at.
What gives on this is that the following Leading indicators are eluding to...
SG10Y Govt Bond Yields
The uncanny correlation of this to the US Equities Indexes is remarkable and have been a hallmark of my recent posts and analyses. Here we have a breakout of the trendline resistance. Means equity markets are going Bear.
RED Flag
High Yield Bonds ETF (JNK)
JNK looks to break the uptrend trailstop line, with a lower high that now has a Dark Cloud Cover as well.
AMBER Flag
TIPS and TLT
Both have broken uptrend trailstops and are downtrending with a recent low. These are well known market leading indicators.
RED Flags
Semiconductor ETF (SOXL)
Noted, and personal favourite, SOXL is clearly bearish from simple candlestick patterns.
RED Flag
So, overall, we have Leads telling us it is BEARISH again.
Heads up!

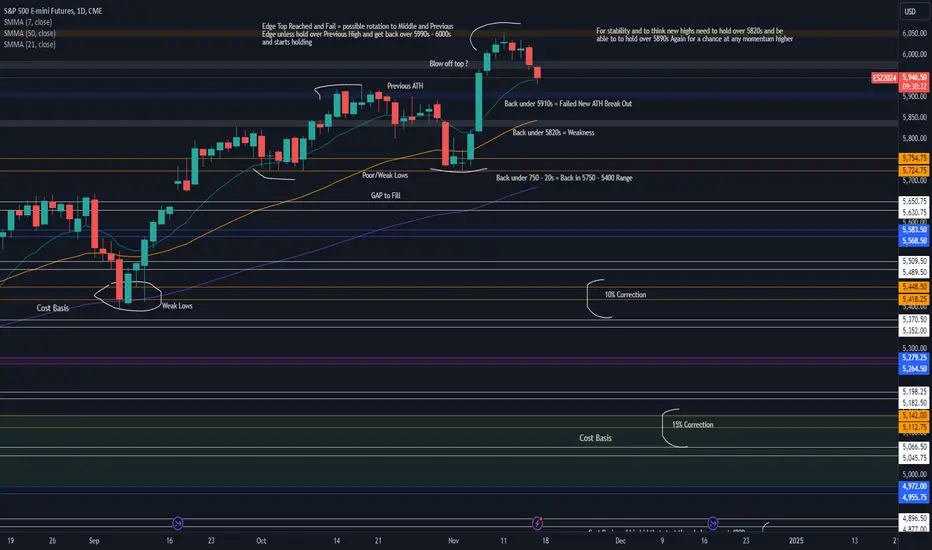
ES_F Daily LONGER Term OutlookThis is a Daily chart I have been tracking for some time using HTF Balance Ranges and Structure, it may or not play out and if it does then I would think this back fill/correction can take a long time to play out, I would say over a year+ so this is not for day trading or short term swing trading but it is something to possibly keep in mind and help track our movement with IF THEN statements and potential targets lower. 4800 area is something I have been tracking for a while that is an area to me that start our whole move which brought us here and I would not be surprised if we tried to back fill at least most of the way towards it. Again this can take a long time to play out but at least something to refer to in order to manage expectations for new highs and areas of interest for the market.
Not much else to say I tried to make notes on the chart it self so its easier to track.
For stability in the market we would need to not get back under 5820s - 5750/20s Areas and build bases over it then get back over 5990 - 6000 to think new highs, until then we could keep building supply and moving it to lower targets.
For Day Trading refer to Weekly Day Trading Plans.
#ES_F Day Trading Prep Week 11.10 - 11.15.24Last Week :
Last week market opened under 5792 - 72 Edge which meant weakness to start the week and gave us moves towards lower VAH but again we kept getting buying at and under Previous Distribution Balance low and inside Value. We knew to be careful and that holding over 730s meant there is no need for larger supply to sell out. 724 was also an important area on Daily TF as it was the bottom of Daily Edge which we broke out of after our roll gap in September, we tested it but there was no break or any continuation under it. We knew if market gets back over 790s that could bring back strength to push back in Previous Value which is what we got on Tuesday leading into Election Results. Election Globex gave a huge move which continued higher towards 930s - 770s ranges Edge, took it out, consolidated and rest of the week we got lower volume grind higher into a new range to finish the week with a failure over new Value.
This Week :
Not easy to trade ATHs especially if we get them every few weeks or months and of course this move could be viewed as strength to bring in more buying that can keep us in this range or even continue grinding higher BUT something to keep in mind as few things are lining up here.
We have made an Edge to Edge push on Daily TF ( reaching big Edge areas more often than not provides reaction in opposite direction ) , we have extended away from Daily MAs with a strong impulse that gave us blow off the top sort of move over our Previous Highs consolidation, we have finished the week with a failed or sort of failed push over VAH since we didn't fully come back in and held over 920s , we didn't reach new ranges top.
Now all this doesn't mean we can't hold and continue balancing/grinding higher towards that Edge top and over still BUT if all this buying over 930s was from all the late buyers/traders who sat on their hands during the election days, came in saw areas holding and were buying for continuation to make money off momentum then they were also probably unloading as it went higher and might not have plans to hold this up long term unless market continues in their favor. If market does not continue in their favor and we get back under VAH / 620s then we could see this thing start moving towards their cost basis, we have Poor Globex low holding one of them up around the Mean of the Range, if that gets taken we will look for continuation towards VAL which has another cost basis and a base below it which could give us covering/holds in that area BUT I would not trust those areas for a longer term position, if market cant keep holding over the Mean/VAL of this range then we could see it come all the way back into lower Edge and maybe even under our Previous Highs to signal a failed new ATH break out. Will this all happen in a week or will it be a slow process is for us to find out, we don't really have market moving data to start the week and if we don't get new buying to keep pushing us then we at least can look for this process to start and see how it goes.
On the other side for this move to stick and to think higher prices from here we would want to see us hold over VAH or at least push back towards the Mean/Hold over and get back over VAH as we need to get over 640s and test the upper Edge with holds inside or right under the Edge after the test, until this happens I will lean more towards a move back inside Value towards VAL and potentially finding our top around here.

Combined US Equities - Put away all technicals for now.Oddly enough, I did not follow one of the great events of 2024. And prior analyses was made on technical indication.
When a reversal like this happens, it is rather extreme, and technicals can be put aside. With the election outcome, markets are suddenly RISK ON and very bullish.
You see this bullishness with a Marubozu type candle that broke through two resistance levels in one day - breaking into and out of the Decision Box marked.
MACD is now skewed to the bullish side although VolDiv has yet to follow. This means price moved a lot before volume.
Previous projection is redundant now.
The only indication was that the day before yesterday, a nice small bullish candlestick was suggesting a breakout to the upside.
Going forward, just enjoy the ride, and make sure you have rules to adhere to!
All the best!

SPY GROWTH AHEAD|LONG|
✅SPY will soon retest a key support level of 564$
So I think that the etf will make a rebound
And go up to retest the supply level above at 580$
LONG🚀
✅Like and subscribe to never miss a new idea!✅

Market Leading Indicators - suggests DOWNThis is my most summarized panel of leading indicators which I use to assist in the determination of market projections, over and above technical indicators.
The SG10Y is about to break out
The JNK bonds are breaking down
Both TIPS and TLT have already broken down the uptrend support (bearish trend now)
The SOXL (semicon ETF) and the combined US Equities are just about to keel over.
Leads have turned down or are at the turning point.
Heads up!

#ES_F Day Trading Prep Week 11.03 - 11.08Last Week :
Sunday Globex opened right over the Mean of Value and gave a push back to VAH where we spent the night and RTH of Monday consolidating under, staying under VAH meant weakness for us going into the week and we kept seeing flushes towards VAL but every move towards it was mostly done during ON hours and would be bought back up over 840s. Finally midweek buyers saw no continuation and we got an RTH volume sell that closed under the Mean into the Key Area that needed to be taken out for continuation into VAL.
Once under VAL all the buyers in Value and over were trapped for Supply and once we failed to get back into Value we saw the continuation sell back into Previous Distribution Balance with a strong break of Lower Edge to put us back into lower HTF Range of 790 - 630s. We did another look below 750 end of day Thursday which failed to continue that night and gave rotation back into to the Edge and Friday we most likely saw short covering before the Weekend after a big move that gave us a push to that balance top with a failure to hold over and finished with a close under the Edge trapping more supply.
This Week :
Could be another tricky week as we have election coming up Tuesday and some bigger data on Thursday so of course have to be careful trading this week but what can we sort of expect after last week ?
We are back in Previous Distribution Balance of 750s - 800s and IF we do have enough covering and buying still then that could keep the price around it with moves out of it finding their way back in as one of the scenarios BUT this what is different this time around from the time that we spent in this balance before is that now we have plenty of supply and trapped buyers built up over us in the above ranges Value and Over it, plus the Supply that got built over Thursday and Friday inside it, with a push and close under the Edge this shows us acceptance in this lower range and IF we don't have the buying to keep us up we get through that 750s area then I would look for continuation pushes into the Mean and VAL area which has a bigger Cost Basis that we made a while ago with a Gap which happened during a contract roll that we could try to get into. IF we do get there then that would be an area to be careful around as we can see covering there under Value and above lower Edge but it's not something I would build a house on because size can take it out and that could bring more selling to test the lower Edge and maybe a peak under it.
We don't have any news or data on Monday so we have to ask will the buyers from Thursday/Friday want to hold this product into Election Day or did they Sell Friday into the short covering and the ones who didn't will sell out once we take the stops which can bring the continuation move under VAH that we are looking for.
To not get too short biased, IF we are able to hold over VAH/750s and see a push back over the Edge then we would need to see price hold over 790s to bring back stability AND once stability is back would need to see a push back into above VAL, until then need to be careful looking for higher prices from the Edge as we could either balance under the Edge/VAH area or get continuation to lower targets.

SPY Will Go UP! Buy!
Hello,Traders!
SPY is trading in an
Uptrend and the etf is
Now making a local correction
Towards the horizontal support
Of 564$ from where we will
Be expecting a further
Bullish move up
Buy!
Like, comment and subscribe to help us grow!
Check out other forecasts below too!

Hey SPYLOVERS here are 3 Scenarios for this week check it out...Another week analyzing SPY's behavior correctly as we planned. I’d like to invite you to review my previous analyses of the price movements throughout the week, so you can see that I base my strategy solely on price action and institutional supply and demand concepts—simple methods that the price has respected.
In this case, we won’t be seeing historical highs anytime soon. I believe we’re in a pullback where we need to monitor closely to see if the price might return to the order block I have around $563.60. This area is significant because it’s where the highest concentration of orders in the market is currently positioned.
If we look at the last candle SPY closed with, although it ended higher than the previous one, it’s still showing selling pressure, so we’ll likely continue on the path of selling for a few more days.
The key is to analyze the next move the price makes when it touches the order block:
Here are 3 possible Scenarios.
Scenario 1. If the price reaches this zone ($563.60), it might dip a little further as a fake-out before bouncing back strongly. Here, we need to pay close attention to the candlestick pattern that appears in this area.
Scenario 2. If it respects the order block but doesn’t bounce with enough strength, we might be witnessing a Head and Shoulders pattern forming, which could later bring the price to the inflection zone (the blue middle area).
Scenario 3. If the price breaks my order block with strength and volume, then we’re validating a CHoCH (Change of Character), where we could see the price move to the inflection zone (the blue middle area).
No matter what happens, remember to always watch the candlestick pattern and the volume. That’s the main fuel behind the price's strength, and analyzing it this way will make your analysis more accurate.
Thank you for supporting my analysis. TRADE SAFE! Best regards.

Combined US Equities Lousy Breakout means BreakdownThe combined US equities chart failed to push significantly and is consolidating. when it does this, it looks like it is rolling over to fall off a cliff.
IF we look carefully, besides the weakening technical indicators, there is also weakening price action, with the second or third lower high in the hourly time frame.
That said, the decision box needs to be broken out of, and then the critical support (red line).
Once these give way, it would be too obvious and there should be a sizeable retracement to the previous support, now being the downside target.

#ES_F Day Trading Prep Week 10.27 - 11.01Last Week :
Last week Sunday Globex opened right at the upper Edge with a sell back to VAH. Going into the week being under the Edge and under 900 was our key to see moves back to Value, we saw pushes inside Value Monday RTH and Tuesday Pre Market which were bought up until we built more supply right around VAH which finally gave us a move into Value for the 70 - 50s and 40s targets. We did get enough Volume to make it all the way down to VAL and through towards the lower Edge but ran out of Supply right at the top of Previous Distribution Balance and were able to come back inside Value. We ended the week with another attempt out of VAH which ran out of buying and came back inside Value to take back the whole move which was done during Globex hours to close under the Mean right into the Intraday Range Edge of 41 - 36.
This Week :
Looking at this weeks chart and price location it's not as easy to read as there are lots of possibilities which could happen. We are going into Month end week, have quite a bit of market moving data, supply in Value and above, and covering at and under VAL.
30m , 2h, 4h are in correction mode, 1hr not quite there just yet if we are looking at the MAs.
Daily TF also giving us first signs of correction starting but it's just the first steps which means it might not be ready yet for any bigger continuation lower and at the same time have the Supply in Value and above to possibly go down and fill the buying in around VAL and Under.
Of course IF stronger volume comes in and we see strong acceptance under VAL and are able to push inside or through the lower Edge then that could bring in a bigger change for more downside into lower HTF Range/our Previous Distribution Balance low and lower Value so will be something to keep in mind and watch for.
If we can't stay above 840s - 50s to stay over the Mean of this Value and stay in this 880 - 40 Intraday Range then we will look for pushes into VAL and under, at and under VAL we have to be careful as there could be enough buying/covering to keep us away from the Edge but at the same time not give us big bounces as we have seen before, instead we could distribute around this 840 - 800s area. After failing at the upper Edge with Supply above, lower Edge and even push under it could be a good target/move to see this week but I am just trying to stay away from getting too biased to not push for it but its something to keep in mind.
For us to think higher prices from here again we would need to either hold above 840s and get back over 50 - 60s to stay in 880 - 40s Intraday Range and see pushes towards VAH or consolidate around VAL without accepting under and then push back over Value Mean.
And if buying and selling on both sides of Value is still strong enough then we could continue holding and going back and forth between VAH/VAL.
Overall looking at HTFs it seems like we are ready for a bigger back fill to finally happen in the market but it might take time to play out, if there will be interest I can post a Daily TF Chart which shows the range we broke out of is 5750s - 5400s, a back fill to break out area and IF we get back inside then move towards Mid/lows and under of that range can be in play but again that's HTF Outlook that can take a LONG time to fully play out not for intraday or shorter term swing trading.

2 Confirmations last week just as we planned, What's next? SPY PRICE HAS BEEN MOVING IN OUR FAVOR ! CHECK MY LAST WEEK ANALISIS,
Before we get to the analysis i just want to say...
So far, the price has moved in our favor. If you check the results of previous analyses, you’ll see that the price has moved exactly according to my analysis of price action, supported by institutional trading concepts.
Each green check mark represents a prediction that was correctly fulfilled according to the analysis from one week ago. My analyses are weekly, carefully prepared every weekend, but note: the study of price movement and the forecasted direction here, is based on my experience as a trader.
I DON’T KNOW WHERE THE PRICE IS HEADING!
IN FACT, NO ONE DOES!
Every price movement and behavior is based on a historical movement of institutional supply and demand. Based on the years I’ve spent studying this concept, I can predict the next price movements. However, it’s crucial to emphasize that trading is ultimately speculation, but if you have really good fundamental study in price action & structure, your margin of error will always be minimal.
So This analysis is for you but at the same time for entertainment purposes do not take trades because I'm greedy on any active, please do your own research first and you will have tyour final decision.
BACK TO SPY...
The price indeed broke out of the channel after we saw it crawling like a worm along the channel support.
Indeed, the price began to range after the channel breakout.
Looking at the overall structure, the price has been losing strength and volume since last week. I have a feeling we won’t see all-time highs soon, as it’s time for the price to start accumulating or simply making its natural pullback.
I'm expecting the next move to either be a pullback that touches my "order block" zone and then starts gaining momentum to recover all that decline, or, in another scenario, if we see enough volume on Monday, it could start fluctuating in a range to accumulate before touching new all-time highs.
BUT!
The price could reach highs while forming its accumulation range. However, what we’re looking for is a decision from the price to break out of the range and reach new highs along with a new extreme!
So be patient; this week will be very interesting to analyze in terms of price behavior.
Thank you for supporting my analysis.
TRADE SAFE!
Best regards

SPY BULLISH CONTINUATION AHEAD|LONG|
✅SPY is trading in a
Strong uptrend and the etf
Is now making a local bearish
Correction towards the support
Of 574.40$ from where we will
Be expecting a bullish rebound
And a move up
LONG🚀
✅Like and subscribe to never miss a new idea!✅

ES_F Day Trading Prep Week 10.20 - 10.25Last Week :
Last week Globex opened and held over Value, for any weakness from there we needed to either get back under Value middle or tag VAH and come back in, instead we pushed up into VAH before the RTH which brought in more buying and gave us a push to test the upper Edge of this HTF Range we have accepted in. As mentioned Monday first tags of big HTF areas like that more often than not give a reaction into opposite direction, which we got the following day with a flush back into Value but that supply was bought up and we again pushed outside of Value. Last two days of the week we ended up balancing between VAH and Edge keeping the price inside the new HTF Range with a close right under the Edge, under Monday and Thursday Highs.
This Week :
This week I am leaning towards us staying within the current HTF Range as we again don't have much of market moving data coming. Something to look for is if we still have strong enough buying in/over Value then we could continue balancing around this current Intraday Range of 930s - 880s BUT we do have a week of Supply built up here and we are right at the Edge of the HTF Range which tells me that unless we can build up inside the Edge then push over and continue to VAL above or hold the Edge on pull backs after taking it then I wont be looking for much higher prices from here but instead for a possible return back to VAH and possibly a move back inside Value into 880s - 40s Intraday Range, with supply above we could see a return back to 870 - 50s and even pushes towards 40s and VAL.
If we do make moves towards VAL we need to be careful with looking for too much continuation under 50 - 40s unless we can take out VAL and show clear acceptance under it, until then we can spend time balancing around this current Value thats if we get back inside of course which would mean for pushes out of VAH and VAL would find their way back inside eventually.
We could continue to grind higher here to start the week and attempt to push inside the Edge to try and build up there but as mentioned careful looking for continuation unless we get through the Edge top and don't come back in.

BTC DAILY BREAKING OUT??After 7.5 months of what what amounts to a HTF bullflag pattern, seemingly endless chop, bitcoin looks like it's finally breaking out above and continuing the Bullrun.
This post doesn't need to be overly complicated, there are a few key factors on what is happening:
- Bullish continuation, a bull flag pattern is just that, after a strong rally the corrective structure looks exactly like how the chart looks before continuing the next stage of the rally. Bitcoin has hit the red zone 9 times before the current breakout move, now that the daily structure has shown repetitive higher highs and higher lows for the first time it's signalled that Bitcoin is ready to continue the move higher.
- US elections, every election year since 1928 traditional markets experience a rally, this year is no exception with the $S&P500, SKILLING:US100 & TVC:DJI all at ALL TIME HIGHS. As much as we crypto traders want crypto to be separate from Tradfi, reality is these markets matter and effect Bitcoin directly.
'21 ATH has been major resistance all year for bitcoin, I could see that being the target for this breakout (should it be a successful breakout) before a retest of trend channel at $66,500 on the daily.
All in all this is an exciting time in crypto, lots of volatility ahead come US election and beyond.
Good luck everyone!

#ES_F Day Trading Prep Week 10.13 - 10.18Last Week :
Interesting week we had as many different things happened and it was fun to watch.
Last week Globex opened and made a return back into distribution balance, RTH flushed the inventory back into VAL but we again were able to hold VAL into the close and Tuesday Globex rotated back inside balance which brought buying and gave us another failed attempt out of balance top but market was able to hold over the 80s and supply which brought in more buying and triggered a short covering stop run into next Value which held and gave some continuation to close the week.
This Week :
Friday market attempted a push for VAH into 5840 - 80s Intraday range. We were able to hold around the mean of the of the range into the close but we can see it ended with a Poor high and Weakness into into 50s.
IF we are to accept in this new range then we would see price holding over 840s, over Value if that will be the case then we could continue trading in this range over VAL and start building up for an attempt at VAH test.
BUT we have to be careful as mentioned last week and week before that previous distribution range was a very interesting area and with current PA we might not be fully done with it, of course we will have to see what the market will actually do. Which means if we don't accept inside/over Value then this push could find its way back under 40s into VAL, IF we will be holding under 30s with Supply above that could trigger more weakness to get us back towards the Edge and eventually if we will have the supply find a way back into Previous Balance.
Something to note this week is Volume has been low, we don't have any market moving news until Thursday so need to be careful for more a slow leak back in instead of a quick return if it is to happen, holding over 830s would or 860s would change the weakness.

YEP! ALL-TIME HIGHS BABY! You're welcome! :)
Pretty simple... After identifying a candle with buying pressure, last week I announced that we would very likely be hitting new all-time highs simply by following the N# pattern that was unfolding at that very moment with precision.
VALIDATIONS ARE THE KEY TO PREDICTING A MARKET MOVE.
But what do I mean?
Here’s a recap of the moves I got in 1 week:
#1 It gave me a breakout.
#2 It gave me an exact retracement to my order block area that I was looking for.
#3 It gave me the volume I needed to see.
#4 It gave me a volume candle with buying pressure.
#5 It gave me an immediate bullish structure.
#6 The "N3" pattern is being fulfilled precisely.
How many validations do I have so far?
6 Validations!!!! Don’t you think we’re in a bullish scenario where, with all these validations being met exactly, we could see a new extreme, breaking new all-time highs?
OF COURSE WE ARE!
The more validations you have in an analysis, the more likely the scenario you’re looking for will be fulfilled correctly.
Now... Going back to SPY, all-time highs are uncharted territory! We must be very cautious, and as soon as the retracement begins, I’ll start my analysis again.
Best regards, and I hope this mini-lesson helps fine-tune your price analysis process.
Thanks for supporting my analysis.
Best regards.

Combined US Equities Breakout late OctoberVery quickly, the expected breakdown did not happen, and this week saw the an across the board bullish breakout. Noted the breakout is long in the teeth (old and late) and while bullish, it is not strong nor convincingly sustainable. Reminiscent of this expectation is the MACD and VolDiv looking lackluster.
Expected top marked, and after 21 Oct needs a review... that would be the projected resistance for a stronger pullback.
Bullish for now and the week ahead.
Enjoy, make hay while the sun shines!

#ES_F Day Trading Prep Week 10.06 - 10.11Last Week :
Sunday Globex held the Edge after open which gave us an attempt at above VAL into Mondays RTH Close. We pushed above the distribution balance, consolidated under next ranges VAL and sold back to Balance low. We spent the whole week filling out that area under the Edge with sells into VAH but we never got clear acceptance under 730s which is what was needed for any more downside from there, instead we would look under distribution balance low and come back towards the middle. After getting no continuation lower we got short covering on Friday before the weekend which drove prices back to balance top with a close over the Edge.
This Week :
Close over the Edge could be seen as strength and could bring in more buyers if we hold over it or at least over 780s, but we have to be careful over 800s because until we accept over VAL and start transacting inside next ranges Value then price may want to keep coming back inside and under the Edge of current HTF Range which is 5772 - 5650+/-.
If we do get a push above but again fail to hold/get over VAL then we would look for a return back into the Edge and from there possible sells into the Supply towards balance low/VAH.
IF we do return back into/under the Edge and will have enough supply built up which may take some time this week to built up we could attempt a push into lower Value and that's an IF as we may have another sort of inside week inside the distribution balance.
For strength to come in and start thinking of higher prices from 800s we would need to start holding over the Edge and start transacting over VAL over 830s until then we can stay around distribution balance building Supply to bring back inside lower Value cost basis to fill the buyers there, may still need time to build up for that.
Until then balance.

Predictive Correlation the SG10Y Bond Yields on S&P500I have posted about this correlation previously. Perhaps this time it might be clearer to see...
This uncanny correlation between the SG10Y Govt Bond Yields as a leading indicator for the S&P500 was noticed some time ago, and tested since.
As shown, the major turning points were seen in trend changes of the SG10Y GBonds first, before the S&P500 reacted. The vertical time markings show when you would short or long depending on the trend breakouts of the SG10Y GBonds (see lower panel, blue line),
Comcomitantly, comparing what happens from that point, you can see the S&P500 in the upper panel with yellow line.
The lowest panel is the MACD... and this shows the correlated pattern of a (lagging) technical indicator.
Since 2023, there are at least six instances with 100% hit rate.
Now... that brings us to TODAY.
It appears that we are given advance warning of the next couple of months.
For now, there should be a quick pop up to the very recent high followed by a failure of support in the S&P500; and then the expected trends should play out...

Combined US Index - Bullish flip overdone. Retracement now... As previously marked out, the bullish flip was done, and is pretty overdone. Yesterday's close sealed it for a retracement, and technicals (MACD and VolDiv) support that view.
should be seeing a downdraft to the last low visit (yellow ellipse).
Possible stall at blue ellipse, but look for further breakdown.
Exceeding the last low to close below is Bearish.
Let us see...
