SPY - On Our Way To Target 3 ...But First?Trading Fam,
It's been a while since I updated you all on the SPY, which, as you know, we track closely to help us determine the overall market trend. Since we have now exceeded my Target #2, it's time for me to give you all another update. But first, a little context for my new readers which I have been getting a lot of recently, thanks to my new indicator hitting it out of the park.
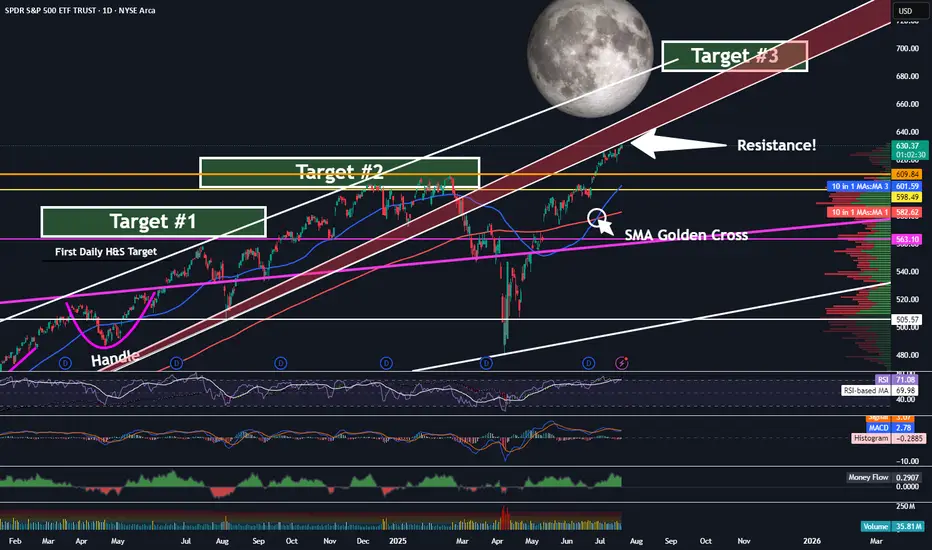
So, we began marking targets on our chart here after spotting an inverse H&S on the daily chart a few years ago. Many of my followers back then were doubtful the pattern would fully form, or if it did, that it would actually play out. But the pattern completed about 14 months ago and subsequently broke the neckline in June of last year. I then knew we were going full send and have been predicting a 700 SPY final target since. This target has been made utilizing both that inverse H&S pattern as well as a longer-trend Elliot Wave, which I don't have denoted here at this point. The chart gets too messy with all of my markings. Regardless, we are currently in wave 5 and heading steadily towards that 670-700 target #3, my final target.
But be careful! Today, we have hit the underside of that RED area, which is HUGE resistance. I would expect that we will NOT break straight through this without some pullback prior. Indeed, the market is overextended at this moment, and we'll need the volume to be able to push through. Could this occur? Of course, anything is possible. But, it is not likely right now.
My guess is that we'll at least pull back to one of those levels below us or possibly even re-touch that 200 SMA in red before the final push.
Anyways, it is worth taking note of what may be ahead of us in the next few weeks or months so that you can plan your trades accordingly. Stay with me. We're almost there.
✌️Stew
Snp500short
SPY Has Finally Now Neared Its Final Target Of 570!Traders,
It feels as though I have been discussing a SPY top at around 570 for years now and I can see from the history of my posts that this is actually true.
I first started with the premise that the U.S. stock market would experience a blow-off top of sorts. Elliot-Wave theory and technicals seemed to support this idea. Though admittedly, I am nowhere near an expert in this area, I went with it, following the technical guidance of those who were.
It was not too long thereafter I spotted something on the charts that I was very familiar with. This pattern supported and confirmed the idea that stocks would blow-off. What I spotted was a longer-term (2 year) inverse head and shoulders pattern. This inverse h&s played out and gave me my target of 570.
2 years later, we are finally almost there.
Targets are not meant to be absolutely precise. Close enough is both good enough in hand grenades, horseshoes, and in calling market tops/bottoms. Therefore, not wanting to press my luck, I have decided to finally start taking some profit and moving to cash. Though, my target definitely could be exceeded, it is also possible that it may not be reached. I don't think the latter will be the case but I have been wrong before and could be wrong again. If I had to guess rn, I'd say this blow-off top could extend to a time frame just before election shenanigans begin. We are already seeing some of the nonsense here in the U.S. and thus, I know time is running thin. Before all hell breaks loose, SPY could touch 650.
And then? Anyone's guess.
Best,
Stew

Simple multitimeframe for US500, S&P 500 Index☝️Do not act based on my analysis, do your own research!!
The main purpose of my resources is free, actionable education for anyone who wants to learn trading and improve mental and technical trading skills. Learn from hundreds of videos and the real story of a particular trader, with all the mistakes and pain on the way to consistency. I'm always glad to discuss and answer questions. 🙌
☝️ALL ideas and videos here are for sharing my experience purposes only, not financial advice, NOT A SIGNAL. YOUR TRADES ARE YOUR COMPLETE RESPONSIBILITY. Everything here should be treated as a simulated, educational environment. Important disclaimer - this idea is just a possibility and my extremely subjective opinion. Do not act based on my analysis, do your own research!!

SPY Right On TrackAs stated in this weekends video update, I expected us to retest the top of the red channel first, with potential to drop back inside the channel and test the bottom. The middle yellow channel is also a less likely possibility. I don't think we'll get down to the green again until AFTER we hit are WAVE 5 target and also, Inverse Head and Shoulders pattern target of 570. This should be hit sometime on or just before September of 2024. ...Then the crash.

Short idea on $SNP500This bullish trend has been going on for more than 80 years, during wars the economy grows against the background of money printing and aggressive infusions. I do not believe that the economy can grow honestly against the background of the global crisis. Only linden growth, which will end very, very not fun. Of course, these are just my thoughts and I could be wrong, but this situation requires hedging (shorts)

SPY 410 Target Now ConfirmedTraders,
A couple of weeks ago you'll remember I expected a bounce off of our 200 day SMA which coincides with the bottom of my channel, making a strong area of confluence and support. But I wasn't sure if that was the end of our drop? Turns out, after testing the underside of our neckline for a patent classic retest, we have now broken below the 200 day SMA and channel. Tomorrow will provide confirmation. As of now, I will say that our $410 target down is certainly in play. And look how it coincides with the RSI! We should hit 410 right about the time the RSI is also finding its support on our long-trending touch and go.
Best,
Stew

ES 4HR Bear FlagIt's hard to pick a direction lately, but this 4 hour bear flag into prior support just screams bearish. Will it be a trap though?

S&P500 RISK-OFF Q2Looking for a turtle soup of the February highs before we drop aggressively.
The rest of Q2 seems like a risk-off situation for me for stocks.
Like always do your own due diligence.
DISCLAIMER: I am not a financial advisor and nor is this financial advice.

So now back down to the 200 day?Traders,
We have now touched the underside of our macro uptrend (3) three times and the bulls have been unable to break to the topside again. Is is time for them to sit the bench for a few weeks, get their wind back, and let the bears take us back down to retest that 200 day one more time? It might be.
Stew

HI EVERYONE!Cobra here!
Friday's report was quite neutral. The markets did not react much, but they closed with a fall. Let's take a brief look at the current situation:
The index is getting closer to its old GAP, which I wrote about a long time ago and said that it would be closed last. If there will be no additional bad news on the market, the gap will be closed, and then it can continue further downtrend. On Friday the dollar index DXY gave a good candle up, before the markets closed.
You can read next posts about crypto!

Snp500 short 10 x rrAnticipating one more push up on Monday and close down for the week next week. Great risk reward after volume imbalance taken on Daily on the back of short covering end of week.

QML SetupEntry Short: 4034
SL: 4046.1
TP: 3766.5
RR: 1:22
QML Invalid if price break through 4101 mark
4034 price its right on 0.618 fibo and major SSR
it may fill the gap on 15min TF to 3766.5 before pushing up again

Get ready. The end of this correction is near, a key moment.Analysis of the spx 500 index 11/21/22 Today we are here to talk about the SPX 500 index.
And so let's see what happened to the index over the past day.
What's on the market now:
Today the index is trading at 3949. Yesterday, as I expected, we saw an attempt to increase the index at the market opening, i mentioned earlier. However, there were few volumes on the market and they were enough to maintain and stabilize the index. Thus, yesterday’s attempt to grow was not realized.
And so today the market will have another chance for the growth of the index. However, today in the morning the situation on the market is different than yesterday. Many market participants saw the weakness of the market and the hesitation of buyers. This will be a signal to experienced players to reduce their positions if the index fails to grow. This will cause the index to drop sharply.
What today:
Today at the opening of the market, rates are rising, the market is expected to be likely to move sharply. The index will have one last attempt to rise to the level of 4110-4150. However, if this attempt is broken, then we will see a sharp drop in the index to the level of 3860 and below.
What I recommend
If you want to go short:
Short positions are possible with a sharp move down. You can go short if the market goes down sharply, but limit your losses.
If you want to go long:
Long positions are possible with a sharp move up. You can go long if the market goes up sharply, but limit your losses.
If you are out of the market:
If you're out of the market. Then you need the perfect price to trade. Long positions are possible from 3860, limit your losses. If you want to open a short position, then it is better to do it from the level of 4110, 4250. Limit your losses.
Also remember to contact me in 2 or 3 days for further trading advice.
Subscribe to my channel and you will always be aware of the movement of the S&P 500 index .
Press Boost if you agree with the current market situation.
Thank you!
Bye!

S&P 500: At the edge… Prepare for sudden movements.Analysis of the spx 500 index 11/08/22 Today we are here to talk about the SPX 500 index.
And so let's see what happened to the index over the past day.
What's on the market now:
Today the index is trading at the level of 3806. Yesterday, as I expected, the index kept its movement to the zone 3820-3045, I wrote about this earlier. However, at the moment, a situation has formed on the market in which the market may fall sharply to the level of 3440. Today, a lot will depend on the results of the US elections, but at the moment there is a lot of free money on the market that can be thrown into the market, and this could happen today. Which is likely to cause the market to ideally crash to 3440 and below.
What I'm looking forward to today:
Today at the opening, I expect the index to try to rise to the level of 3820-3845. However, if there are large volumes on the market, then there is a possibility of a sharp movement of the market to the level 3440, so long positions are prohibited.
Here are my trading recommendations for today.
What I recommend
If you want to go short:
Short positions are possible from the 3820-3845 level, try to sell on the market reversal but limit your losses.
If you want to go long:
Long positions are prohibited, limit your losses.
If you are out of the market:
Long positions are prohibited, limit your losses. If you want to open a short position, then it is better to do it from the level of 3810-3845, limit your losses. But if you see anomalous behavior in the market, like a sharp rise, then it is better to stand aside, although the potential for growth to the level of 3970-4050 remains, but at the moment such an event is unlikely.
Also remember to contact me in 2 or 3 days for further trading advice.
Subscribe to my channel and you will always be aware of the movement of the S&P 500 index . Press your thumbs up. This will give me more motivation.
See you next time!
Bye!
Also remember to contact me in 2 or 3 days for further trading advice.
Subscribe to my and you will always be aware of the movement of the S&P 500 index. Press your thumbs up. This will give me more motivation.
See you nLong positions are possible from the level of 3750, but it is risky. If you want to open a short position, then it is better to do it from the level of 3970, limit your losses.
ext time!
Bye!

S&P 500 E-mini Futures, Short StrategyHere's a possible short strategy based on S&P 500 E-mini Futures daily chart.
Based on previous price movements I would enter a short position. Await first for confirmation, then enter a position. Keep your stop loss somewhere above the upper channel.
Target 1 - $3690
Target 2 - $3590
Target 3 - $3500
------------------
I keep it simple and clean!
Likes, comments, and follows are dearly appreciated.
Let me know what you think and which ones you would like me to analyze next.
Trade safely!
------------------

The market is ready to turn, will it?Analysis of the spx 500 index 10/27/22 Today we are here to talk about the SPX 500 index.
And so let's see what happened to the index over the past day.
What's on the market now:
Today the index is trading at 3830. Yesterday we saw a stabilization in motion and a decline in the market, as I mentioned earlier idea link below. In the near future, I expect an attempt to develop a correction. Today I expect that the market will continue to develop a correction and reach its bottom at 3780-3750. However, if this attempt is broken, then the market will continue its growth, where you need to look for places to open short positions from the level of 3970.
What I'm looking forward to today:
Today, I continue to expect the beginning of a correction and an attempt by the market to go down to the level of 3750. However, the market also has the possibility of a sharp fall in the index, so long positions are prohibited.
Here are my trading recommendations for today.
What I recommend
If you want to go short:
Short positions are possible from 3950 which would be a perfect place to sell this week, limit your losses.
If you want to go long:
Long positions are prohibited, limit your losses.
If you are out of the market:
Long positions are possible from the level of 3750, but it is risky. If you want to open a short position, then it is better to do it from the level of 3970, limit your losses.
Also remember to contact me in 2 or 3 days for further trading advice.
Subscribe to my channel and you will always be aware of the movement of the S&P 500 index. Press your thumbs up. This will give me more motivation.
See you next time!
Bye!

Actual levels for opening short positions 3860-3950.Analysis of the spx 500 index 10/25/22 Today we are here to talk about the SPX 500 index.
And so let's see what happened to the index over the past day.
What's on the market now:
Today the index is trading at the level of 3797. Over the past trading day, we saw an increase in the index, without any attempt at correction. Today I expect the market to peak at 3860, where the correction will begin. If a slight correction starts today, then its bottom can be expected at the level of 3730. However, if this attempt is broken, then the market will continue its growth. Where you need to look for places to open short positions from the level 3860.
What I'm looking forward to today:
At the open today, I expect the market to try to drop again to the 3743 - 3715 level. However, if this attempt is broken, then the market will continue its growth to the 3860 level.
Here are my trading recommendations for today.
What I recommend
If you want to go short:
Short positions are possible from level 1 - 3860, level 2 - 3950 this would be an ideal place to sell this week, limit your losses.
If you want to go long:
Long positions are possible from the level of 3652.
If you are out of the market:
Long positions are possible from the level of 3652. Limit your losses. If you want to open a short position, it is better to do it from the level of 3860-3975, limit your losses.
Also remember to contact me in 2 or 3 days for further trading advice.
Subscribe to me and you will always be aware of the movement of the spx 500 index.
If you'd like to help me promote my content, please hit the boost.
See you next time!
bye!

Market going down? What do you thinkDISCLAIMER: I DO NOT GIVE SOLICITATION TO BUY OR SHORT
Seems like market is continue its down trend based on pattern. What do you think ? OCTOBER 21 , 2022
I cover various stocks which can be profitable based on the stock charts and technical indicators. I try my best to explain as detailed as possible but your feedback is also appreciated
Before you enter a trade , one must learn how to master the charts as Stock charts play a big role in deciding when to buy or when not to buy. Technical Trading help in predicting price movements and have a risk management. Stock trading is like any other business and must be taken seriously. Lot of people lose money because they don't educate themselves and end up placing trades blindly which results in big losses
Stock charts is the major component day traders, swing traders, core traders use. Times and technology has changed and if you cannot adapt to the new methods , there is a high chance you will be left behind
Millions of shares are traded now using desktop , laptop or gadgets and stock charts is what majority of traders look at.
So , if you want to be a daytrader , swingtrader or coretrader learn how to read and interpret charts. There are lot of great books out there like Thomas Bulkowski's Encyclopedia of chart patterns and Steve Nison Japanese Candlesticks interpretation
Having someone experienced can also cut the learning curve time for a new trader. Trading does take time and with discipline , hardwork , dedication and most importantly Passion for this needs to be there.

3605 a small but important level before the rise to 3840.Analysis of the spx 500 index 10/20/22 Today we are here to talk about the SPX 500 index.
And so let's see what happened to the index over the past day.
What's on the market now:
Today the index is trading at 3695. And over the past trading day, we saw a slight decrease in the index, but there was no sharp drop, the market continues to be in the support zone. Today the market has every chance to fall to the level of 3605. However, if this attempt is broken, the market will fall to the level of 3200. Thus, globally, nothing changes.
What I'm looking forward to today:
Today at the open, I expect the market to try again to drop to the level of 3605-3670. But there is also a high probability of a sharp fall to the level of 3200 on the market. Therefore, long positions are prohibited.
Here are my trading recommendations for today 10.20.22
What I recommend:
If you want to go short:
Short positions are possible from the 3840-3815 level, this will be the ideal place to sell this week, limit your losses.
If you want to buy:
Long positions are prohibited.
If you are not in the market:
Long positions are possible from the level of 3605 - 3570. If you want to open a short position, it is better to do it from the level of 3840 - 3815, limit your losses.
Also remember to contact me in 2 or 3 days for further trading advice.
Subscribe to me and you will always be aware of the movement of the S&P 500 index. If you want to help me promote my content, then press your thumbs up. This will give me more motivation and help promote the content.
See you next time!
Bye!

SNP500 Short SetupLooking at a short setup on the SNP500 based on the OB and higher timeframe trend continuation as well as a FVG fill and BOS to the downside and resting liquidity below the entry.

SNP Bears AttackSNP500 Bulls will need to defend 3521.
If price action starts consolidating below 3521, then we could get a lower degree pullback and breakout for the next motive wave down.

US500 IS DIVING DEEPER INTO BEAR MARKETAfter policymakers have shown more appetite for interest rate hikes, S&P500 recorded its lowest close in almost two years and it is 24% down from its record high.
The technical indicators on 1H graph are also putting the index into bear territory, with MACD histogram below 0 and keeps decreasing and RSI well below 50 neutral line.
If the downtrend continues, the index might reach and test levels of around 3530 USD. If opposite scenario occurs, the price might test its previous high at 3800 USD.
Risk Disclosure: Trading Foreign Exchange (Forex) and Contracts of Difference (CFD's) carries a high level of risk. By registering and signing up, any client affirms their understanding of their own personal accountability for all transactions performed within their account and recognizes the risks associated with trading on such markets and on such sites. Furthermore, one understands that the company carries zero influence over transactions, markets, and trading signals, therefore, cannot be held liable nor guarantee any profits or losses.

SNP 500SNP 500
looks like going to start real fall. ready to real turbulence.
Good Luck
Chart is for 10 days.
