SNXUSDSNXUSD
Positive but slow trend
If the RSI guard breaks upwards
There is a possibility of price increase up to the price range of $ 70
SNX

$SNX/USDT 1h (Binance Fut.) Symmetrical triangle break & retestSynthetix Network looks ready for bullish continuation after that last pull-back!
Current Price= 21.346
Buy Entry = 20.949 - 20.949
Take Profit= 22.077 | 23.081 | 24.146
Stop Loss= 19.873
Risk/Reward= 1:1.5 | 1:2.63 | 1:3.84
Expected Profit= +25.44% | +44.80% | +65.32%
Possible Loss= -17.00%
Fib. Retracement= 0.786 | 1.272 | 1.764
Margin Leverage= 4x
Estimated Gain-time= 1 week

SNX long position potentialLooking for various indicators in confluence to solidify confidence in SNX long term.
Stop loss 18-19 dollars
Target: set up various targets on the way up 25/30/40
Loading: ladder your position in slowly.. it's a long position and dependent on etherium movement
Please ask any questions.

SNX to the MOON !Stop loss under the support.
Please like the idea for Support & Subscribe for More ideas like this and share your ideas and charts in Comments Section..!!
Thanks for Your Love & Support..!!

SNX to go for a solid run to $37-$38 levels during AltseasonWith a cup and handle formation and a triangle breakout on SNX we could see a run to $38 this altseason based on the fib retracement.

SNX (Y21.P2.E1).Stalking a breakout tradeHi Traders,
Hopefully you see this in time.
Gartley Harmonics
Cheers,
S.Sari


SNX/USD: BULLISH SET UPSNX (Synthetix Network) Binance Chart
Ichimoku : The lagging span was blocked by the candle. Price still below the cloud so trend still bearish.
However
Kijun and Tenkan as support
And
Trend line : was broken which shows some signs of reversal. Price now retesting the trend line, could bounce and start an uptrend.
Targets: Fibo extensions on the chart
How to play it?
You could enter now with a stop loss just below the trend line (about 18.40) OR wait for the price to be back above the cloud and the lagging span to break the trend line. With the 2nd option you'll miss a part of the move but the change of trend will be confirmed.
Trade safe

SNX - Potential breakout this month, very bullishThis is not Financial advice, please do your own research.

SNX/USDT BreakoutSynthetix (SNX) - Daily Log Chart
A Protocol For Trading Synthetic Assets On Ethereum.
Synthetix is an Ethereum-based protocol for issuing and trading synthetic assets, including cryptocurrencies, leveraged tokens, equities, and other real-world assets.
We are not registered or licensed in any jurisdiction whatsoever to provide investing advice or anything of an advisory or consultancy nature.
and are therefore are unqualified to give investment recommendations.
Always do your own research and consult with a licensed investment professional before investing.
This communication is never to be used as the basis of making investment decisions, and it is for entertainment purposes only.

SYNTHETIX AND DEFI 2.0SNX is another DeFi protocol with serious upside.
Just broke out if its bearish slump, and is due for a solid run.
I'm long !

SNX bullish pattern and targetsSNX has a big triangle and was in a correction for a long enough time. I consider two targets for it showed by orange short-lines. Stop-loss for the short target is marked and for the next target, we could use the bellow green line as a stop-loss point.

SNX just triggered for a solid bounce play off the lower rangeSNXUSDT just triggered for a possible good risk conscious trade off the lower range. With crypto on whole in a massive bull market bounces off the lower range have been super high probability trades with large returns really quickly. A potential trade could be a buy here with a target up into the 19.50 range. We are trading this long in our live account.


More AccumulationAfter falling from the ascending channel at the end of Feb, I thought it would climb back up into the channel on Mar09, indicated by the 2 blue arrows, but alas, like my ADA plan, this is going equally splendidly.
In a sideways “accumulating” movement (translate, don’t sell at a loss), it has formed a bullish descending flag. Looking at the MacD day timeframe, it looks like a continued “accumulation” till a breakout and a positive green day MacD.
My thoughts, not advice Oklah. Cheers

Bet on Synthetix against BTCTrying to outperform the main Crypto during the bull run is very risky. Unless it is with another Cryptocurrency with solid fundamentals near huge demand zone.

SNX Down ChannelSNX 4Hr chart can be seen to have formed a down channel
multiple touches on bottom and top of channel


SNX (Synthetix) Token Analysis 24/03/2021 Updatedas we can see the price has fallen to the trend line and has some good chances of getting bounced from the Retracement and support zones
targets are the same as the past analysis

SNXUSDT (SYNTHETIX NETWORK TOKEN) - POTENTIAL BREAKOUT ANALYSIS 🔎
- SNXUSDT brokeout above the double bottom (DB) neckline resistance (NR).
- The market hit an ATH and retraced.
- Price retested the key fibonacci retracement zones (0.5 - 0.618 - 0.786).
- A daily timeframe bullish pin bar (BPB) was formed at the retest area.
- Price action is printing a pennant pattern (PP).
- A pennant pattern is a trend continuation pattern.
- A bullish trend continuation pattern in this case.
- There's a breakout potential.
BUY ENTRY ⬆️
- Breakout above the pennant pattern's (PP) inclined resistance.
TARGETS 🎯
- Horizontal resistance level (R1).
- Horizontal resistance level (R2).
- Fibonacci extension levels.
SETUP INVALIDATION ❌
- Breakdown below the pennant pattern's (PP) inclined support.

SNX trade ideaSNX has been quiet lately in comparison to other alts, despite being a great crypto project. This is my current trade for SNX, I think the risk/reward is great here.

SNX Long Head and shoulders has finished its bearish move. If we see price stay above $18 we should see a continuation of the bull run.
- falling wedge breakout and potential retest of trendline/support level

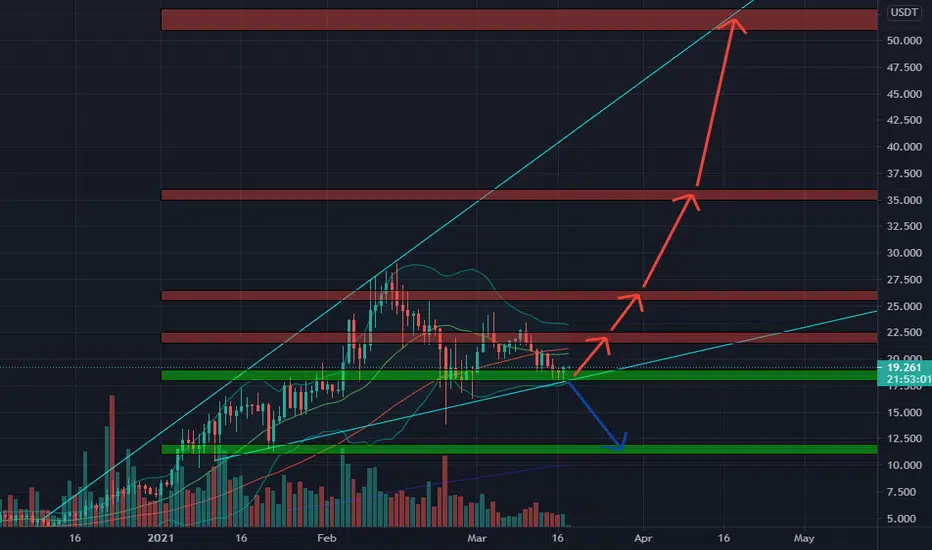
🆓Synthetix Network/USDT Analysis (18/3) #SNX $SNXThe buying force has appeared at the 18-19$ zone and this may make a new rally on SNX up to 52$ zone.
SNX is really promising to be invested.
📈BUY
-Buy: 18-19$. SL if B
-Buy: 21.5-22.5$ if A. SL if B
-Buy: 25.5-26.5$ if A. SL if B
📉SELL
-Sell: 21.5-22.5$. SL if A
-Sell: 25.5-26.5$. SL if A
-Sell: 35-36$. SL if A
-Sell: 51-53$. SL if A
♻️BACK-UP
-Sell: 18-19$ if B. SL if A
-Buy: 11-12$. SL if B
❓Details
Condition A : "If 1D candle closes ABOVE this zone"
Condition B : "If 1D candle closes BELOW this zone"