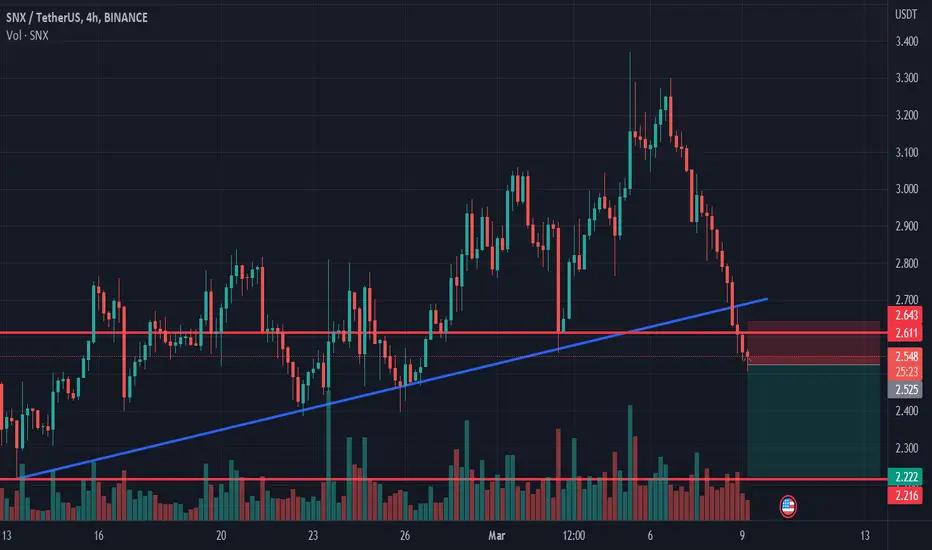
snx long 🪐snx
🟢long
💲max capital 2%
🛑max lev 20
🟩enter 1 : 2.569
🟥stop : 2.483
✈️tp
✈️2.655
✈️2.741
✈️2.827
✈️2.913
✈️2.999
✈️3.055
SNX

Fxs Looks Promising Seems Like getting ready To Continue Moves To The upside
Forming descending Channel Incase Of breakout expecting another 70 to 80% bullish move Keep Eyes On for breakout


Synthetix longSynthetix broke trough the descending trendline. Asset broke trough the resistance level. Bullish movement to resistance level at 3.2 is expected to happen.

DeFi summer is coming with SNX. Volume spikes, fees spikes, price will follow. All the tokens already unlocked... No pressure from private/seed investors.


long SNX$SNX bounced off the support level. Bullish movement to resistance level at 3.32$ is likely to happen

SNX CAN MAKE A CORRECTIONHi, dear traders. how are you ? Today we have a viewpoint to SELL/SHORT the SNX symbol.
For risk management, please don't forget stop loss and capital management
When we reach the first target, save some profit and then change the stop to entry
Comment if you have any questions
Thank You

#Synthetix in a Bull Flag after a 45% SurgePast Performance of Synthetix
Synthetix prices are firm, adding roughly 45% from last week's lows. Though prices are inside a bull flag, buyers are determined to press on. In the short term, resistance remains at around $3.3. Any surge above this reaction line may see the token break higher, printing new 2023 highs in continuation of buying pressure from Q4 2022.
#Synthetix Technical Analysis
The bull bars of March 12 and 13 define the current uptrend. Buyers may be in control from the daily chart, but prices are bound within the two bullish engulfing bars. Though this is positive from an effort versus result perspective, there needs to be a strong push above the flag and $3.3 for a trend continuation. Therefore, considering the setup in the daily chart, aggressive traders may load the dips above the base of the flag at around $2.5 with targets at $3.3. Meanwhile, conservative traders can wait for a clean, high-volume break above Q1 2023 highs before ramping up with targets at $3.6 and $4.2. In this way, they will align with the dominant trend established in Q4 2022.
What to Expect from #SNX?
Traders are positive, but there must be a clear trend definition in the short term, above or below the current consolidation. Any upswing may draw demand, pushing SNX to new levels.
Resistance level to watch out for: $3.3
Support level to watch out for: $2.5
Disclaimer: Opinions expressed are not investment advice. Do your research.

Axs Looking Good For MidtermPreparing For Massive Bullish Moves
Forming Descending Channel incase Of Breakout Expecting 300 to 320% Bullish move

SNX price has growth prospects for at least x2-x3. Where to buy?Last week, buyers of SNX were very active and managed to organize a +70% increase.
This is a good result, but they still failed to break through the trend line that has been stretching since the beginning of 2021 and consolidating price above it.
(If you narrow the chart, you will see the entire trading history of SNXUSDT)
And although it was not possible to break above the trend line, this maneuver indicates that we need to monitor SNX more carefully.
If you asked us where it is safe to buy SNX in your medium or long-term investment portfolio, we would answer:
if the SNXUSDT price does not fall below $2.20 in the coming days/weeks, it is a strong long.
Or wait for SNX buyers to break through the upward trend line and gain a foothold above $3.15
The choice is yours)
_____________________
Did you like our analysis? Leave a comment, like, and follow to get more


Upward Trend Despite Recent VolatilitySynthetix Network Token (SNX) is a digital asset currently trading at $2,850 per token. Looking at the daily timeframe, the Relative Strength Index (RSI) is now at 54.5, indicating that the asset is not overbought or oversold. The volume oscillator is at 5.67%, which suggests that there has been moderate trading activity in the asset.
When considering the Fibonacci levels, the 0 Fibonacci level is at 2.219, the 0.5 Fibonacci level is at 2.660, and the 1 Fibonacci level is at 3.100. These levels indicate possible support and resistance levels for the asset. The daily timeframe upper Bollinger band is at 3.239, the middle Bollinger band is at 2.720, and the lower Bollinger band is at 2.200. These bands provide additional information on the asset's volatility and potential trading ranges.
Looking at the Moving Average Convergence Divergence (MACD), the value is 0.008, indicating a bullish signal. The Stochastic Oscillators are at 62.11, suggesting that the asset is trending upward.
The price of SNX has fallen by 10.80% in the past seven days. However, there has been a recent increase in price by 32.82% in the last 24 hours, and in the past hour alone, the price has grown by 2.00%. Notably, the current $2.86 per SNX is 90.07% below the all-time high of $28.77.
Based on the given information, SNX is in an upward trend. However, it is important to remember the possible resistance levels provided by the Fibonacci levels and Bollinger bands. Additionally, the asset's recent history of volatility and drastic price changes should be considered when considering investments in SNX.

SNXUSDT(Synthetix) Daily tf Range Updated till 13-03-23SNXUSDT(Synthetix) Daily timeframe range. the daily candle trying to stay above #2.764 which open a way till #3.531. a big part depend on market sentiment and how far btc retrace as we had a lots of negative news recently. it needs a little bit of more volume here.

SNX : INCREASE VIEWSNX is also one of the coins that will get a follow for the next 24H to see if it's able to confirm.

Synthetix shortSynthetix broke trough the ascending trendline. Asset broke trough the support level. Bearish movement to support level at 2.222 is possible.
SNXUSD head and shoulders pattern (NEW)SNXUSD is creating a head and shoulders pattern.
If it breaks down, we will see 30 % drop.
Target: 1,65 usd would be a potential higher low .
Entry: breakout of the neckline
Stop loss: 2,918

SNX (Y23.P1.Video1). Bullish signsHi Traders,
#crytpo #snx #syntheticNetwork
As I explain the macro and current price range, I see opportunities which I explain.
So we plan and if conditions are met, we execute.
Please give me a like and share,
Regard,
S.SAri

SnxUsdtsnx dar yek sagfe gemateh garar darad ba in hal emkan resedan be gemat 3.51$ momken ast albateh mogavemat 3.30$ shaded mohkam ast va ehtemal zyad ke dar in gemat rezesh ta tp1 = 2.80$ va tp2 = 2.60 $
::::::::: nazar shoma chee hast

SNX Short For now, I haven't entered the position yet.
but This coming soon
We just have to wait
unreasonable trading is very bad

long SNX$SNX broke through the resistance level. Bullish movement to the resistance level at 3.56$ is likely to happen.

✳️ Synthetix Bullish Continuation = Bullish Confirmation (80%+)Synthetix (SNXBTC) today confirms its bullish bias by producing a strong breakout above EMA300 and MA200.
Bullish continuation = bullish confirmation. 😉
It is now confirmed, once more, that the bulls own this market.
You can expect much more growth.
You can read the 'Related Ideas' below for the previous charts and also to find AGIXBTC which can help you determine how far up SNXBTC will go.
To know how far up the USDT pairs will go, check FETUSDT.
I hope that helps.
Namaste.

SNX's Expected bullish movement!So we have an Inverse Head and Shoulder Pattern for The SNX/USDT Pair which is a Good Thing for Bullish Guys! The Break out is about to happen and when it happens, the Price shall Increase as much as the measured Price movement.(AB=CD) a target is around 4.1$ and the other one is around 5.5$.It'd be a huge Profit!
_ _ _ _ _ _ _ _ _ _ _ _ _ _ _ _ _ _ _ _ _ _ _ _ _ _ _ _ _ _ _ _ _
🌍Thank you for seeing idea .
Have a nice day and Good luck
