SNXBTC


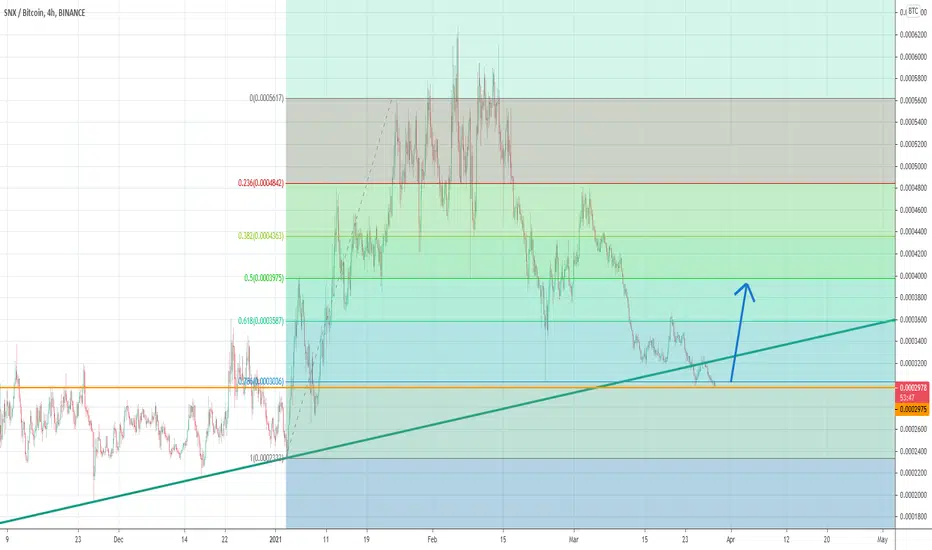
SNXBTC : 61.8% Fibonacci retracement SNXBTC on the weekly timeframe has formed a higher low which is indicative of a possible higher high. the higher low is confirmed by the formation of a bullish engulfing pattern on the 61.8 retracement level of the last move from 0.0002. I am expecting a sustained move upwards towards 0.0009 as that is the 1.618 Fibonacci extension point.

SNX Down ChannelSNX 4Hr chart can be seen to have formed a down channel
multiple touches on bottom and top of channel

Synthetix Network Token (SNX) - March 24Hello?
Dear traders, nice to meet you.
By "following" you can always get new information quickly.
Please also click "Like".
Have a good day.
-------------------------------------------------- -----
We have to see if we can get support and climb at 16.809.
As such, we need to see if there is any movement to move sideways at 16.809 or break off the downtrend line.
If you go down at 16.809, you can touch 13.222, so you need a Stop Loss to preserve profit or loss.
In order to turn to the uptrend line, it must rise to the 20.397-21.592 section and receive support.
As the OBV on the volume indicator increases green, it remains to be seen if the center line can rise.
It remains to be seen if the CCI line can rise above 100 on the CCI-RC indicator.
---------------------------------------
(SNXBTC 1D chart)
We need to see if it can rise along the uptrend line (1).
In particular, it remains to be seen if the volatility around March 26 could increase more than 3280 Satoshi.
In order to turn to an uptrend, you must get off the downtrend line.
-------------------------------------------------- -------------------------------------------
** All indicators are lagging indicators.
So, it's important to be aware that the indicator moves accordingly with the movement of price and volume.
Just for the sake of convenience, we are talking upside down for interpretation of the indicators.
** The wRSI_SR indicator is an indicator created by adding settings and options from the existing Stochastic RSI indicator.
Therefore, the interpretation is the same as the conventional stochastic RSI indicator. (K, D line -> R, S line)
** The OBV indicator was re-created by applying a formula to the DepthHouse Trading indicator, an indicator that oh92 disclosed. (Thank you for this.)
** Check support, resistance, and abbreviation points.
** Support or resistance is based on the closing price of the 1D chart.
** All explanations are for reference only and do not guarantee profit or loss on investment.
Explanation of abbreviations displayed on the chart
R: A point or section of resistance that requires a response to preserve profits
S-L: Stop Loss point or section
S: A point or segment that can be bought for profit generation as a support point or segment
(Short-term Stop Loss can be said to be a point where profits and losses can be preserved or additionally entered through installment transactions. It is a short-term investment perspective.)
GAP refers to the difference in prices that occurred when the stock market, CME, and BAKKT exchanges were closed because they do not trade 24 hours a day.
G1: Closing price when closed
G2: Cigar at the time of opening
(Example) Gap (G1-G2)

Synthetix Network Token (SNX) - March 18Hello?
Dear traders, nice to meet you.
By "following" you can always get new information quickly.
Please also click "Like".
Have a good day.
-------------------------------------------------- -----
You should watch for any movement that deviates from the 16.809-20.397 section.
It remains to be seen if the volatility around March 23rd (March 22-24) increases above 20.397 points and breaks the downtrend line.
If you go down at 16.809, you can touch 13.222, so you need a Stop Loss to preserve profit or loss.
In order to turn to an uptrend, it needs to be supported in the 20.397-21.592 range.
-----------------------------------------
(SNXBTC 1D chart)
You should see if you can climb along the uptrend line (1) and climb above the 0.0003403 point.
In particular, it remains to be seen if it can deviate from the downtrend lines (3) and (4).
-------------------------------------------------- -------------------------------------------
** All indicators are lagging indicators.
So, it's important to know that the indicator moves accordingly with the movement of price and volume.
Just for the sake of convenience, we are talking upside down for interpretation of the indicators.
** The wRSI_SR indicator is an indicator created by adding settings and options from the existing Stochastic RSI indicator.
Therefore, the interpretation is the same as the conventional stochastic RSI indicator. (K, D line -> R, S line)
** The OBV indicator was re-created by applying a formula to the DepthHouse Trading indicator, an indicator that oh92 disclosed. (Thank you for this.)
** Check support, resistance, and abbreviation points.
** Support or resistance is based on the closing price of the 1D chart.
** All explanations are for reference only and do not guarantee profit or loss on investment.
Explanation of abbreviations displayed on the chart
R: A point or section of resistance that requires a response to preserve profits
S-L: Stop Loss point or section
S: A point or segment that can be bought for profit generation as a support point or segment
(Short-term Stop Loss can be said to be a point where profits and losses can be preserved or additionally entered through installment transactions. It is a short-term investment perspective.)
GAP refers to the difference in prices that occurred when the stock market, CME, and BAKKT exchanges were closed because they do not trade 24 hours a day.
G1: Closing price when closed
G2: Cigar at the time of opening
(Example) Gap (G1-G2)

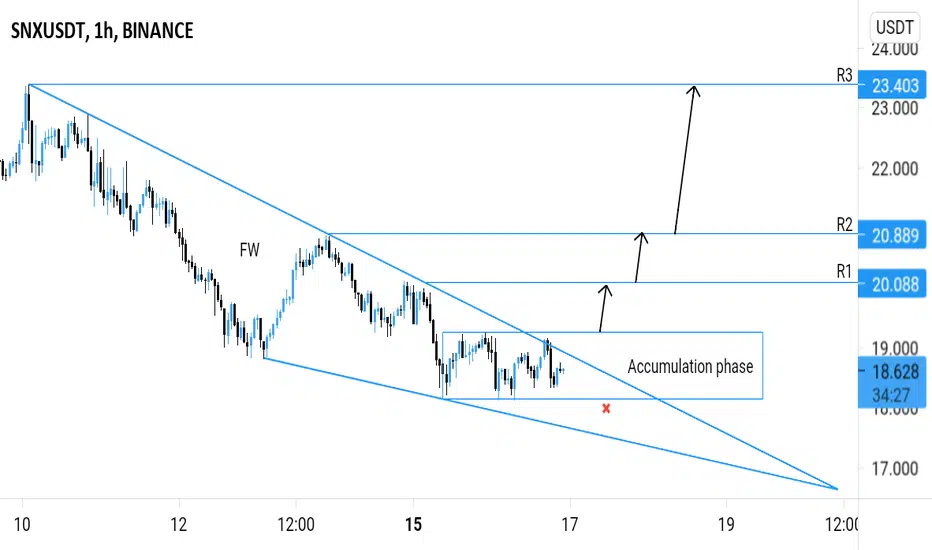
SNXUSDT (SYNTHETIX NETWORK TOKEN) - POTENTIAL BREAKOUT ANALYSIS 🔎
- SNXUSDT was bounded in the falling wedge (FW) pattern.
- A falling wedge pattern is a reversal pattern.
- A bullish pattern to be precise.
- Price brokeout above the falling wedge's resistance.
- The market is consolidating in a rectangular pattern.
- This rectangular pattern consolidation is known as the accumulation phase (wyckoff method).
- The accumulation phase is a pre uptrend phase (bullish build up).
BUY ENTRY ⬆️
- Breakout above the accumulation phase horizontal resistance level.
TARGETS 🎯
- Horizontal resistance level (R1).
- Horizontal resistance level (R2).
- Horizontal resistance level (R3).
SETUP INVALIDATION ❌
- Breakdown below the accumulation phase horizontal support level.
- This breakdown invalidation will probably lead to the retest of the falling wedge's support.
SNX K.I.S.S -LongThe KISS method relies on minimal tools and indicators combined with some intuition to give us trade ideas. Looks like SNX is ready to bounce after retracing, strong volume increase at 3860 sats, RSI pointing to some upside here.
PT 1 5000 sats
PT 2 7000 sats
THIS IS NOT FINANCIAL ADVICE, I AM POOR AND YOU WILL BE TOO IF YOU LISTEN TO ME👌👌👌
I'm new to posting ideas so let me know if there is anything i can do differently! Thank you!

SNXUSDTIt's been 20 hours that SNX is getting rejected by that resistance. (As shown on chart)
The middle Bollinger Band is rising to give a Dynamic Support to the price which might push it up to the TP1 and TP2.
There's also a Static Support which I've pointed out on the chart, that can be a good push up for the price as well.
If none of these supports can hold the price up or push it up, the price can fall to 20 areas or even less.
Tell me your ideas. Like and Share 🗣✅
Comment if you need a chart 💬

💡SNX: BUY Trade🚀🚀🚀🚀🚀🚀 #ALTSEASON2021📈#SNXUSDT
➡️Entry: 20.300$
🎯Target 1: 25.100$
🎯Target 2: 28.200$
🎯Target 3: 35$

SNX Fast ScalpBuy Zones :
- 24$ (Now) - 20% of your capital invest for this trade
-----------------------------------------------------
Rebuy Zones :
- Rebuy 22$ - 30% of your capital invest for this trade
- Rebuy 20$ - 50% of your capital invest for this trade
-----------------------------------------------------
Sell Zones :
TP1 = 28 ATH
TP2 = 32
TP3 = 38
----------------------------------------------------
Stop :
SL : 29.4
----------------------------------------------------
Happy Tr4Ding !


SNXBTC_Daily Let it cross up the 51,500 Satoshi for risk averse investors; then enter!
**************************************
Price : 49,934 Sat
Entry LVL: 50,000-51,500 Sat
Resistance Zone: 49,700-51,000 Sat
Expected Return: 20%
Reward/Risk: 1.4
TP_LVL I: 57,000 Sat
TP_LVL II: 61,500 Sat
SL: 42,000 Sat
**************************************

Interesting pattern forming hereThe pattern is completing or completed so we expect the short. I will keep this chart updated. Thank you for the support.

Synthetix SNXUSDT uptrend channel targetsHi guys,
SNX is one of the best coins to trade recently, posting some serious gains. It is now flirting with the lower boundary of the uptrend channel on the 4-h chart. It is a good opportunity to add some coins to the positions.
Targets in green
Resistance in red
Stop at the 50-day EMA
Regards

SNX - Now staking is live on Optimistic L2 (Big)One of the most promising DeFi blue chip for me.
Synthetix staking is live on Optimistic L2 mainnet ! Big news, I expect #SNX to continue its bull hike.
It's in price discovery zone, so hard to establish a target. Holding spot & leverage position.
Information is just for educational purposes, never financial advice. Always do your own research.
Hit the "LIKE" button and follow to support, thanks!

$SNX/BTC 90m (Binance Spot) Falling wedge breakoutSynthetix Network broke bullish of that falling wedge, the idea is to catch it on a possible pull-back.
Also, 100EMA seems to be acting as support now, that's why entry zone is down there!
Current Price= 0.0004010
Buy Entry= 0.0003915 - 0.0003813
Take Profit= 0.0004074 | 0.0004341 | 0.0004540
Stop Loss= 0.0003653
Risk/Reward= 1:1 | 1:2.26 | 1:3.2
Expected Profit= +5.43% | +12.34% | +17.49%
Possible Loss= -5.46%
Fib. Retracement= 0.382 | 0.618 | 0.786
Margin Leverage= 1x
Estimated Gain-time= 120h

SNX/USDT Price Discovery TargetNot much to say here: SNX has entered price discovery, consolidated and held up well. Parabolic move very likely. Major upside ahead. Approx. 110 Million Staked on Synthetix Network out of 114 Circulating supply. Low liquidity on exchanges could see this thing fly above target.

$SNX Synthetix Quick Analysis Overview ( @synthetix_io )Hello there ladies and gentlemen, BulloTaurus here with a quick analysis for today .
Synthetix is the backbone for derivatives trading in DeFi, allowing anyone, anywhere to gain on-chain exposure to a vast range of assets.
We have various clues that BINANCE:SNXBTC can go higher by breaking the rising wedge on daily timeframe.
Thing that make me bullish is the VPVR indicator, it shows a lot of trading volume on the level we are now, it usually means that it might act as support or resistance in long-term vision.
Trade altcoins wisely in this period, because one strong move by Bitcoin you can lose 10-20% of your position, so always use stop loss to avoid that happening.
Peace.
🍌 Please read the description 1-2 times including the Disclaimer before commenting 🍌
P.S. You're awesome! You can't be successful in all your trades, 30-40% is already higher than average traders you see!

$SNX, Attractive enough... 😏$SNX
Attractive enough... 😏
Flipped ~30k sats into support on the 2D w/ Buy signal active after a quite long accumulation...
Aiming for 40k+ Sats levels from here does not sounds too crazy if volume keeps showing strenght..
#SNX
