Can #SNX Bulls Sustain the Current Momentum? Watch it CloselyYello, Paradisers! Is this #SNX setup just another fakeout in disguise, or is the market quietly setting up for a major bullish momentum shift? Let’s dissect what’s really happening on #SNXUSDT:
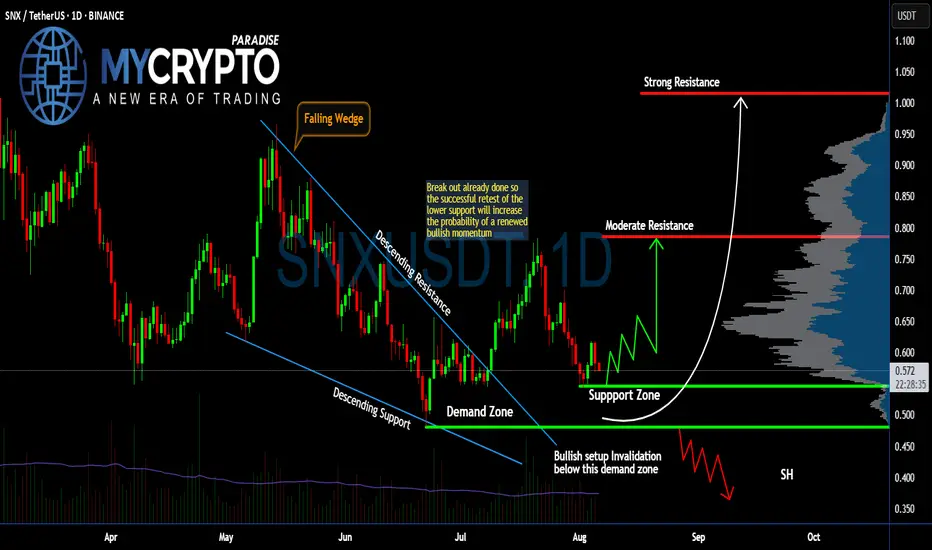
💎After moving through a falling wedge pattern for months, #Synthetix has already broken out above the descending resistance, signaling an early shift in trend. However, the real move hasn’t yet begun—a proper retest of the support zone between $0.50–$0.54 is what we’re watching for now.
💎This support zone aligns with the prior wedge breakout and also overlaps with a visible demand area, making it a key region where buyers could step in again. If bulls defend this area successfully, we expect a renewed rally toward the moderate resistance level at $0.78.
💎From there, the next upside target lies at the strong resistance around $1.01—a level with heavy volume profile resistance and previous seller activity. But that level will only come into play if the bulls reclaim momentum with conviction.
💎On the flip side, if #SNXUSD breaks below $0.48, which is our bullish invalidation level, the setup collapses and opens the door for a deeper drop toward the $0.40–$0.35 zone, where short-sellers are likely to pile in.
Stay patient, Paradisers. Let the breakout confirm, and only then do we strike with conviction.
MyCryptoParadise
iFeel the success🌴
SNXUSD
SNX : Has the climb started?Hello friends🙌
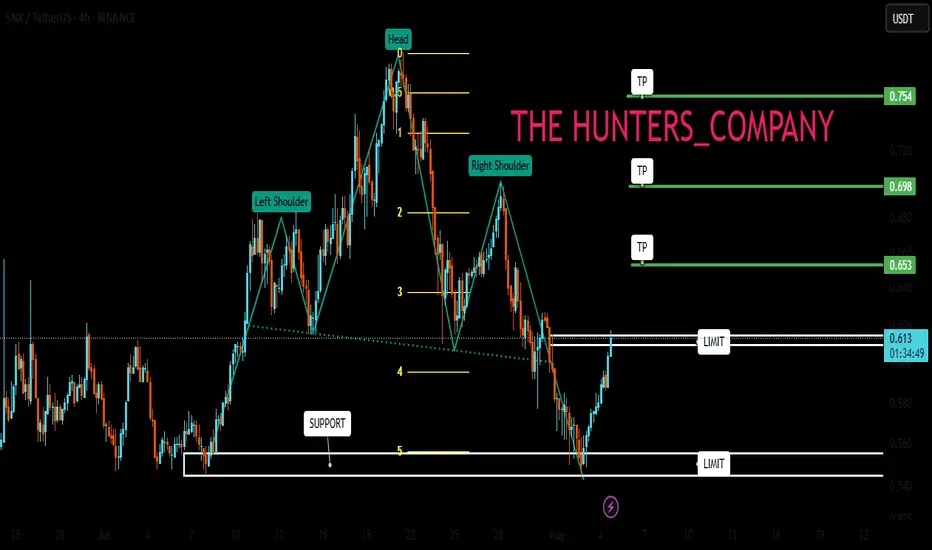
👀According to the shoulder and shoulder pattern that was formed and then the price fell in the support area that we identified for you with Fibonacci, buyers entered and provided good support for the price, which also broke our resistance, which creates a good opportunity to buy, of course with risk and capital management.
🔥Follow us for more signals🔥
*Trade safely with us*
SNXUSDT Breakout Alert! Are We Witnessing the Early Stages?📌 🔍 Overview:
After months of relentless downward pressure, SNX has finally shown a strong technical breakout. The price has decisively broken above the long-term descending trendline, signaling a potential shift in structure from bearish to bullish. This could mark the beginning of a significant impulse wave to the upside.
📐 📊 Technical Structure & Key Pattern Breakdown:
🔻 Broken Downtrend Line: Price action has successfully broken above a descending trendline that has been in place since December 2024, effectively ending the bearish dominance.
🔺 Falling Wedge Pattern: A classic falling wedge has formed and recently completed with a confirmed breakout — a bullish reversal pattern that often precedes strong upside momentum.
🟨 Accumulation Zone (Base Support): The yellow box between $0.60 – $0.72 acted as a major accumulation zone and now flips into a strong demand/support area.
📈 Higher Lows Structure: The recent structure of higher lows signals a shift in market sentiment, showing early signs of accumulation and bullish interest.
✅ Bullish Scenario (Upside Continuation):
If price holds above the breakout zone and confirms strength:
🎯 Target 1: $0.938 (key horizontal resistance)
🎯 Target 2: $1.042 – $1.100 (historical resistance zone)
🎯 Target 3: $1.248 – $1.625
🎯 Target 4 (Mid-term rally): $1.966 – $2.197
🏁 Final Bullish Target (Longer term): $3.372 – $3.686
A strong continuation would require confirmation via increased trading volume and bullish momentum from the broader crypto market.
❌ Bearish Scenario (Failed Retest or Rejection):
However, if the price fails to sustain above the breakout level:
🚨 Risk of a false breakout emerges if price falls back below $0.724
🔻 Breakdown of the yellow support box could trigger a deeper correction toward:
Support 1: $0.60
Support 2 (Major Low): $0.480
This would form a classic bull trap and extend the consolidation phase.
⚠️ Validation & Risk Considerations:
Volume confirmation is key. A breakout without rising volume may lack follow-through.
Watch closely for price action in the coming days — will it hold above the breakout zone or fall back?
Strategy: Look for retest entries or enter with partial exposure, using tight risk management.
🧠 Conclusion:
SNXUSDT is at a pivotal turning point. The breakout from a falling wedge pattern combined with higher low formations is a textbook bullish reversal setup. If price holds and buyers step in, we may be witnessing the early stages of a major bull run for SNX.
#SNXUSDT #SNXBreakout #AltcoinSetup #BullishReversal #FallingWedge #CryptoSignals #CryptoTrading #ChartAnalysis #PriceAction

SNXUSDT 1D Analysis SNX ~ 1D Analysis
#SNX Buy after successfully breaking this resistance line with a short term target of at least 15%+ from here.

#SNX/USDT#SNX
The price is moving within a descending channel on the 1-hour frame, adhering well to it, and is heading for a strong breakout and retest.
We are seeing a bounce from the lower boundary of the descending channel, which is support at 0.827.
We have a downtrend on the RSI indicator that is about to break and retest, supporting the upward trend.
We are looking for stability above the 100 moving average.
Entry price: 0.880
First target: 0.900
Second target: 0.943
Third target: 0.977

#SNX/USDT#SNX
The price is moving within a descending channel on the 1-hour frame, adhering well to it, and is heading for a strong breakout and retest.
We are seeing a bounce from the lower boundary of the descending channel, which is support at 0.711.
We are seeing a downtrend on the RSI indicator that is about to break and retest, supporting the upward trend.
We are looking for stability above the 100 Moving Average.
Entry price: 0.744
First target: 0.765
Second target: 0.785
Third target: 0.811

SNXUSDT Bouncing from Channel SupportSNXUSDT Technical analysis update
SNXUSDT has been trading inside a clear descending channel for the last 1700 days. Recently, the price touched the lower support of the channel and is now showing signs of a bounce.
If the current momentum continues, SNX could move upward toward the upper resistance of the channel. A breakout above the upper trendline would be a strong bullish signal. Until then, the price may stay within the channel.
Price could move 100%-250% in a few months.

SNX Analysis (1D)SNX has broken an old trigger line and is also forming a CP within a channel.
We are looking for buy/long positions in the Demand zone.
Targets are marked on the chart.
A daily candle closing below the invalidation level will invalidate this analysis.
Do not enter the position without capital management and stop setting
Comment if you have any questions
thank you

SNXUSDT 1WSNX ~ 1W
#SNX If you still have Conviction on this coin,. Buy gradually on this support block with a minimum target of 20%+

SNXUSDT 1WSNX ~ 1W
#SNX If you still have Conviction on this coin,. This support block will be a very good buying place for now. buy from here with a minimum target of 20%+

Technical Analysis of Synthetix Network Token (SNX/USD): Key LevThis analysis examines the price movement of Synthetix Network Token (SNX) on the weekly timeframe. The structure of the waves and key trendlines have been identified to help traders determine entry and exit points.
Key Highlights of the Analysis:
Strong Support Zone ($1.75–$1.429):
The price has recently reacted to a critical support zone between $1.75–$1.429, showing a strong rebound.
This zone is significant due to the completion of the fifth wave and its alignment with historical support levels, making it a crucial entry point for buyers.
Descending Trendline:
The price remains under the influence of a long-term descending trendline that has capped further upside movement.
Breaking above this trendline and holding above $2.5 could signal the beginning of a new bullish trend.
Key Resistance Level ($5.884):
The major resistance lies at $5.884, aligning with the peak of previous waves.
Reaching this level could serve as a medium-term target for buyers if the price successfully breaks the descending trendline.
Stochastic Oscillator:
The stochastic oscillator is moving toward the overbought region, suggesting a potential short-term correction.
However, further upward movement is possible, especially if the price consolidates above $2.5.
Potential Scenarios:
Bullish Scenario:
Breaking the descending trendline and surpassing the $2.5 resistance could push the price toward $5.884. This scenario is ideal for medium- to long-term traders.
Bearish Scenario:
If the price declines and retests the support zone at $1.75–$1.429, this area could provide another buying opportunity.
Breaking below this support zone could lead to further declines.
Conclusion:
With the technical structure and key levels outlined, Synthetix Network Token is at a critical juncture. Traders should closely monitor the price’s reaction to the descending trendline and the support zone.

#SNX/USDT#SNX
The price is moving in a descending channel on the 1-hour frame and is expected to continue upwards
We have a trend to stabilize above the moving average 100 again
We have a descending trend on the RSI indicator that supports the rise by breaking it upwards
We have a support area at the lower limit of the channel at a price of 2.16
Entry price 2.20
First target 2.24
Second target 2.31
Third target 2.40

#SNX/USDT
#SNX
We have a bearish channel pattern on a 12-hour frame, the price moves within it, adheres to its limits well, and is expected to break it upwards strongly.
We have a support area at the lower border of the channel at $2.50 from which the price rebounded
We have a tendency to stabilize above moving average 100
We have a downtrend on the RSI indicator that is about to break higher, supporting the price higher
Entry price is 2.60
First goal 3.26
The second goal is 3.60
The third goal is 4.20

SNXUSDT Signals Bullish Move AheadSNXUSDT Technical analysis update
BINANCE:SNXUSDT has been ranging at the bottom for the last 120 days. The price has now broken out above the resistance line with high volume and is trading above the 100 EMA, signaling a bullish trend. This breakout indicates the potential for a strong bullish move in the coming days.
Buy zone : Below $1.77
Stop loss : $1.50
Take Profit 1: $1.99
Take Profit 2: $2.40
Take Profit 3: $3.30
Thank You
Hexa🧘♀️

SNX buy setup (12H)SNX seems bullish. We have iCH on the chart and important trigger lines have been broken and it has stabilized on the upper orderblock range.
By keeping the last OB, you can move towards the targets.
Closing the daily candle below the invalidation level will violate this analysis.
Do not enter the position without capital management and stop setting
Comment if you have any questions
thank you

SNXUSDTSNX ~ 1W
#SNX If you still have Conviction on the coin,. This is a great support block to start buying again. at least for 20%++

SNX looks ready tooLot of great setups on the market now... lot of super bullish structures and SNX is one of them.PA and TA is pure bullish. Target red MA. GL. If you have any questions, let me know in comments.
NOT A FINANCIAL ADVICE + MANAGE YOUR RISK AND USE STOPLOSS

SNX (Synthetix): Falling WedgeTrade setup : Price is in a downtrend, however, it's trading in a Falling Wedge pattern, which typically resolves in a bullish breakout and a trend reversal. We wait for such a breakout.
Patterns : Falling Wedge Usually results in a bullish breakout. When price breaks the upper trend line the price is expected to trend higher. Emerging patterns (before a breakout occurs) can be traded by swing traders between the convergence lines; however, most traders should wait for a completed pattern with a breakout and then place a BUY order. Learn to trade chart patterns in Lesson 8.
Trend : Short-term trend is Strong Down, Medium-term trend is Strong Down and Long-term trend is Strong Down.
Momentum is Bearish but inflecting. MACD Line is still below MACD Signal Line but momentum may have bottomed since MACD Histogram bars are rising, which suggests that momentum could be nearing an upswing. Price is neither overbought nor oversold currently, based on RSI-14 levels (RSI > 30 and RSI < 70).
Support and Resistance : Nearest Support Zone is $1.00. Nearest Resistance Zone is $1.85, then $2.50.

SNX mid-term analysisSNX is trading below a bearish trend line.
The big SNX structure is completely bearish.
It is expected to reach the demand range in the medium term and then move upwards.
We are looking for buy/long positions in the demand range.
Closing a weekly candle below the demand range will violate the analysis.
Note that the financial market is risky, so:
Do not enter a position without setting a stop and capital management and confirmation and trigger.
When we reach the first TP, save some profit and try to move the stop continuously in the direction of your profit.
If you have any comments please post them, comments will help us improve our performance
Thanks

SNX (Synthetix): Falling WedgeTrade setup : Price is in a downtrend, trading in a Falling Wedge pattern. Swing traders: price is approaching the Wedge support trendline and $1.00 horizontal support, and is oversold (RSI < 25!), which makes for a good trade entry, with +50% upside potential to $1.50 key level. Stop Loss at $0.87.
Patterns : Falling Wedge Usually results in a bullish breakout. When price breaks the upper trend line the price is expected to trend higher. Emerging patterns (before a breakout occurs) can be traded by swing traders between the convergence lines; however, most traders should wait for a completed pattern with a breakout and then place a BUY order. Learn to trade chart patterns in Lesson 8.
Trend : Short-term trend is Strong Down, Medium-term trend is Strong Down and Long-term trend is Strong Down.
Momentum : Price is Very Oversold currently, based on RSI-14 levels (RSI < 25).
Support and Resistance : Nearest Resistance Zone is $1.85, then $2.50.

SNXUSDT 1WSNX ~ 1W
#SNX In the past this was a very strong demand zone for price bounce.
At least for a 20%+ upside from here.

#SNX/USDT#SNX
The price is moving within a descending channel pattern on the 4-hour frame and broke it upwards after adhering to it significantly
We have a downtrend on the RSI indicator and it was broken upwards and we have a trend to stabilize above it
We have a major support level in green at a price of 1.60
We have a trend to dot higher than the moving average 100
Entry price 1.72
First target 1.88
Second target 1.98
Third target 2.11

SNXUSDT At a Crucial Point: A Major Breakout or Breakdown Ahead?Yello Paradisers! Could #Synthetix be on the cusp of a massive breakout or a steep decline? The charts are heating up, and the action around the #SNXUSDT is worth watching:
💎#SNX is gearing up for a major breakout from its descending channel on a daily timeframe. The price has consistently respected the trendlines within this formation, but recent developments suggest we could be on the verge of a significant move.
💎#Synthetix is testing the critical support zone of $1.72-$1.94, a crucial area brimming with liquidity. This zone could serve as a launchpad for a breakout above the descending resistance line, potentially marking a trend reversal and aligning with our bullish forecast.
💎There is a Major Support Zone at $1.72-$1.94. A bounce from this level could be the start of an upward rally. Watch for strong buying interest here.
💎If the liquidity at the major support zone isn't enough, we might see a move down to $1.39. A strong buying response at this level could still spark a bullish run for $SNX.
💎However, if both the major and lower support levels fail, #SNXUSDT might face increased bearish pressure, possibly leading to further declines.
Remember, disciplined trading and patience are your best allies.
MyCryptoParadise
iFeel the success🌴
