SNX/USD - Get ready for $30 soon! 🚀🚀🚀SNX is looking sexy. This chart is primed for some nice explosion to the upside (see yellow arrows):
MACD = bullish
RSI = bullish
Volume = bullish
Once we break out of this triangle, the game is on! Make sure you set and alert!
Bias is very much bullish on this chart and provided BTC and ETH don't ruin the fun, we should go higher pretty soon.
Market for alts is getting hot, especially now that BTC dominance has cracked under 60%... you know what that means right? Check my BTC Dominance chart below to find out. :)
Like and follow if you liked this idea! Also join my crypto community to stay in touch!
SNXUSDT

SNX just triggered for a solid bounce play off the lower rangeSNXUSDT just triggered for a possible good risk conscious trade off the lower range. With crypto on whole in a massive bull market bounces off the lower range have been super high probability trades with large returns really quickly. A potential trade could be a buy here with a target up into the 19.50 range. We are trading this long in our live account.

More AccumulationAfter falling from the ascending channel at the end of Feb, I thought it would climb back up into the channel on Mar09, indicated by the 2 blue arrows, but alas, like my ADA plan, this is going equally splendidly.
In a sideways “accumulating” movement (translate, don’t sell at a loss), it has formed a bullish descending flag. Looking at the MacD day timeframe, it looks like a continued “accumulation” till a breakout and a positive green day MacD.
My thoughts, not advice Oklah. Cheers


SNX Down ChannelSNX 4Hr chart can be seen to have formed a down channel
multiple touches on bottom and top of channel


Synthetix Network Token (SNX) - March 24Hello?
Dear traders, nice to meet you.
By "following" you can always get new information quickly.
Please also click "Like".
Have a good day.
-------------------------------------------------- -----
We have to see if we can get support and climb at 16.809.
As such, we need to see if there is any movement to move sideways at 16.809 or break off the downtrend line.
If you go down at 16.809, you can touch 13.222, so you need a Stop Loss to preserve profit or loss.
In order to turn to the uptrend line, it must rise to the 20.397-21.592 section and receive support.
As the OBV on the volume indicator increases green, it remains to be seen if the center line can rise.
It remains to be seen if the CCI line can rise above 100 on the CCI-RC indicator.
---------------------------------------
(SNXBTC 1D chart)
We need to see if it can rise along the uptrend line (1).
In particular, it remains to be seen if the volatility around March 26 could increase more than 3280 Satoshi.
In order to turn to an uptrend, you must get off the downtrend line.
-------------------------------------------------- -------------------------------------------
** All indicators are lagging indicators.
So, it's important to be aware that the indicator moves accordingly with the movement of price and volume.
Just for the sake of convenience, we are talking upside down for interpretation of the indicators.
** The wRSI_SR indicator is an indicator created by adding settings and options from the existing Stochastic RSI indicator.
Therefore, the interpretation is the same as the conventional stochastic RSI indicator. (K, D line -> R, S line)
** The OBV indicator was re-created by applying a formula to the DepthHouse Trading indicator, an indicator that oh92 disclosed. (Thank you for this.)
** Check support, resistance, and abbreviation points.
** Support or resistance is based on the closing price of the 1D chart.
** All explanations are for reference only and do not guarantee profit or loss on investment.
Explanation of abbreviations displayed on the chart
R: A point or section of resistance that requires a response to preserve profits
S-L: Stop Loss point or section
S: A point or segment that can be bought for profit generation as a support point or segment
(Short-term Stop Loss can be said to be a point where profits and losses can be preserved or additionally entered through installment transactions. It is a short-term investment perspective.)
GAP refers to the difference in prices that occurred when the stock market, CME, and BAKKT exchanges were closed because they do not trade 24 hours a day.
G1: Closing price when closed
G2: Cigar at the time of opening
(Example) Gap (G1-G2)

SNXUSDT analysisSNX have strong support in 17$ in Daily and 4h timeframe . and it have bullish divergence rsi in 4h timeframe
all this signs , could be good for long position in midterm .
note : if breakout strong support , it could be change every thing !

SNXUSDT (SYNTHETIX NETWORK TOKEN) - POTENTIAL BREAKOUT ANALYSIS 🔎
- SNXUSDT brokeout above the double bottom (DB) neckline resistance (NR).
- The market hit an ATH and retraced.
- Price retested the key fibonacci retracement zones (0.5 - 0.618 - 0.786).
- A daily timeframe bullish pin bar (BPB) was formed at the retest area.
- Price action is printing a pennant pattern (PP).
- A pennant pattern is a trend continuation pattern.
- A bullish trend continuation pattern in this case.
- There's a breakout potential.
BUY ENTRY ⬆️
- Breakout above the pennant pattern's (PP) inclined resistance.
TARGETS 🎯
- Horizontal resistance level (R1).
- Horizontal resistance level (R2).
- Fibonacci extension levels.
SETUP INVALIDATION ❌
- Breakdown below the pennant pattern's (PP) inclined support.

SNX trade ideaSNX has been quiet lately in comparison to other alts, despite being a great crypto project. This is my current trade for SNX, I think the risk/reward is great here.

Synthetix Network Token (SNX) - March 18Hello?
Dear traders, nice to meet you.
By "following" you can always get new information quickly.
Please also click "Like".
Have a good day.
-------------------------------------------------- -----
You should watch for any movement that deviates from the 16.809-20.397 section.
It remains to be seen if the volatility around March 23rd (March 22-24) increases above 20.397 points and breaks the downtrend line.
If you go down at 16.809, you can touch 13.222, so you need a Stop Loss to preserve profit or loss.
In order to turn to an uptrend, it needs to be supported in the 20.397-21.592 range.
-----------------------------------------
(SNXBTC 1D chart)
You should see if you can climb along the uptrend line (1) and climb above the 0.0003403 point.
In particular, it remains to be seen if it can deviate from the downtrend lines (3) and (4).
-------------------------------------------------- -------------------------------------------
** All indicators are lagging indicators.
So, it's important to know that the indicator moves accordingly with the movement of price and volume.
Just for the sake of convenience, we are talking upside down for interpretation of the indicators.
** The wRSI_SR indicator is an indicator created by adding settings and options from the existing Stochastic RSI indicator.
Therefore, the interpretation is the same as the conventional stochastic RSI indicator. (K, D line -> R, S line)
** The OBV indicator was re-created by applying a formula to the DepthHouse Trading indicator, an indicator that oh92 disclosed. (Thank you for this.)
** Check support, resistance, and abbreviation points.
** Support or resistance is based on the closing price of the 1D chart.
** All explanations are for reference only and do not guarantee profit or loss on investment.
Explanation of abbreviations displayed on the chart
R: A point or section of resistance that requires a response to preserve profits
S-L: Stop Loss point or section
S: A point or segment that can be bought for profit generation as a support point or segment
(Short-term Stop Loss can be said to be a point where profits and losses can be preserved or additionally entered through installment transactions. It is a short-term investment perspective.)
GAP refers to the difference in prices that occurred when the stock market, CME, and BAKKT exchanges were closed because they do not trade 24 hours a day.
G1: Closing price when closed
G2: Cigar at the time of opening
(Example) Gap (G1-G2)

SNX is too underpriced to be missed!based on these simple analysis, SNX is proven to be underpriced. im using ema and rsi indicators, and using snr and trendline drawing method. i hope this is helping you guys to make your decision, goodluck!

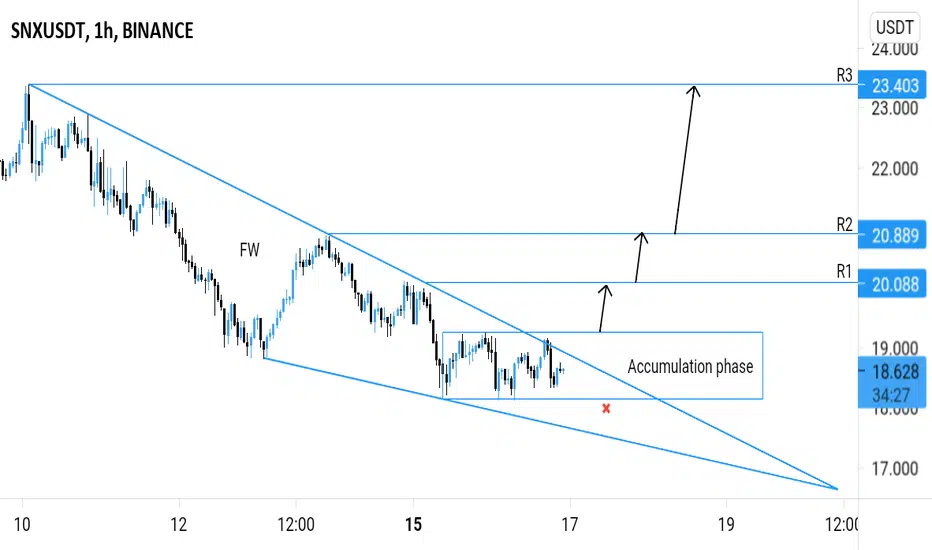
SNXUSDT (SYNTHETIX NETWORK TOKEN) - POTENTIAL BREAKOUT ANALYSIS 🔎
- SNXUSDT was bounded in the falling wedge (FW) pattern.
- A falling wedge pattern is a reversal pattern.
- A bullish pattern to be precise.
- Price brokeout above the falling wedge's resistance.
- The market is consolidating in a rectangular pattern.
- This rectangular pattern consolidation is known as the accumulation phase (wyckoff method).
- The accumulation phase is a pre uptrend phase (bullish build up).
BUY ENTRY ⬆️
- Breakout above the accumulation phase horizontal resistance level.
TARGETS 🎯
- Horizontal resistance level (R1).
- Horizontal resistance level (R2).
- Horizontal resistance level (R3).
SETUP INVALIDATION ❌
- Breakdown below the accumulation phase horizontal support level.
- This breakdown invalidation will probably lead to the retest of the falling wedge's support.
SNXUSDT SellHello Traders!
SNX buyers should be careful because it is going towards a 12$ price. It is slipping from the trend.

$SNXUSD | Imminent Correction Followed by New HighsLook for an imminent correction to occur over the next several weeks/months followed by new highs. Potential reversal points highlighted on chart.

SNX/USDT - Potential targets after the correctionHello, Traders!
SNX corrected the downward movement from 14 February by more than 60%. Buyers were then forced to take a break.
At the moment, the price is at the exit of the consolidation range of $16.39 to $21.80.
The first altcoin moving upward is ETH, followed by Defi-assets. As a reminder, SNX is one of the foremost Defi projects in the cryptocurrency market.
We can consider entering the position at the range of $20.70-21.80
Stop Loss shall be placed at $19.38
Targets will be:
$23.16
$25.70
$28.94
Good luck and watch out for the market.
P.S. This setup is intended for educational purposes only.


Synthetix Network Token (SNX) - March 6Hello?
Dear traders, nice to meet you.
"Like" is a huge force for me.
By "following" you can always get new information quickly.
Thank you for always supporting me.
-------------------------------------------------- -----
We need to see if we can get support from 20.397-21.592 and climb above 23.984 points.
In particular, it remains to be seen if it can rise along the uptrend line (2).
With the volatility period starting around March 9th, we have to see what's going on.
If you fall from the uptrend line (2), you need a short stop loss.
If it falls between 12.026-13.222, a Stop Loss is required to preserve profit and loss.
However, it may rise along the uptrend line (1), so careful trading is necessary.
-------------------------------------------------- -------------------------------------------
** All indicators are lagging indicators.
So, it's important to be aware that the indicator moves accordingly with the movement of price and volume.
Just for the sake of convenience, we are talking upside down for interpretation of the indicators.
** The wRSI_SR indicator is an indicator created by adding settings and options from the existing Stochastic RSI indicator.
Hence, the interpretation is the same as the traditional Stochastic RSI indicator. (K, D line -> R, S line)
** The OBV indicator was re-created by applying a formula to the DepthHouse Trading indicator, an indicator that oh92 disclosed. (Thank you for this.)
** Check support, resistance, and abbreviation points.
** Support or resistance is based on the closing price of the 1D chart.
** All explanations are for reference only and do not guarantee profit or loss on investment.
Explanation of abbreviations displayed on the chart
R: A point or section of resistance that requires a response to preserve profits
S-L: Stop Loss point or section
S: A point or segment that can be bought for profit generation as a support point or segment
(Short-term Stop Loss can be said to be a point where profits and losses can be preserved or additionally entered through installment transactions. It is a short-term investment perspective.)
GAP refers to the difference in prices that occurred when the stock market, CME, and BAKKT exchanges were closed because they do not trade 24 hours a day.
G1: Closing price when closed
G2: Cigar at the time of opening
(Example) Gap (G1-G2)

SNXUSDTIt's been 20 hours that SNX is getting rejected by that resistance. (As shown on chart)
The middle Bollinger Band is rising to give a Dynamic Support to the price which might push it up to the TP1 and TP2.
There's also a Static Support which I've pointed out on the chart, that can be a good push up for the price as well.
If none of these supports can hold the price up or push it up, the price can fall to 20 areas or even less.
Tell me your ideas. Like and Share 🗣✅
Comment if you need a chart 💬

SNX Easy money Synthetix ascending triangle - Bullish.
----------------------------------------------------------------------------------
Easy money: $30 (Psychological resistance: $30, TA resistance: $32)
Midterm target : $100
-----------------------------------------------------------------------------------
Do your own research.
Enjoy!
This is not financial advice.


