Solana SOL Weakness Continues: Is the Next Leg Lower Coming? 📉 Solana ⚡ is showing signs of weakness, maintaining a clear bearish trend on this 4H timeframe. Price action has traded into a key support zone, with a potential pullback offering an opportunity to enter short at a premium before the next leg lower 🔻.
If sellers remain in control, we could see a continuation to lower levels 📉.
⚠️ Not financial advice—always manage risk appropriately!
SOL

$SOL Dumps 60% - Is it Over !?CRYPTOCAP:SOL DUMPED OVER 60% ‼️
That’s after a 3,500% pump
from the bear market low in ’22.
Is it over!?
TL;DR - NO.
This is common after such an insane pump.
SOL Dec ’20 - May ’21
5,700% pump
71% correction
then another 1,290% pump
Let’s look at previous cycles with $ETH.
Dec ’16 - June ’17
6,380% pump
67% correction
then another 916% pump
Dec ’18 (bear market low) - May ’21
4,860% pump
62% correction
then another 185% pump
So you see my fine feathered friends,
there’s nothing new here.
Targets still remain $700-850 🤠

SOL/USDT LONG SET UP (Solana)Entry 1 $120.00
Entry 2 $110.00
Stop loss $95.00
Take profit 1- $145.00
(Close 33%)
Take profit 2- $170.00
(Close 66%)
Take profit 3-$195.00
(Close 100%)

Bitcoin CME Gap at $77,930 Filled! Now, can $BTC push to $150K?Bitcoin CME Gap at $77,930 Filled! Now, can CRYPTOCAP:BTC push to $150K? 🚀
🔹 Support Level: $75,000 – If it holds, #BTC may target $100K+
🔻 If support breaks, my spot bids: $72K | $69K | $66K (Already filled at $77K ✅)
This drop was a liquidity flush to shake out high leverage traders. Stay prepared!
📢 Where’s your next buy order? Share below! 👇
#Bitcoin

Fate of Solana As seen in this weekly candle size chart of #solusd i' ve explained all with balloons.
In 5 years period, #solana price has formed a huge bullish cup & handle pattern, but after relief rally has finished, #sol price heavily declined after completing the pattern. (X in the chart) Then, CRYPTOCAP:SOL failed the retest of the breakout zone that it accumulated more than 9 months. This was the 2nd bad declination.
And now, #solusdt is now testing weekly ichimoku cloud!.. This' one of the most important zone to be defended by the bulls. Losing this zone with weekly closings will be doom for the long term chart structure. So, must be defended at all costs to avoid bear season in mid term. Current situation is not safe for now.
For fully invalidation, #solusd must reclaim above 300 usd region with monthly close. Not financial advice. DYOR. (This' not a short term strategy)

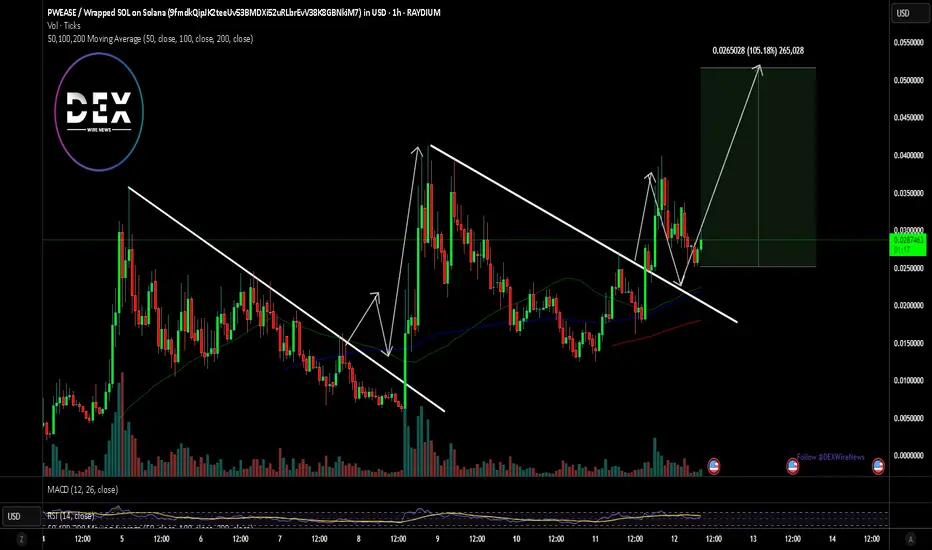
$PWEASE Coin surged 29% Today Amidst Falling Wedge Pattern$PWEASE coin built on the solana blockchain, created on the Pump.fun platform graduated from a bonding curve and is making waves surging 29% for the past 24 hours with eyes set on a 100% surge amidst 2 consecutive falling wedge patterns identified on the chart.
With the RSI at 54.43 this gives more room for $PWEASE to capitalize on the wedge and pick momentum up. If this move should materialize, $PWEASE is set to break the recent All time high of $0.03884.
Pwease Price Live Data
The live Pwease price today is $0.028897 USD with a 24-hour trading volume of $31,547,475 USD. Pwease is up 29.32% in the last 24 hours, with a live market cap of $28,895,321 USD. It has a circulating supply of 999,926,221 PWEASE coins and a max. supply of 1,000,000,000 PWEASE coins.
Bullish Pattern Forming & Key Resistance Test📊 $SOL/USDT Market Update – Bullish Pattern Forming & Key Resistance Test
📈 Solana ( CRYPTOCAP:SOL ) is currently forming a bullish pattern. A breakout above the black resistance line could signal further upside momentum.
🔄 If CRYPTOCAP:SOL successfully breaks this resistance:
First target: Blue line level (previous Lower High - LH).
📌 Failure to break the resistance may lead to a pullback before another breakout attempt.

For Solana, the $74-$110 range.For Solana, the $74-$110 range seems like a solid Spot entry point, with long-term targets of $800-$1000.
Why $74-$110? Because Coinbase has large limit buy orders set at $74 and $85 for Solana.
Waiting for the stock market and crypto market to drop.
The right moment to enter Spot is coming soon.

Solana's important supporthello friends
Due to the heavy demand of Solana and the construction of new floors based on the market cycle, we expect a new floor within the specified range.
If we reach the support range of 105-110 dollars, we can buy with confirmation, of course, with capital management...
*Trade safely with us*

Solana: Time to Buy or More Pain Ahead?Solana has been in freefall since peaking at nearly $300 on January 19, 2025, dropping a staggering 61% to $115,47 in just 50 days, currently trading at around $119. A support zone for potential reversals.
The big question now: Is this the time to go long, or is more selling pressure ahead? Let’s break it down.
Key Support & Resistance Levels
Lost Key Level at $120
Solana lost the key support at $120, turning it into a resistance zone. For bulls to regain control, SOL must reclaim this level with confirmation and increased volume.
Next Key Lows to Watch
Below the current price, the next key liquidity zones are at $110 and $105, where buyers may step in.
Major Support Zone – $104 to $96
If selling continues, we have a strong support zone between $104.14 and $96.96, backed by multiple confluences:
Anchored VWAP Support: Taking the anchored VWAP from the 2023 lows at $8, we find it currently aligning near $100, a key psychological level.
Monthly Order Block: On the monthly timeframe, an order block sits right at $100 mark, reinforcing this level as strong support.
2024 Yearly Open: The yearly open from 2024 is at $101.72, adding another layer of confluence.
0.666 Fibonacci Retracement: Measuring from $8 to the all-time high of $295.83, the 0.666 Fib retracement is at $104.14, further strengthening this support zone.
Liquidity Pools: There's a lot of liquidity around the $100 area
Fib Speed Fan Support: The 0.7 Fib speed fan also aligns perfectly with this support zone.
Conclusion: The $104–$97 range becomes a high-probability long entry zone with minimal risk.
Long Trade Setup
Entry Zone: $118 – $97
Stop Loss: Below $95
Take Profit Target: $135
Average Entry: $105 (DCA)
Risk-to-Reward (R:R): a solid 3:1 or better
Strategy & Execution
With SOL already down over 60%, scaling into a long position makes sense. Here's how to do it the right way:
1️⃣ DCA Strategy – Instead of going all in, scale in gradually within the $118–$97 range for a better average entry.
2️⃣ Volume & Price Action – Watch for a spike in volume and bullish price action before adding to the position.
3️⃣ Psychological Level Play – There are likely many buy orders around $100, meaning a bounce before hitting lower support is possible.
Stay tuned for updates as this trade unfolds! 🚀

Comprehensive Analysis of SOLANAI do believe that SOL is going to dip more, please watch the analysis that I've posted here and let me know your thoughts.

Breaking: Solana Tanking HardSolana often referred to as the Ethereum killer is tanking hard albeit Bitcoin also dipped to the $79k zone. Designed to facilitate decentralized app (DApp) creation, aiming to improve scalability by introducing a proof-of-history (PoH) consensus combined with the underlying proof-of-stake (PoS) consensus of a blockchain, SOL has been building a scalable network with massive growth noticeable in its ecosystem.
With Selling pressure increasing, Solana could be on the brink of a massive selling spree with support pegged to the $110-100 pivot points.
However, should Solana bounced back and break pass the 78.6% Fibonacci retracement point, a trend reversal is inevitable. With the RSI at 35, a little shift to a 45 point in RSI could be all what Solana needs to catalysed a bullish breakout.
Solana Price Live Data
The live Solana price today is $124.43 USD with a 24-hour trading volume of $4,578,943,167 USD. Solana is down 6.54% in the last 24 hours, with a live market cap of $63,337,175,317 USD. It has a circulating supply of 509,018,387 SOL coins and the max. supply is not available.

We are due a 2017 style ALT season.One for the memory banks!
Now
do we actually get what we are "owed" ?? :)
We don't know
and nothing is owed to us of couurse
But
Selling too soon could be quite disastrous... as many peopleI speak to say to me 5X - 10X I am out..
Which may be prudent
If you are out. Stay out and don't FOMO back in again near the tops
So it's best to scale out in my opinion
last cycle was a quite difficult Alt season ... some bag holders actually did not get to experience any euphoria
Hence why I am leaning to an exsplosive alt season
BTC at $70k doesn't feel euphoric
so what will it take?

Solana Update: What About Now, Still Bullish? Yes!What can you tell me about Solana?
Are market conditions different now? Should we worry? Are we still bullish?
Is Solana growing or will it crash based on the chart?
Good questions my friend, great questions.
Market conditions stay the same.
The bullish jump 2-March was rejected but the action continues as a higher low compared to 28-February, and Solana is still trading above a long-term support zone. Above support means bullish.
Market conditions are bullish for Solana because support was tested and support holds. Conditions are bullish because after six days of bearish action the market remains strong. There is no bearish volume, no bearish momentum, no bearish force, mute.
If there was a retrace, it is just because the last move was a reactive event. That being the case, the market erased the move and conditions revert back to before the reaction took place. This means that the basics are in place.
The low is, trading above support. Nothing changes, Solana is set to grow.
Corrections, drops, swings, shakeouts and retraces are an opportunity to buy-in, rebuy and reload. Focus on the long-term while you do so. Solana will soon trade above $700 and it can reach $1,000, $2,000 or more. It will be wild, numbers will go off the chart.
I cannot say anymore so we wait, but you will be extremely happy with the results in several months if you decide to buy and hold.
Namaste.

sol buy midterm"🌟 Welcome to Golden Candle! 🌟
We're a team of 📈 passionate traders 📉 who love sharing our 🔍 technical analysis insights 🔎 with the TradingView community. 🌎
Our goal is to provide 💡 valuable perspectives 💡 on market trends and patterns, but 🚫 please note that our analyses are not intended as buy or sell recommendations. 🚫
Instead, they reflect our own 💭 personal attitudes and thoughts. 💭
Follow along and 📚 learn 📚 from our analyses! 📊💡"
The Era Of Solana SOL Has Been Finished Hello, Skyrexians!
BINANCE:SOLUSDT is the best altcoin of 2023-2024 years because it made 30x from the bottom even on the fake bull run in crypto. This bull run was fake because the true bull run is possible only on DXY dump, but this time Bitcoin and Solana has been growing parallel with the Dollar Currency Index. These assets absorbed all liquidity of the crypto market and on the true bull run it will give it back.
The technical picture is very ugly. Recently we pointed out that Solana has completed the 5 waves cycle and now it's printing ABC correction. Wave A now is in progress and it consists of 5 waves as well. Looking at AO and Fibonacci we can conclude that now asset is finishing the wave 5 which has a target at $110. There we need to see green dot on the Bullish/Bearish Reversal Bar Indicator From there we expect bounce to $200 in the wave B and after that the bear market continuation to targets somewhere below $100.
Best regards,
Skyrexio Team
___________________________________________________________
Please, boost this article and subscribe our page if you like analysis!

$SOL Trying For W Patter ReversalTHE MARKET REALLY WANTS TO GO UP.
Stronger coins, such as CRYPTOCAP:SOL
keep putting in higher lows.
If we close above the EMA9 on the Daily that will be really telling.
A bit premature to call a reversal, but I’ve been speculating on this W reversal pattern forming since Trump announced the Crypto Strategic Reserve.
Perfect setup for that.
The lack of liquidity is the only thing holding back the reversal and reason for the pump n dumps on every bit of news.

Playing Yearly Levels on SOL: Targeting $170I know the market looks dreadful, especially for most coins within the Solana ecosystem. However, this is simply a retest of the breakout levels and the Point of Control (POC) into the $130s.
If there’s a chance to get it cheaper around $122, I’ll place a bid, along with the last level. These are spot buys, of course.
This is all true as long as BTC stays above $75K, so keep that in mind when taking risks. If BTC decides to challenge sub-$80K territory, be cautious.
I’m not looking for new all-time highs (ATHs), but a retest around $170 would be welcomed.
CRYPTOCAP:SOL BINANCE:SOLUSDT

Will SOL start growing now that Trump has announced the reserve?Hi everyone, let's look at the 1D SOL to USD chart, in this situation we can see how the price is moving in an ascending channel where it is currently struggling to stay in the lower part of the channel.
Let's start by defining the targets for the near future that the price has to face:
T1 = 172.96 USD
T2 = 202.57 USD
Т3 = 223.84 USD
Т4 = 250.58 USD
Now let's move on to the stop-loss in case the market continues to fall:
SL1 = 139.90 USD
SL2 = 114.89 USD
SL3 = 94.76 USD
SL4 = 74.35 USD
It is worth looking at the MACD indicator where we can see how low we have gone much lower than during the previous declines, which could potentially indicate that the price will try to go up if the ongoing bullish trend is maintained.

SOLUSDT at Critical Resistance – Will Bears Take Over? Yello, Paradisers! Is SOLUSDT setting up for a major drop? The technicals are flashing warning signs, and you need to pay attention.
💎SOLUSDT has broken down rising wedge, showing a loss of bullish momentum. On top of that, a bearish divergence is appearing, and the price is currently testing key resistance at the 200 EMA—a combination that significantly increases the probability of a bearish move.
💎If SOLUSDT retests the resistance zone and the 200 EMA again, a double top formation could play out. But before jumping in, waiting for bearish confirmation is the smart move.
💎If price breaks above and closes a candle above the resistance, it will invalidate the bearish thesis. In that case, patience is key—waiting for clearer price action will be the best approach.
🎖Trading isn’t about guessing—it’s about waiting for high-probability setups and executing with discipline. Stay sharp, Paradisers, and remember: the market rewards patience, not impulsive moves.
MyCryptoParadise
iFeel the success 🌴

Solana's Flush Is Over: The Path Toward $500+ Is Now ClearThis is it!
Good afternoon my fellow Cryptocurrency trader, we are ready and live today. Solana's low has been hit.
Are you a Solana trader, buyer, holder?
Are you a Solana fan?
If yes, I have great news for you.
The low is in!
Solana's low has been hit.
Get ready for a massive bullish phase.
➖ Technical Analysis
SOLUSDT just activated a very strong support zone. This is the support zone that was created between June and October 2024. A consolidation phase that lasted more than four months and launched a bullish wave that peaked at $296.
This same support range is now being activated with a higher low, and this will lead to a new market phase, the 2025 bull-market. A higher low leading to a very strong higher high; a new All-Time High plus much more.
Easy target here is set around $379 but there is room for more, much more because we are about to experience long-term growth. First, we will have three months green, that is March, April and some May. Then likely a correction and then additional growth leading to the bull-market bull-run phase. This is a rough presentation, we will go deeper as we study together the market and the charts. Huge profits will be made.
This is fun.
This is awesome.
We are ready to trade.
Thank you for reading.
Namaste.

Solana 10X Trade-Numbers (3,810% Potential)Buy when prices are low. Sell when prices are high.
Sell at resistance. Buy at support.
Solana right now is trading at long-term support. The same support range that has been active and valid since April 2024. This support was challenged many times and always holds. —Buy at resistance, sell at support.
This is a great setup, great price, great timing. Risk still exist though.
Leveraged trading is high risk and for experts only.
I am wishing great profits and good luck.
—Full trade-numbers below:
_____
LONG SOLUSDT
Leverage: 10X
Entry levels:
1) $140
2) $135
3) $130
4) $125
Targets:
1) $188
2) $195
3) $210
4) $234
5) $249
6) $273
7) $312
8) $340
9) $375
10) $477
11) $575
12) $664
Stop-loss:
Close weekly below $125
Potential profits: 3810%
Capital allocation: 5%
_____
Thanks a lot for your continued support.
Namaste.

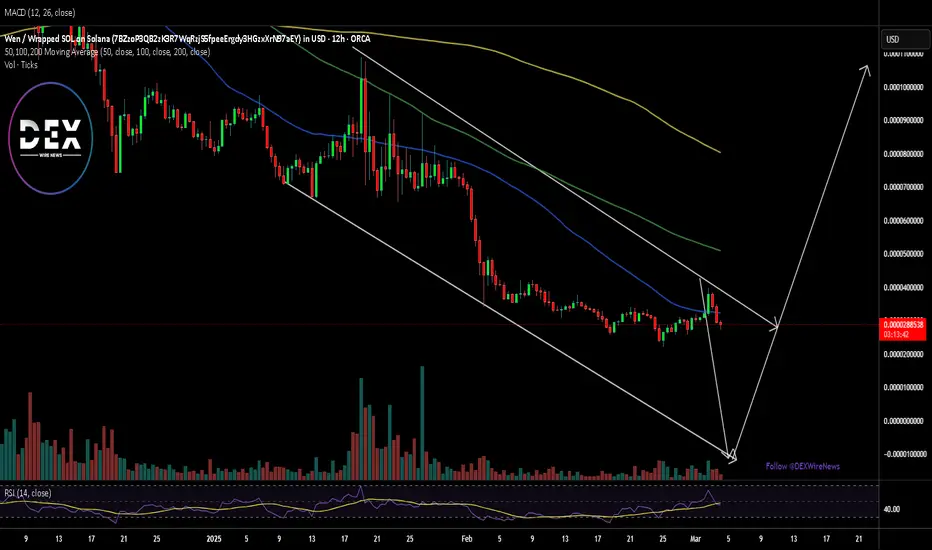
WEN Set For a Breakout Amidst Falling Wedge PatternBuilt on the Solana Ecosystem NASDAQ:WEN seems to be enroute of a bullish reversal amidst a falling wedge pattern. The falling wedge was largely attributed by the overall cool off of the crypto currency landscape with CRYPTOCAP:BTC seeing a major dip from $95k down to $85k.
For NASDAQ:WEN , the asset might further dip to the base of the wedge formed as seen in the chart depicted above before picking liquidity up and surging towards greater highs.
What is WEN
Wen is culture. Wen is a movement. Wen is the internet’s cutest cat and the heart of a growing global phenomenon. More than a brand, Wen is on a mission to become one of the world’s most iconic and beloved IPs.
Wen started as a free airdrop to 1M+ recipients to give back. There were zero influencers, whales, or insiders involved and each recipient received the exact same amount - this made Wen the fairest and widest distributed airdrop ever on Solana. Emphasizing Wen is a coin for the people.