Solana Targets $140 Then $116Keeping this Technical Analysis simple. We need to stay above $160 or the $140 demand zone we be more likely for a bounce.
IF THE $140 LEVEL FAILS, WE CAN LOOK AT $116 NEXT FOR THE MOST LIQUIDITY FOR A BOUNCE.
Calculate Your Risk/Reward so you don't lose more than 1% of your account per trade.
Every day the charts provide new information. You have to adjust or get REKT.
Love it or hate it, hit that thumbs up and share your thoughts below!
This is not financial advice. This is for educational purposes only.
SOL

$SOL vs $ETH MCPublishing this to track this chart
Is a chart of SOL Market Cap dominance over ETH Market Cap dominance
A VERY bullish chart and classic uptrending chart, following supports/resistances, while playing respects to fibs.
Right now CRYPTOCAP:SOL is at 17% the market cap of CRYPTOCAP:ETH , expecting this to reach minimum 33% at the 2.618 fib, 50% target after that at the 3.618 fib)
Fundamentally, more on-chain activity is happening on CRYPTOCAP:SOL , retails mindshare is on CRYPTOCAP:SOL , 0 fees, instant transactions are the future.
A classic case of fundamentals and technicals coming together, typically strong confluence indicator in $crypto.
If you have been following me these past couple years, I called CRYPTOCAP:SOL at $8 as the bottom and was accumulating heavy under $20. I believe CRYPTOCAP:SOL reaches minimum $250B market cap this cycle or $500+ as a very conservative target (see my other charts published).
gl hf
-@CryptoCurb

SOL looks bearish (6H)From where the red arrow is placed, the SOL correction has started.
The correction looks like an ABC and wave B is a diametric.
Where the green arrow is placed on the chart, the SOL diametric starts.
It seems that we are now in wave F of this diametric.
The green range is a strong support range.
Closing a daily candle above the invalidation level will violate the analysis.
For risk management, please don't forget stop loss and capital management
When we reach the first target, save some profit and then change the stop to entry
Comment if you have any questions
Thank You

Alikze »» FIL | Big C or 3 wave scenarioIn the daily and weekly time, it is moving in an upward channel, which according to the previous analysis , the last wave had the ability to grow to around 100% of the previous wave, after which it faced correction, which was correctly mentioned in the updates of the previous post. And extended to the specified area of correction.
💎 First scenario: Therefore, if this last correction, which is extended in the form of three waves up to the green box range, is completed and its structure does not constitute a complex combination correction, we can expect a sharp super cycle of wave C or 3 from it. In the first step, it will conquer the ceiling of the previous major and after that it can touch the specified supply area.
💎 Alternative scenario: If the green box range is broken, this correction can extend further to the $4 range and then to $3.125, in which case it should be updated again.
If the behavior and structure of the post changes, it will be updated.
»»»«««»»»«««»»»«««
Please support this idea with a LIKE and COMMENT if you find it useful and Click "Follow" on our profile if you'd like these trade ideas delivered straight to your email in the future.
Thanks for your continued support.
Sincerely.❤️
»»»«««»»»«««»»»«««

Alikze »» SUI | Wave 3 or short-term bullish C scenario🔍 Technical analysis: Wave 3 or short-term bullish C scenario
- It has a bullish guard in the 4H time frame.
- After an upswing to the 1.172 range, it has had a zigzag correction.
💎 Currently, according to the upward momentum, it can have a pullback to the broken structure (green box) to continue the upward trend.
- The 1.025 area can be used as a support to continue the path.
- This ascending wave can be in the form of ascending wave 3 or C in the short term. Therefore, 💎 the first target of that supply range is the 0.78 fibo range and after that the ceiling of the channel is the 1.29 range.
💎 If the upward trend continues, it can be considered as a support for the next supply area after the failure of the supply area.
💎 In addition, if the previous floor range is broken, it can invalidate the bullish scenario, in which case it should be updated.
»»»«««»»»«««»»»«««
Please support this idea with a LIKE and COMMENT if you find it useful and Click "Follow" on our profile if you'd like these trade ideas delivered straight to your email in the future.
Thanks for your continued support.
Best Regards,❤️
Alikze.
»»»«««»»»«««»»»«««

SOL Solana Technical Analysis and Trade Idea 📊 In our latest video, we delve into two SOL (Solana) options: a strategic entry point for dollar-cost averaging if you’re accumulating SOL, and an intraday trade concept tailored for active traders. As usual, the video provides insights on my trade entry points, trend analysis opinions, market structure, and price action. Remember, this content is educational in nature and not intended as financial advice. 📈 🚀

SOL Long Trade SetupCurrent Situation:
Price Level: SOL recently pumped and is now trading at the top of the range area of support around $170, providing a potential entry point for a long trade.
Trade Strategy:
Entry Point: Enter a long position at the current support level of $170.
Take Profit Targets:
First Target: $190 – $210
Second Target: $240 - $260
Stop Loss: Set just below $160 to manage risk.
Summary:
SOL's recent price action has positioned it at a strong support level of $170, making it an ideal point for a long trade. The take profit targets are set at $190 – $210 and $240 - $260, with a stop loss just below $160 to protect against potential downside.

Could price reverse from here?SOL/USD is rising towards a resistance level which is an overlap resistance that lines up with the 50% Fibonacci retracement and could reverse from this level to our take profit.
Entry: 175.23
Why we like it:
There is an overlap resistance level which lines up with the 50% Fibonacci retracement.
Stop loss: 188.78
Why we like it:
There is a pullback resistance level.
Take profit: 158.28
Why we like it:
There is a pullback support level which lines up with the 61.8% Fibonacci retracement.
Please be advised that the information presented on TradingView is provided to Vantage (‘Vantage Global Limited’, ‘we’) by a third-party provider (‘Everest Fortune Group’). Please be reminded that you are solely responsible for the trading decisions on your account. There is a very high degree of risk involved in trading. Any information and/or content is intended entirely for research, educational and informational purposes only and does not constitute investment or consultation advice or investment strategy. The information is not tailored to the investment needs of any specific person and therefore does not involve a consideration of any of the investment objectives, financial situation or needs of any viewer that may receive it. Kindly also note that past performance is not a reliable indicator of future results. Actual results may differ materially from those anticipated in forward-looking or past performance statements. We assume no liability as to the accuracy or completeness of any of the information and/or content provided herein and the Company cannot be held responsible for any omission, mistake nor for any loss or damage including without limitation to any loss of profit which may arise from reliance on any information supplied by Everest Fortune Group.

SOL/USDT Analysis: Preparing for the Breakout🔍The market is still ranging, and we are waiting for our triggers to be activated before opening positions.
📆 Coin of the Day: SOL
About the Project
Solana (SOL) is known for its high-speed blockchain technology and increasing adoption. It remains a significant player in the crypto space with a strong ecosystem.
🧩 Technical Analysis
4-Hour Timeframe
This analysis focuses on futures trading, examining different scenarios.
♟ Support and Resistance: SOL has found support at 162.32. The price is currently ranging, with primary resistance levels at 167.81 and 172.52. A major resistance level is observed at 187.29.
📉 Bearish Scenario: If a candle closes below 162.32, the next bearish phase might start, with the first support target at 157.40. Further bearish confirmation could be found if the price breaks below 157.40, with the next support level at 151.00. A break below 50 on the RSI could confirm the bearish momentum.
📈 Bullish Scenario: If the price breaks above 167.81, we can look for a target at 172.52. A break above 172.52 would set the next target at 187.29. A break above 50.67 on the RSI could confirm the entry of bullish momentum into the market.
📊Volume Analysis
Current volume at 429.872K indicates a need for increased buy volume to confirm resistance breakouts. Monitoring volume convergence with price action is crucial to avoid false breakouts.
👨💻 Trading Positions
🪄Long Position
Primary Entry Trigger: Break above 167.81
Strategy: Open a position on the break of 167.81 and wait for confirmation from the price to set the target at 172.52. Consider taking partial profits at 172.52 and adjusting stop loss to entry.
Secondary Entry Trigger: Break and stabilization above 172.52
Strategy: Open a position on the break and stabilization above 172.52, targeting 187.29. Look for increasing volume and RSI confirmation for stronger bullish momentum.
💣Short Position
Primary Entry Trigger: Break below 162.32
Strategy: Open a position on the break of 162.32 as this is a very critical level in the market. Target the next support at 157.40. Adjust stop loss based on price action.
Secondary Entry Trigger: Break below 157.40
Strategy: Open a position on the break of 157.40, targeting the next support at 151.00. Look for volume increase and RSI breaking below 50 for confirmation of bearish momentum.
📝 Summary: SOL is currently ranging within key support at 162.32 and resistances at 167.81, 172.52, and 187.29. Traders should watch for breaks of these critical levels to open positions. Volume analysis suggests that the next move could be significant. Long positions should be considered above 167.81 and 172.52, while short positions should be considered below 162.32 and 157.40. Always keep an eye on the RSI for confirmation of momentum in either direction.
🧠💼It's important to acknowledge the inherent risks in futures trading, with the potential for margin calls if risk management is neglected. Always adhere to strict capital management principles and utilize stop-loss orders, ensuring that the initial target offers a risk-to-reward ratio of 2.
🫶If you enjoyed this analysis and want to support me, please boost this analysis. Feel free to leave a comment or suggest a coin you'd like me to analyze next.

Break and ConsolidationAfter breaking and consolidating above the downward trendline, SOL has the potential to move towards the price targets of $171 to $175 area. So keep Solana on your watchlist.

Solana's Magic Eden NFT Volumes Top Bitcoin and EthereumSolana's Magic Eden, a non-fungible token (NFT) marketplace, has seen a surge in trading volumes, dominating the Solana ( CRYPTOCAP:SOL ), Ethereum, and Bitcoin networks. This surge comes as total NFT volumes have dropped in the last 30 days. The platform has surpassed NFT marketplace Blur on Ethereum, with its market share increasing to 41.39%. On Solana ( CRYPTOCAP:SOL ), Magic Eden maintains its lead with 75.79%, with assets worth over 17K SOL. Recent market activity has boosted its lead, with Tensor and Sniper coming up next with 19.38% and 2.40%, while Hyperspace and Hadeswap rank next with 1.21% and 0.98%, respectively. On-chain data from Tiexo points to a rally in Solana volumes, with volumes 18% to 22.7 SOL, approximately $3.81 million.
Magic Eden dominated NFT volumes in the Bitcoin ecosystem, posting 55.07% of the market share. In December, Solana ( CRYPTOCAP:SOL ) topped Ethereum in NFT volumes as users purchased projects based on the platform. However, recent data from CryptoSlam shows a drop in overall volumes, with volumes plummeting 54% to $624 million from last month's over $1 billion volume. Bitcoin NFT sales plummeted 68%, while Ethereum and Solana experienced a 55% and 48% drop, respectively.

MEW continues to get weaker. Descending triangle on the daily.
Notice how the supply zone (red box) maintained an aggressive resistance.
Previous demand zone later turned into supply zone (purple box) that the price couldn't sustain.
If this breaks the triangle, it may see some bids in the demand zone (green box) of the previous ATL.
Overall, bearish.
Educational purposes only. Not financial advice.

SOL: Pullback in UptrendTrade setup : Price is in an Uptrend. Pullback near $160 support and long-term up trendline ($143) could be an attractive swing trend entry in Uptrend, with +25% upside to $200. Stop Loss (SL) level at $140.
Pattern : Pullback in Uptrend . Price remains in an Uptrend but has pulled back, which could present a 'buying dip' opportunity. Traders should look for the nearest support level where price could stabilize and resume its Uptrend. This support level could be a level where price bounced off of in the past, or a level that was previously resistance. (concept known as polarity).Learn to trade key levels in Lesson 3.
Trend : Short-term trend is Up, Medium-term trend is Strong Up and Long-term trend is Strong Up.
Momentum : Price is neither overbought nor oversold currently, based on RSI-14 levels (RSI > 30 and RSI < 70).
Support and Resistance : Nearest Support Zone is $160.00, then $125.00. Nearest Resistance Zone is $200.00.

BODEN isn't out of the race yet. The token remains channel bound.
The chart provides a clear explanation, showing a lot of activity.
It could still be in the accumulation phase, as the selling pressure continues to decrease, indicated by low-volume bars.
There's no reason to be bearish yet, but that could change at any moment.
DISCLAIMER: This is not financial advice (NFA); please conduct your own research before making any investment decisions.

Heading into 50% Fibonacci resistance?SOL/USD is rising towards a resistance level which is an overlap resistance that aligns with the 50% Fibonacci retracement and could potentially reverse from this level to our take profit.
Entry: 175.23
Why we like it:
There is an overlap resistance level which lines up with the 50% Fibonacci retracement.
Stop loss: 188.78
Why we like it:
There is a pullback resistance level.
Take profit: 158.78
Why we like it:
There is an overlap support level which lines up with the 61.8% Fibonacci retracement.
Please be advised that the information presented on TradingView is provided to Vantage (‘Vantage Global Limited’, ‘we’) by a third-party provider (‘Everest Fortune Group’). Please be reminded that you are solely responsible for the trading decisions on your account. There is a very high degree of risk involved in trading. Any information and/or content is intended entirely for research, educational and informational purposes only and does not constitute investment or consultation advice or investment strategy. The information is not tailored to the investment needs of any specific person and therefore does not involve a consideration of any of the investment objectives, financial situation or needs of any viewer that may receive it. Kindly also note that past performance is not a reliable indicator of future results. Actual results may differ materially from those anticipated in forward-looking or past performance statements. We assume no liability as to the accuracy or completeness of any of the information and/or content provided herein and the Company cannot be held responsible for any omission, mistake nor for any loss or damage including without limitation to any loss of profit which may arise from reliance on any information supplied by Everest Fortune Group.

Solana's Phantom Wallet Introduced Bitcoin Ordinals integrationSolana ( CRYPTOCAP:SOL ), the popular cryptocurrency, has been regaining attention as it hosts Bitcoin Ordinals on its associated Phantom Wallet. The platform has announced that Bitcoin support is now out of beta and available to everyone, eliminating the need for users to rely on centralized exchanges or unfamiliar wallets for collecting Ordinals. The team of developers at Phantom has dedicated themselves to enhancing the Bitcoin experience since its beta debut in December 2023.
Users can now buy and sell Ordinals and BRC-20s through various apps such as Magic Eden, Atlas 3, Ordinals Wallet, UniSat, BeFi Labs, Matrica Labs, Ordiswap, Hello, and Gamma. Solana's low cost and high-speed network attracts users due to its low cost and high-speed network. PayPal recently expanded its stablecoin, PYUSD, to the Solana ( CRYPTOCAP:SOL ) network, marking a significant leap in expansion for the online payment platform.
The Phantom Wallet offers comprehensive crypto management, including recursive inscriptions and ledger compatibility. Users can securely manage their Bitcoin, Ordinals, and BRC-20s in one account through the mobile app and browser extension. The Collectibles tab allows users to discover and manage rare sats, check total sat amounts, and view "satributes" for each UTXO. Additionally, Phantom offers simple address management, enabling Native Segwit, Taproot, or both.
This comeback simplifies the process of transferring and buying Bitcoin instantly, offering a comprehensive and streamlined experience for all crypto needs.
Solana ( CRYPTOCAP:SOL ) has manage to regain the $170 pivot again validating its position as the third to Ethereum ( CRYPTOCAP:ETH ). The Altcoin has a Relative Strength Index (RSI) of 55.62 which is primed for a trend reversal. In the short term, Solana's ( CRYPTOCAP:SOL ) daily price chart shows a rising trend pattern from an initial falling wedge pattern.

SOL longSolana bounced off the ascending trendline and the support level. The bullish movement to 201$ is expected to happen.

$SOL break down the trend line#sol #solana price needs to reclaim the trend line zone, therefore #solusd will perform a bearish retest. Unsuccesful retest will likely bring a dump or reclaiming the zone will invalidate.

Calm before the storm!Solana, after forming a false breakout, is currently trading in a ranging pattern. This indicates a period of consolidation and indecision in the market.
Given this situation, it seems that Solana is experiencing the calm before the storm. This consolidation phase might serve as a preparatory stage for a strong upward or downward movement.

PayPal USD (PYUSD) Goes Live On SolanaPayPal USD ( SEED_DONKEYDAN_MARKET_CAP:PYUSD ) has gone live on the Solana blockchain, marking a significant expansion beyond the Ethereum ecosystem. This collaboration between PayPal and Solana ( CRYPTOCAP:SOL ) offers millions of users guaranteed access to the token with guaranteed speed. The integration allows PayPal to leverage Solana ( CRYPTOCAP:SOL ) and the token extension to serve over 30 million merchants globally while offering transactions at a lower cost. This marks a milestone for USD-pegged stablecoin as it is its first move beyond the Ethereum ecosystem.
PYUSD is also expanding its utilization as a payment method for small and daily purchases. PayPal USD has found new ways to evolve in a bid to compete with dominant alternatives like Tether ( CRYPTOCAP:USDT ) and USD Coin ( CRYPTOCAP:USDC ). Xoom, PayPal's cross-border money transfer service, recently launched a new funding option that allows U.S. users to finance international transfers using PYUSD. Users are exempt from paying transaction fees when using PayPal USD to fund eligible transfers to recipients in over 160 countries.
Solana's speed and low cost may impact the PYUSD market outlook positively. Over time, Solana ( CRYPTOCAP:SOL ) known to process over 5,000 transactions per second, costing only about $0.0025. Compared to Ethereum's 15 transactions per second with higher fees, Solana offers significantly cheaper fees. PayPal's senior vice president of blockchain, Jose Fernandez da Ponte, stated that making PYUSD available on the Solana Blockchain furthers their mission of enabling a digital currency with a stable value designed for commerce and payments.
Despite the fundamental, Solana ( CRYPTOCAP:SOL ) is still trading with a weak Relative Strength Index (RSI) of 54.89 signifying a bullish reversal trend in the long term.

$TOTAL 2 chart is weakening?#TOTAL2 Total Marketcap of #altcoins incl. #eth #sol #bnb #xrp and all #altcoin market cap index has severe weaknesses such as bearish diamond pattern (diamond sends backs the price where it pumped from) and bearish RSI divergence in LTF.
Invalidation: #totalmarketcap 2 , reclaims ~ 1.25 Trillion #usd zone with weekly close.
Not financial advice.

SOL: Pullback in UptrendTrade setup : Price is in an Uptrend. Pullback near $160 support and long-term up trendline ($143) could be an attractive swing trend entry in Uptrend, with +25% upside to $200. Stop Loss (SL) level at $140.
Pattern : Pullback in Uptrend . Price remains in an Uptrend but has pulled back, which could present a 'buying dip' opportunity. Traders should look for the nearest support level where price could stabilize and resume its Uptrend. This support level could be a level where price bounced off of in the past, or a level that was previously resistance. (concept known as polarity).Learn to trade key levels in Lesson 3.
Trend : Short-term trend is Strong Up, Medium-term trend is Strong Up and Long-term trend is Strong Up.
Momentum : Price is neither overbought nor oversold currently, based on RSI-14 levels (RSI > 30 and RSI < 70).
Support and Resistance : Nearest Support Zone is $160.00, then $125.00. Nearest Resistance Zone is $200.00.

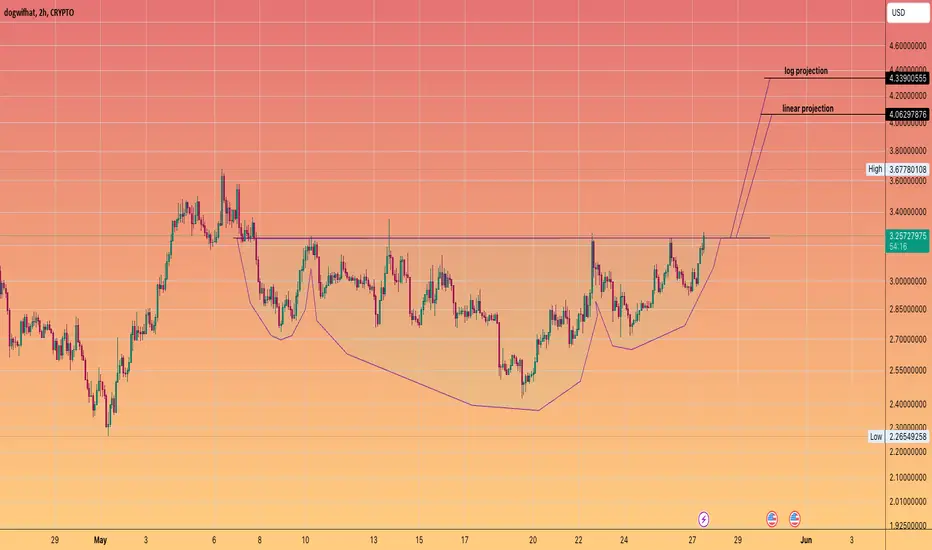
DOGWIFHAT #WIF NEAR TERM is TARGETTING $4.06-$4.33Per a inverse head and shoulders pattern that CRYPTOCAP:WIF is just now challenging the neckline.
Overall the structure that WIF has laid down these past few months suggests a wonderful surge in prices that could see WIF getting close to the $10 zone
#Memecoins are so powerful and make up a huge portion of the crypto sector.
It is safer to allocate to the new and LARGE coins
that have deep liquidity and bug 24 h volume
that the brand new coins which most retail gamble on and and end up walking away with nothing buy sob stories.