JTO longJito bounced off the support level and the ascending trendline. The bullish movement to the resistance level at $4.9 is expected to happen
SOL

PENG looks ready for the next leg up! A successful escape from the demand zone (green box) with increasing volume, and sticking to the fib levels, we could see this shit test the supply zone (red box) in the next few days.
The penguin theme meta is booming on Solana, and PENG is especially prepared for this since it's available to be traded on centralized exchanges.
DISCLAIMER:
The information and publications are not meant to be, and do not constitute, financial, investment, trading, or other types of advice or recommendations supplied by MysticMads. This is for educational purposes only.

Solana - Why You NEED THIS Indicator📢COINBASE:SOLUSD
SOL is flashing some bullish signs on the indicator and it seems that we're gearing up for another move towards the upside. This is the indicator that I used to call the new BTC bullish cycle in November last year, as seen below:
In 3 short minutes, we'll discuss the functionality of this technical indicator and why it's really helpful when monitoring the market.
Make sure you don't miss my most recent update on BTC, and why I say another ATH is imminent:
____________________________

$SOL Long - King-Maker this CycleIf you have been following me, you know I have been tracking CRYPTOCAP:SOL since $8
CRYPTOCAP:SOL does everything CRYPTOCAP:ETH does, except at instantaneous speed and 0 transaction fees ( CRYPTOCAP:ETH takes 10 seconds+ and costs $10+ each transaction).
I have been following this CRYPTOCAP:ETH fractal since $8 on CRYPTOCAP:SOL (see prior posts).
We are in a clear up-trend.
Up-Trends are your FRIEND in bull markets.
Do not make this more difficult than it needs to be.
CRYPTOCAP:SOL is going SO much higher.
NFA GL HF.
-@CryptoCurb

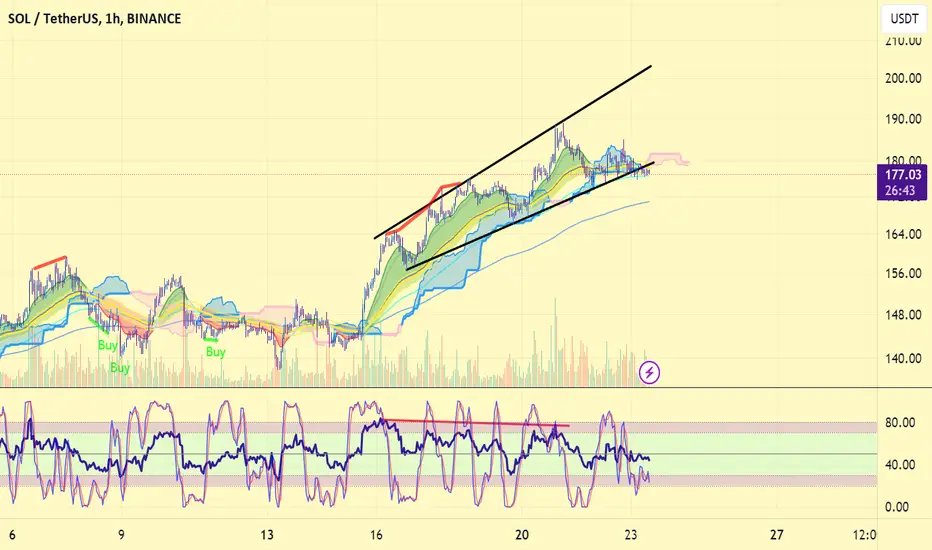
Testing the upward trendlineSolana is currently testing its upward trendline on the daily timeframe. If the price stabilizes above this line, it can be expected to move towards the next resistance level. It is noteworthy that confirmation of the upward trendline breakout and higher trading volume can serve as stronger indicators for continued upward movement.

SOL/USDT Secondary trend (part). Triangle. 1 10 2023Logarithm. Time frame of 3 days. Secondary trend (part). A very clear ascending triangle has been formed. The price is being driven to its resistance at the moment. There may be a pullback from it, and then we will see. While the price is in the triangle (until the decoupling), it is hardly rational to open a position from the position of risk management. The reversal zones are shown on the chart. Percentages of formation targets are similarly shown as most traders see them. To “take profit” you should always take less than “expected” by the majority.
Line chart.
Major trend. Time frame 1 week.
SOL/USD Main trend. Cycles.
Risk management XXX. .
It is extremely important, on such HYIPs, over pumped (“bottom” is not even shown on the price chart, not fair competition, fund prices) to observe risk management. Take profit long/short and forget it. Work in parts of the position. Limit potential losses, protect profits if price moves according to your plan. Don't catch lows and highs, it's not necessary.

Solana's Phantom Wallet Spike in Popularity, Surpasses Facebook Solana's Phantom Wallet, a popular app for accessing Solana's web3 ecosystem, has surpassed Facebook and ChatGPT in the Google Play Store's U.S. rankings. Currently ranked #11 behind Cash App and Snapchat in the free download category, it saw an estimated 770,000 downloads in April. Phantom Wallet, originally designed to hold only Solana ( CRYPTOCAP:SOL ) tokens, has since expanded to support Bitcoin, Ethereum, and Polygon.
It also secured the third position in the Apple App Store's utility category, just behind Google and Google Chrome. In April, it reported over 7 million active monthly users, a sign of growing adoption. The token was trading just above $168, marking a modest 1.35% increase in the last 24 hours and a 16.9% jump over 30 days.
Technical Outlook
Solana ( CRYPTOCAP:SOL ) is down by 0.26% trading with a Relative Strength Index (RSI) of 54.48 which is poised for a trend reversal. Despite the token sale from FTX, Solana was able to retain the $160 support level.

ALTCOINS that are STRONG Right Now🚀Yesterday we took a look at altcoins that are not doing great - today we'll list a few alts tat are performing well and still have further upside potential.
👍 TRBUSDT
👍SOLUSDT
If Solana can CLOSE above $150, it is highly likely that the Elliot Wave theory is still in place:
👍 RUNEUSDT
👍 BNBUSDT
BNB is looking strong, it's likely we'll see a new ATH soon:
👍 FRONTUSDT
_____________
BINANCE:DOGEUSDT BINANCE:RUNEUSDT BINANCE:TRBUSDT BINANCE:SOLUSDT BINANCE:BNBUSDT BINANCE:FRONTUSDT.P

SOL/USDT planning bullish reversal from key support? What Next💎 Paradisers, get ready for a thrilling opportunity with #SOLUSDT as it displays signs of a potential bullish reversal from its support level.
💎 In the past, we've observed #Solana rebounding from support only to be halted by a strong rejection at the $159.64 supply level. Currently, the price is once again nearing the key support at $123.12, following an ascending support line. If it successfully reclaims this level and maintains momentum, there's a high chance it will embark on a bullish journey towards the robust resistance level of $204.64.
💎 As savvy traders, we must explore all possibilities. If the price of CRYPTOCAP:SOL fails to sustain its momentum at this key support and drops below, we anticipate a possible bullish rebound from the lower demand level at $105.92. This level has shown resilience thanks to significant liquidity, having previously upheld this demand zone. However, breaking below this level could lead to a substantial downward movement.
MyCryptoParadise
iFeel the success🌴

SOL Down 4% As FTX Bankruptcy Estate Concludes Solana Token SaleFTX's bankruptcy estate has completed the sale of $2.6 billion worth of Solana ( CRYPTOCAP:SOL ) tokens at significant discounts. Figure Markets and Pantera Capital were among the latest buyers, acquiring a block of 800,000 tokens for approximately $80 million, equating to about $102 per token. Solana ( CRYPTOCAP:SOL ) is down 3.3% on the day. Pantera Capital also participated in the auction, although the specific price paid remains undisclosed. Both the FTX estate and the involved firms did not immediately comment on the transactions.
The liquidation of Solana ( CRYPTOCAP:SOL ) tokens has been a contentious issue in the FTX bankruptcy proceedings. While FTX creditors will receive full repayment plus interest, they will not regain their crypto assets, potentially missing out on future market gains. Earlier in May, FTX announced that the estate would have up to $16.3 billion to distribute, while it owes approximately $11 billion to over two million customers and other creditors. Pantera Capital aimed to raise $250 million to purchase Solana tokens from FTX in March, winning a batch of discounted tokens in April.
Due to the token sale campaign, Solana ( CRYPTOCAP:SOL ) is down 4.54% at $168.14 with the Relative Strength Index (RSI) and the Moving Average Convergence Divergence (MACD) showing impending bearish trend coming up.

Solana Technical Analysis: Key Insights and Strategies 📉Current Market Position:
Solana (SOL) has been in a parabolic movement but is currently losing momentum. If the weekly candle closes as it is now, there's a potential for breaking the curved trendline.
Key Support and Resistance Levels:
Critical Support at $100: If Bitcoin continues to drop and the market remains bearish for the next three months, SOL might reach this level.
Immediate Support: Set a stop loss below $136. If this support breaks but turns out to be a false breakout, consider re-entering.
Buying Strategies:
Long-Term Hold:
Buy after a breakout and stabilization above $205.
Alternatively, wait for a reaction at the $100 support level before making a purchase.
Recommendations for Holders:
Stop Loss: Activate your stop loss below $136.
Re-Entry Strategy: If the support break is false, re-buy SOL.
Watch for Bitcoin's Movement: Solana's next significant move might depend on Bitcoin's performance.
👍 If you found this analysis helpful, feel free to like, comment, or share! For more insights, follow #Tradecitypro and #TCP 🚀#sol #solana
🔖 Categories: Technical Analysis, Risk Management, Long-Term Investment
📌 Stay tuned for further updates as the market evolves, and happy trading!

$SOL price will decide #sol #solana chart has formed ascending megaphone channel for days. A tiny deviation is occuring, but with today's news will bring #solusd price to 200$ (top of the channel) or cause a dump. Not financial advice.
SOL Solana Invest Or Trade - Technical Analysis and Trade IdeaIn this video we cover two SOL (Solana) options, an entry point if you are looking to dollar cost average in as an investor, and a scalping and or intraday trade idea if you are looking to trade this. As always the video covers my trade entry points my opinion in terms of the trend, market structure and price action, and as always this information is educational in nature and not to be construed as financial advice.

SOL Price DynamicsThe price of Solana, after attracting funds from a strong support level, started a significant upward trend. This upward movement included a retest of the support level, confirming its strength. After this retest, the price continued to rise towards higher resistance levels.

Potential bullish rise?SOL/USD has just bounced off the support level which is an overlap support and could rise from this level to our take profit.
Entry: 174.98
Why we like it:
There is an overlap support level.
Stop loss: 167.65
Why we like it:
There is a pullback support level which aligns with the 38.2% Fibonacci retracement.
Take profit: 188.92
Why we like it:
There is a pullback resistance.
Please be advised that the information presented on TradingView is provided to Vantage (‘Vantage Global Limited’, ‘we’) by a third-party provider (‘Everest Fortune Group’). Please be reminded that you are solely responsible for the trading decisions on your account. There is a very high degree of risk involved in trading. Any information and/or content is intended entirely for research, educational and informational purposes only and does not constitute investment or consultation advice or investment strategy. The information is not tailored to the investment needs of any specific person and therefore does not involve a consideration of any of the investment objectives, financial situation or needs of any viewer that may receive it. Kindly also note that past performance is not a reliable indicator of future results. Actual results may differ materially from those anticipated in forward-looking or past performance statements. We assume no liability as to the accuracy or completeness of any of the information and/or content provided herein and the Company cannot be held responsible for any omission, mistake nor for any loss or damage including without limitation to any loss of profit which may arise from reliance on any information supplied by Everest Fortune Group.

SOL : go to big price📊Analysis by AhmadArz:
🔍Entry: 165.66 - 159.85
🛑Stop Loss: 153.05
🎯Take Profit: 173.94 - 184.54 - 194.83 - 203.74
🔗"Uncover new opportunities in the world of cryptocurrencies with AhmadArz.
💡Join us on TradingView and expand your investment knowledge with our five years of experience in financial markets."
🚀Please boost and💬 comment to share your thoughts with us!

BULLISH FLIP SOLANA- BUY SIGNAL Let if Fly,🚀 Big week for #Solana!
flipped bullish at $153.
Get ready!
BUY SIGNAL

Solana summer is on the horizon Solana price action is looking very similar to the previous months before it ran to new highs. I think solana summer is approaching very quickly.
COINBASE:SOLUSD

🔥Top-3 Altcoins You Would Never Find: My Portfolio x10🚀🔥 Altcoins can bring you much more profit then Bitcoin if you understand which altcoins to pick and how to do it properly. That's what this video is about. Enjoy!
Of course, this strategy works for altcoins only at Bitcoin bull market. We will discuss how to identify it in the next video ideas. Subscribe!
🎁 Check my trading ideas for the altcoins that are still at the bottom!
like❤️ and follow

Solana Price Spikes With Analyst Sighting $200 As Next PivotSolana's price surge to $173 has sparked optimism among investors, with experts hinting at a potential rise to $200. The surge is driven by positive sentiment and upcoming upgrades, such as the Frankendancer upgrade. Syncracy Capital's co-founder Daniel Cheung expressed confidence in Solana's strength, highlighting its potential to reclaim $200. He also highlighted the potential for Solana ( CRYPTOCAP:SOL ) to reach $200 by the end of the month, a significant reversal in the monthly timeframe and readiness for new highs.
As anticipation builds, Solana ( CRYPTOCAP:SOL ) remains a key focal point in the cryptocurrency market, with prominent players in the digital asset space attracted for its potential to reach new highs. BitMEX co-founder Arthur Hayes shared the Solana ( CRYPTOCAP:SOL ) price chart and advocated for accumulating the crypto in a blog post from early May.
As of writing, Solana's price soared 3.01% to hit $173.25, after reaching a 24-hour high of $174.16. Despite the rally, its trading volume fell 25% to $2.71 billion, and the Solana Futures Open Interest soared 4.91% to $2.32 billion, suggesting a bullish sentiment in the market.
The asset has a Relative Strength Index (RSI) of 63.97 which is moderately overbought.

Alikze »» AVAX | Ready to break the necklineIn time 2W, after a complete upward cycle up to $147, it made a complex double structural correction, which corrected more than 50% of the previous wave. Currently, it is located in the important resistance area and the neck line, with its failure, it will have the ability to reach the ceiling before and after that, the first target of $515. Therefore, we can wait for the failure of the important area to continue the upward path of this currency, which, according to the momentum, will have the ability to break the specified range.
»»»«««»»»«««»»»«««
Please support this idea with a LIKE and COMMENT if you find it useful and Click "Follow" on our profile if you'd like these trade ideas delivered straight to your email in the future.
Thanks for your continued support.
Sincerely.❤️
»»»«««»»»«««»»»«««

📉📈 SOL Trade Analysis 🔄💼Current Market Context:
The market is experiencing a significant upward movement, and SOL is positioned well within a favorable buy zone.
Trade Strategy:
Entry: Initiate a trade at the break of the top of the range support level at $170.00. This level is a key indicator of potential bullish momentum.
Take Profit: Set take profit targets within the $200 - $220 range, and identify the next area of resistance at $240 - $260 for extended gains.
Stop Loss: Place the stop loss just below $158 to manage risk and protect against potential downturns.
📊🔍 Monitor SOL's price action closely to validate the trade and adjust as necessary! #SOLTrading #CryptoAnalysis 🌐🔒

Long SolanaTraders,
As you know, I have restarted my signals subscription. My followers and I have done very well since the restart. But I don't want to forget about all of my TV followers. So, from time to time I do not mind throwing out a freebie.
Here's my case for going long Solana here to $300.
#1 - As indicated in the weekend video update, there are multiple indications that our pullback in the U.S. stock market is over for now. Blow-off top to continue.
#2 - Bitcoin will not be held down.
And as it pertains to our Solana chart:
#3 - Solana has hit .618 fib fan retracement
#4 - Double bottom held.
#5 - Back above the 100 day SMA
#6 - RSI downtrend broke
#7 - Green RSI support held
#8 - Hidden Bullish Divergence on RSI
#9 - Awesome Oscillator on the rise!
My target will be 2x the current price (so, $300) for a rrr of 3.25.
This will be a longer-term swing. It may take a month. It may take the rest of the summer. Unknown.
