Sell Bitcoin and buy Altcoins!🚨 Controversial Take Ahead – Packed With High-Value Insights 🚨
Let’s dive deep.
👨💻 A bit about me:
I’ve been riding the tech wave since the beginning:
Programmed video games in the 80s and 90s
Built VSTi plugins in the early 2000s
Started creating websites when Internet Explorer 1.0 launched
Sold 3D assets when Unity 2.5 (first PC version) dropped
Launched my own blockchain in 2016
Deployed smart contracts on TRON in 2018
I don’t follow trends—I predict them. My instincts are backed by decades of hands-on experience.
Now, here’s what I see coming:
⚠️ 1. Sell Your Bitcoins
Yes, Bitcoin is obsolete. It’s a technology—not a precious metal—and like all tech, it must evolve or die.
Ask yourself:
Do you use a Blackberry today?
Still flying in 1930s planes?
Gaming on an Atari or Commodore 64?
Surfing the web with Lycos or Altavista?
No? Then why are you betting on a 2009 technology?
Most people don’t even understand how Bitcoin works—ask around what SHA256 or RSA means.
Crypto is misunderstood, and that’s dangerous.
Back in 1998, I created the UPL library, which handled data compression & encryption using all major algorithms—Huffman, LZSS, DES, RSA, etc. I’m not just throwing words around—I’ve built this stuff.
Politicians and financial institutions (yes, even Saylor) are 15 years late to Bitcoin. They're missing the truth: BTC’s upgrades failed (Ordinals, Runes, etc). Its value holds due to FOMO from the uninformed, not innovation.
One day, your Bitcoins will be as worthless as mp3.com stock. That’s not opinion—that’s technological reality.
🪙 2. Buy Altcoins
Not every altcoin is a winner—but that’s where the real opportunity is.
Remember:
Nokia and Blackberry ruled before Samsung and Xiaomi.
The next Amazon, Google, or Nvidia already exists—and it's trading for pennies.
When people laugh at altcoins, that’s the time to buy low.
Altcoins like CRYPTOCAP:SOL , CRYPTOCAP:SUI , MIL:UNI could 100x… even 100,000x.
Bitcoin might double—and then crash.
Smart traders buy when everyone else is mocking.
🌍 3. Consequences of the BTC Collapse
This collapse will come at a turning point in global power.
Wall Street and U.S. states are heavily exposed to BTC. If it crashes, the Western financial system could implode—a dot-com-level disaster.
China, on the other hand, is stable, adaptive, and tech-forward.
Crypto without staking, DeFi, NFTs, GameFi, smart contracts? That’s not the future—that’s Bitcoin. Altcoins are the future.
Bookmark this post. Re-read it in 10 years.
You’ll remember I said it first: Innovation is unstoppable.
Enjoy the last Bitcoin pump. Then watch what comes next.
DYOR.
#CryptoRevolution #AltcoinSeason #BitcoinCollapse #Web3Future #BlockchainInnovation #SellBitcoin #BuyAltcoins #CryptoTruth #DeFi #GameFi #SmartContracts #CryptoShift #UnstoppableInnovation
SOL
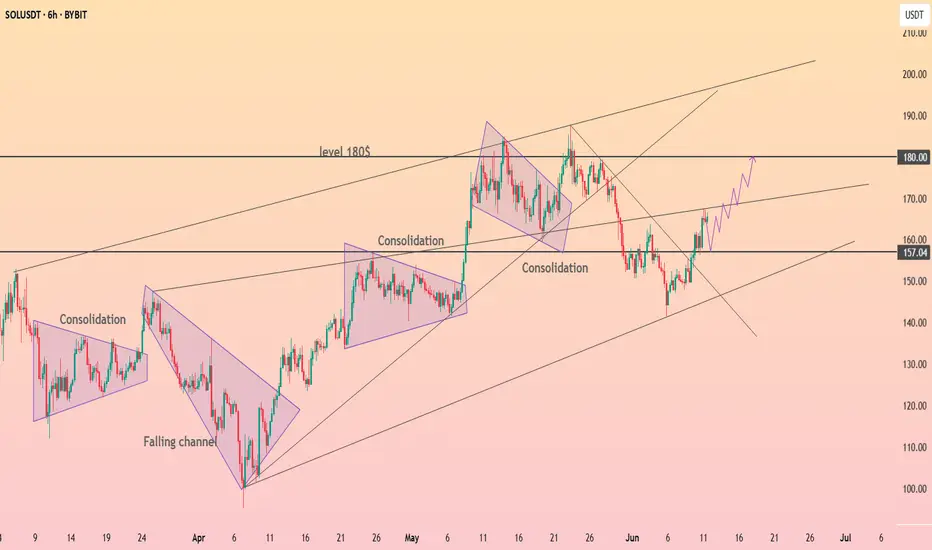
HolderStat┆SOLUSD exit from the formationBINANCE:SOLUSDT
→ Bounce off 150 trend-line fuels channel grind
↳ Reclaim 163–165 then pierce 180 cup-rim
⇢ Targets 190–195 upper rail, even 205+
⤴ Slip < 157 reroutes to 150 demand, < 148 turns bearish
SOL 1D. Price Action Suggests a Bullish Move. 12/06/25BINANCE:SOLUSDT
The current price action looks bullish, and it's likely we’ll see a push toward the $170–$180 range without major pullbacks. I’ve outlined a potential path on the chart reflecting short-term expectations.
However, if the broader market experiences a correction, there's no reason we couldn't see a retracement to the 0.5–0.618 Fibonacci levels. For that reason, it's wise to have limit orders set just in case.
Entry Points (EP):
• Market
• $140.25
• $123.41
Take Profit (TP):
• $175.28
• $183.42
• $208.90
⚠️ This is not financial advice. Just my personal outlook based on current structure.
Please do your own research and remember: your decisions are your responsibility.
Stick to your risk management plan, and never risk more than 2% of your portfolio per trade.
Wishing everyone green candles and solid gains!
DYOR.

Solana's Retrace Isn't Over, Lower HighSolana's retrace is not over, some weakness is showing up on the chart. Here we have a strong lower high on the daily timeframe coupled with very low trading volume. Low trading volume at this point signals that buyers are just not present. When no new buyers are present, the market will continue in the same trend. The trend is the drop that started 19-Jan, confirmed 23-May with a lower high. Today, a local lower high points to even lower prices.
Once the retrace is over, we can expect a new wave of growth; for now, we have to step back and watch (SHORT) until a new support level forms. When support is in, we can again buy (go LONG).
Sell at resistance, buy at support.
Adapt live to market conditions.
Thanks a lot for your continued support.
Choose wisely. Be smart.
Namaste.

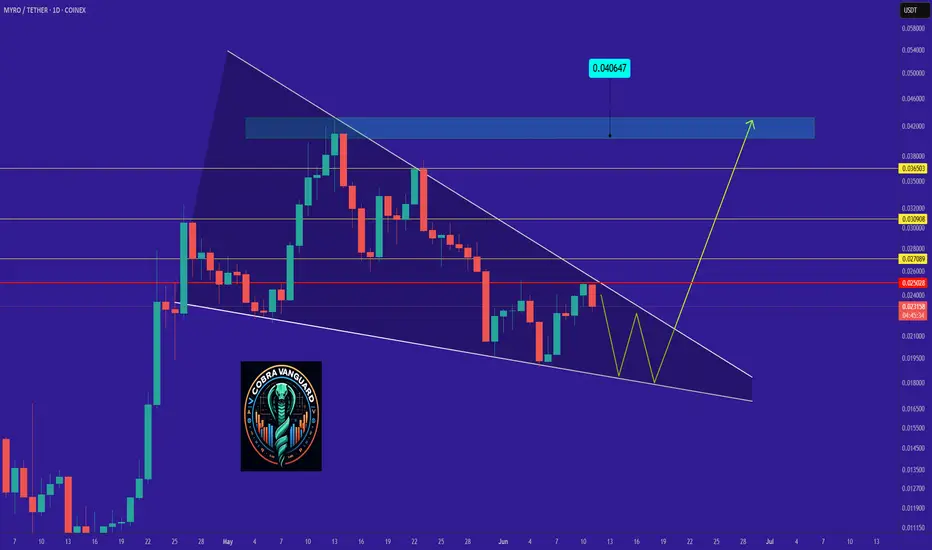
myro road map (Daily)The MYROUSDT chart shows a falling wedge pattern, approaching a resistance level at 0.025. A breakout above this level could confirm the next bullish target, but watch out for a potential reversal!
Best regards CobraVanguard.💚
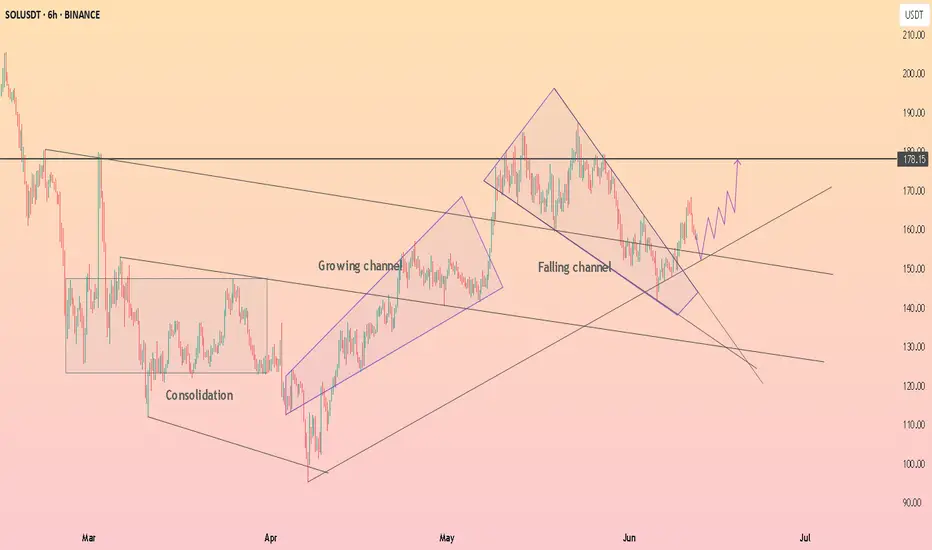
HolderStat┆SOLUSD reached resistance lineCRYPTOCAP:SOL just flipped the 157 pivot into support after escaping a falling channel and retesting the up-trend. Holding here fuels a run toward the 170 trend-cap and 180 supply shelf; failure invites 150 again. Growing channel, consolidation clusters, breakout watch.
Is Bitcoin Ready to Launch? In-Depth Analysis of BTC, ETH, XRP, Hello everyone, I hope you're doing well.
Due to time constraints, I won't be analyzing each asset individually. Instead, I’ll provide a collective technical overview in this post.
This analysis includes the following cryptocurrencies: **Bitcoin, Ethereum, Ripple, Solana, Sui, and Chainlink**.
⚠️ **Please note:** On the **daily timeframe**, most of these assets are forming different patterns. However, the **weekly timeframe** provides a clearer and more reliable outlook.
---
### 🔍 **Technical Overview:**
📌 **Bitcoin (BTC)**
Currently forming a **"V" pattern**.
If BTC closes **above \$110,500 on the weekly timeframe**, the first target is **\$131,500**, and the second target is **\$165,000**.
📌 **Ethereum (ETH)**
Also in a **"V" pattern**.
If ETH closes **above \$2,833 on the weekly timeframe**, the first target is **\$4,200**.
📌 **Ripple (XRP)**
Forming a **bullish flag** pattern.
If XRP closes **above \$2.65 on the weekly timeframe**, the first target is **\$4.22**.
📌 **Solana (SOL)**
Forming a **"V" pattern**.
If SOL closes **above \$190 weekly**, the first target is **\$282**.
📌 **Sui (SUI)**
Also forming a **"V" pattern**.
If SUI closes **above \$4.26 weekly**, the first target is **\$6.97**.
📌 **Chainlink (LINK)**
Needs a **weekly close above \$18** to confirm breakout.
First target: **\$25**.
---
### 🧠 **Brief Fundamental Insights:**
* **Bitcoin** is being heavily accumulated by institutional investors and whales. On-chain metrics suggest we are **not at a cycle top**, and the ongoing **supply shock** and **massive exchange outflows** are strong bullish signs.
* **Ethereum** is under **strong accumulation** from both retail and institutional investors, as confirmed by recent **CoinShares reports**.
* **Ripple** is awaiting resolution of its ongoing lawsuit with the **SEC**.
* **Sui** is consistently rolling out updates and shows **unstoppable DeFi ecosystem growth**, giving it strong fundamental support.
* **Solana** is being accumulated by institutional players, including **SOL-specific strategies** and funds.
* **Chainlink** is seeing buying pressure supported by **positive news and strategic partnerships**, some of which are from **anonymous large players**.
---
🧠 Updated Fundamental Analysis (June 2025)
Bitcoin (BTC)
New Investment Record: In May, total investments in crypto funds reached $167 billion, with Bitcoin accounting for $5.5 billion, signaling strong institutional demand.
Institutional Buying Surge: ETF purchases, entries by institutions like Paris Saint Germain, and even countries like Pakistan have contributed to declining exchange reserves of Bitcoin.
Favorable Macro Conditions: Rising bond yields, stock market volatility, and a weakening U.S. dollar have made Bitcoin more attractive as a hedge asset.
Ethereum (ETH)
Consistent Inflows: Ethereum funds have seen seven consecutive weeks of capital inflows, with nearly $296 million added in the past week alone.
Institutional Confidence: Assets under management (AUM) in ETH funds have reached approximately $14 billion, indicating strong long-term faith by institutions.
Solana (SOL)
Strong Institutional Demand: Firms like Société Générale and Siebert Financial have recently invested in Solana.
On the Verge of ETF Approval: Franklin Templeton filed for a spot Solana ETF back in February, potentially boosting demand.
Whale & DeFi Growth: Increased whale activity, growing DeFi ecosystem, and rising developer engagement hint at a potential price rally to $200 and beyond.
Ripple (XRP)
While there is no major new fundamental data recently, the listing of XRP futures on CME and broader access for institutional investors may have a positive impact.
The ongoing legal case with the SEC remains a crucial factor in XRP’s future outlook.
Sui (SUI)
DeFi Expansion: Active daily users have grown by over 14%, and decentralized exchange volume has reached around $34 million per day.
TVL Growth: Suilend’s Total Value Locked (TVL) has hit $700 million, ranking 8th among all blockchains.
Institutional Attention: There are reports suggesting that an ETF for SUI may be under consideration, with on-chain utility continuing to expand.
Chainlink (LINK)
Collaboration with Major Financial Institutions: Chainlink is participating in CBDC pilots between Hong Kong and Australia, working with Visa, ANZ, and the Hong Kong Monetary Authority.
Ecosystem Growth: Development is supported via grants, like the $150K funding provided to Lightchain AI, strengthening Chainlink’s infrastructure.
Strategic Partnerships: Collaborations with JPMorgan, Ondo Finance, and Swift highlight Chainlink’s growing influence in connecting real-world data to blockchains.

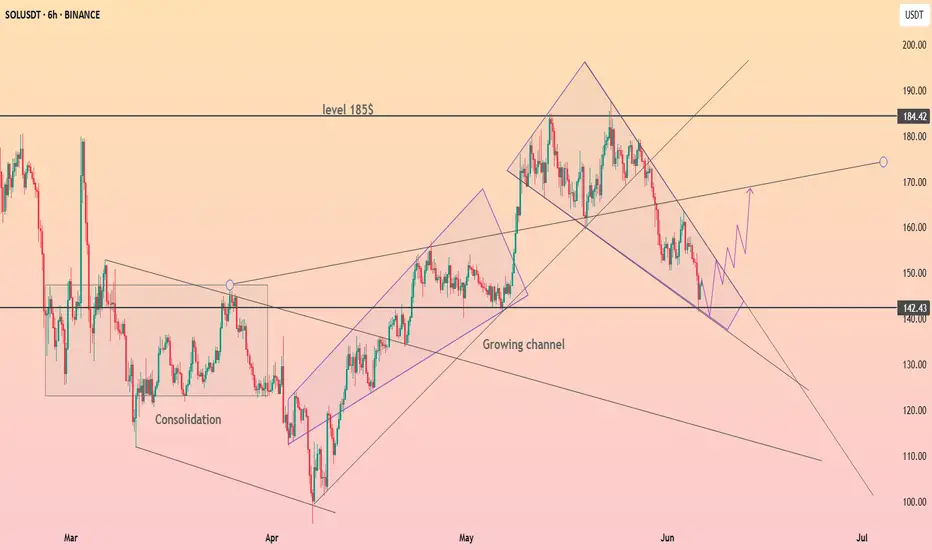
HolderStat┆SOLUSD rebound from 142CRYPTOCAP:SOL just kissed 142 support at the base of its growing channel. Solana price slips from a descending wedge, and holding above trend could propel bids toward 155, then the 170-184 supply band; lose the line and 125 beckons.
Solana >>> all trendlines are brokenHello guys!
As you can see, all of the trendline is broken, and after forming a double top in Solana, we can see a bearish trend is running!
I believe this downward movement will continue until the price touches the mentioned area!
The pointed area is the target level!
And the blue area has its own potential for getting long!

Solana Bullish, Retrace Over! Aim For $620 or $1,020 In this 2025 Cryptocurrency bull market, you should be aiming for $620 or $1,020 for Solana, $420 is the minimum.
How are you feeling today my dear friend?
I hope you are having a wonderful day.
Retraces and corrections, they can only last so long.
Solana dropped from $188 to $141 and I believe this is enough, a 24% drop (-24%).
As the retrace ends, the chart will produce a higher low and, as the higher low becomes confirmed, SOLUSDT starts a new wave of growth.
$420 is the minimum target for this bullish wave and should hit first but, you should aim higher, much higher. Crypto is showing to be many times stronger than what most people think.
Remember, the mistake we always make is not aiming too high but aiming too low. In each bull market, we tend to underestimate the market. Aim high, because we are going up.
Retraces and corrections are an opportunity to buy-in, 2nd entries, rebuy and reload.
Don't try to SHORT within a bull market, it is dangerous and not worth the risk. It is better to wait for support and go LONG. Always trade with the trend, specially if you are using leverage. Crypto is going up. Solana will now turn green.
Thank you for reading.
Namaste.

Solana Short-Term, Already Bearish After 97% UpWhat will happen in the long-term? Before we get there, let's focus on the short-term real quick because we want to know what is happening with the market now.
The market offers endless opportunities. We need to take advantage of those, our edge. We have an edge and this edge is being able to read the chart. With this edge, we can time the market and increase our trading success.
Solana grew by 97%. This is good. Of course, some pairs grew way more while others grew less. I did mentioned that when Bitcoin grows 50%, some Altcoins can grow 300%. This is exactly what happened, this is because of the size of the projects.
Some pairs grew more but these were smaller pairs. Some pairs grew less but these were bigger. That's just the nature of things.
This 97% bu-wave can be correlated to a 300-400% bullish-wave on other pairs. This means that after a growth wave comes a correction.
SOLUSDT—two main interesting levels. Won't mention them as they are shown on the chart.
Both are likely to hit but the first high is really high probability.
This is easy. Wait for support before buying again. I say "again" because you are supposed to sell at resistance, we are assuming you sold at resistance and are ready to buy at support.
Good? We are good.
The market will continue to move down and up while long-term it produces sustained growth.
We need to adapt fast and be smart, everything can change in a day.
Keep an eye on the news, we might be in front of some major event.
Political events can change everything and cannot be predicted.
Thank you for reading.
Namaste.

Will Solana Go Lower? Yes! Only To Recover HigherI've been asked: Will Solana continue lower?
I think it is a fair question but it is also pretty hard right now to say based on the chart, there are just too many mixed signals.
For example, if we take Solana in relation to Bitcoin, it is trading daily below EMA55 and MA200, while Bitcoin is trading daily above these levels. Bitcoin hit recently a new all-time high while Solana only produced a small recovery in May.
When it comes to the chart signals, SOLUSDT produced a volume breakout on the bearish side and the support zone was completely challenged on a single candle. What's more, Solana will grow really strong later this year, so it would be normal to see as much bearish action as possible now because later we will have sustained long-term growth.
It is a coin flip, but if you ask me, it can go a bit lower before moving up. It can go lower to end up producing a higher low.
I will wait for clear reversal signals before going LONG.
I closed all my LONGs a while back, when it became clear that the market was going into correction. Now we can just wait easily and patiently until the correction unravels, after the correction comes a new wave of growth. Down and up, down and up... The market continues to cycle. Never straight down, never straight up. It moves in waves.
Namaste.

HolderStat┆SOLUSD rebound from supportCRYPTOCAP:SOL revisits the 150 pivot inside a corrective wedge, yet April’s growing channel stays intact. Confluence of horizontal demand, wedge resistance and prior consolidation tips a comeback toward 175, then the 185 ceiling, as long as trendline cradle support endures.

Sol, setting!? or will it rise!
In our last Solana ( CRYPTOCAP:SOL ) update, we discussed the potential for a bounce and posed the critical question: would it be a retest or a reclaim? That distinction is now front and center as price action unfolds.
The 141 area remains the level bulls must defend. A clean reaction here, ideally with a supportive pattern, would create favorable conditions for upside continuation. However, if price returns above 169 , the current impulsive structure downward would be invalidated and a recount would be warranted, that could also be the end of the correction.
Zooming out, the bigger question is whether we are in the C wave of a flat correction. If that’s the case, then this impulse Should be the final move before a change in trend. Conversely, an impulse shouldn't be taken for granted nor lightly, I could set the stage for further down side. If a C wave, this pattern could set the stage for a powerful move after it completes.
In simpler terms:
If bulls hold 141 and reclaim momentum, the structure could shift bullish quickly.
If this is a flat, the C wave down is still unfolding, and we may need to endure one more leg lower before a true trend reversal.
Either way, patience is key. Let the chart print clarity.

Raoul Pal's Big Banana. $100 Trillion dollars Crypto market.And how on earth do we reach that point?
Is Raoul's thesis regarding the exponential age accurate, suggesting we have until 2030 to invest and reap the benefits; so "don't F@ck this up!"
As a charting enthusiast, I am eager to see if there exists a technical foundation that could allow us to teleport to those levels and estimate how many years it might take.
Let's examine the entire crypto market, which includes everything from stable coins to tangible real world assets like Gold.
We can distinctly identify three significant consolidation patterns.
Rising wedge #1
a sideways pennant
rising pennant #2
Now, considering this is a logarithmic chart.
It provides us with logarithmic amplitudes and projections.
An amplitude is a calculated move based on the boundaries of the consolidation pattern.
Essentially, it involves taking the top and bottom width and applying it to the breakout point for a rising pattern.
In a #HVF, we utilise the midline of the funnel to forecast targets.
The projections illustrated on this chart pertain to the sideways pennant, employing the flagpole to establish our target.
It is this sideways pennant pole projection that leads us to 100 trillion dollars and beyond. Test it out for yourself if you find it hard to believe these figures could become a reality :)
So there we have it; yes, 100 trillion dollars may appear excessively optimistic and fantastical, especially since we are currently at 3.28 trillion dollars.
However, the charts indicate that Crypto could indeed be the sector where the majority of financial transactions take place in the forthcoming exponential future.

Solana Still Bearish, Moving LowerI will alert you here when the bearish potential is completely nullified. Right now, Solana is still bearish. This applies to all other major projects that I shared recently but I will also update those.
The maker produced a rejection yesterday, 3-June, as a lower high. This implies a bearish continuation. The two levels mapped on the chart are the main support zone.
Since the first level is already being challenged, we can aim for the second one.
Once the correction is over, we will go bullish again.
Some of the smaller altcoins can grow while the rest of the market crashes down. Choose wisely. It will be hard right now.
Namaste.

HolderStat┆SOLUSD channel surferCRYPTOCAP:SOL exited a falling channel, built a clean growing channel and parked on 165 USDT support. Repetitive consolidation mid-way and a projected path to the 190 USDT level underscore continuing strength, with trendline confluence favoring upside continuation.

SOLANA It has good growth potential in midtermThe SOL will increase $150 and reach to the top of the wedge in the coming weeks .
Give me some energy !!
✨We spend hours finding potential opportunities and writing useful ideas, we would be happy if you support us.
Best regards CobraVanguard.💚

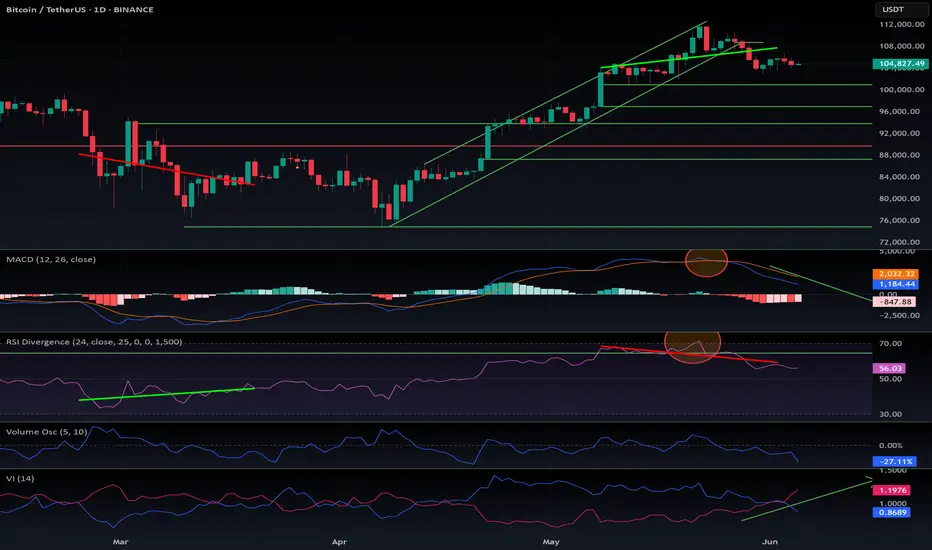
BTC (Post Weekly Close Update)CRYPTOCAP:BTC (Post Weekly Close Update)
We’ve confirmed a weekly SFP and observed a bearish engulfing weekly close, signaling caution at the very least. Whether the price corrects to our target, BOs here, or reaches a new ATH remains uncertain, so we’ll play it level by level. Imo, subtle signs of bullish exhaustion are worth noting.
That said, I don’t expect a collapse to 70K, though anything is possible. I anticipate a drop below the key 100K level, targeting the 18H HOB and weekly FVG around 98K. We could even see a wick into the CME gap, YO, and VRVP support observed at 94K. This move may spark fear, traders anticipating lower, with some calling for a bear market. However, I expect the price to reverse, reclaim key levels, and resume the uptrend.
On LTF/MTF - charts, we’re trading level by level. A range may form, allowing the market to gather liquidity to sustain the trend, especially since we missed liquidity at 72K. As long as the price remains below 107K, scalping makes more sense than swing trading in the short term. A break above 107K could target 110K or a new ATH. However, if the price reaches 107K - around 107800 - I’d consider shorting. A daily close above 107K might trap retail traders into opening longs, only for the price to retrace and head lower (keep this scenario in mind).
VELO data:
Market dynamics are stable. Spot is flat or selling, while perps are driving pric. OI has dropped from dangerous levels, and funding rates remain slightly positive. Overall, nothing significant is occurring, which aligns with the current range-bound market.

SOL - Another run?Look another run means another buy and buy looks dope only if it doesnt breaks the red box for whatsoever reasons!!

SOL Local Elliot Wave ii UnderwaySolana appears to have completed a motif wave 1 after finding a bottom at the major support high volume node (HVN) macro wave 4.
Wave 2 has not retraced as deep as other alt coins showing strength in the move up. The downside target is the HVN at $140 at the 0.5 Fibonacci Retracement.
Wave 3 should be a powerful move up taking price into all time high.
Failure to hold this support could see price heading back to fresh lows and testing the $90 HVN once more.
Safe trading

SOL - Is it good for buys?SOL really looks good at the multiple points mentioned, Looks good for longs at the point marked!!

Solana (SOL) Rectangle (4H)BINANCE:SOLUSDT appears to be forming a rectangle, clearly visible on the 4H chart.
Key Levels to Watch
• $160: Support
• $185: Resistance
Measured Targets
Activated, respectively, with a 4H close with good volume below support or above resistance.
• $135: Rectangle Short Target
• $210: Rectangle Long Target
