Price tapped the origin. Now we wait for the rest to catch up.Most of the market is reacting. I’m just tracking delivery.
SOLUSDC just printed a clean raid into the 1D OB — perfectly aligned with a HVN on the volume profile. It’s not a coincidence. It’s Smart Money reloading before the next distribution cycle.
The sell-side sweep into 150.7 tagged the 0.786 retracement and the top edge of a stacked STB/OB zone. That’s where I’m already building long exposure.
Price isn’t reversing because of “support.”
It’s reversing because the inefficiency from the rally has now been filled — the FVG is complete, and the reaction confirms it.
From here, my first draw is 171.198 — the EQ of a 1D OB and a known liquidity pool. If we displace through that with conviction, I expect full expansion toward the 184.8 high.
Execution logic:
🔑 Entry: 150.7–154 zone (1D OB + STB zone + 0.786 retrace)
🎯 First TP: 171.198
🛑 Invalidation: 141.4 break and close below (full POI invalidation)
🧠 Patience if we revisit 141 — that level may serve as the final sweep before a macro move higher
I don’t trade headlines. I trade imbalance and narrative.
Precision or nothing. This is why my trades don’t miss.
Solana

Bozo Benk – Road to Top 300
Bozo is a low-float, high-conviction breakout that’s showing all the early signs of a full-blown cycle runner. Right now, it’s flying under the radar — but that won’t last long.
coingecko: BozoBenk
Key Metrics:
Current Market Cap: $4.72M
Target Market Cap (Top 300 Range): ~$200M
Total Supply: 800M
Circulating Supply: ~400M (50% of tokens are locked)
If we hit a $200M market cap on just 400M circulating tokens, that gives a projected price of:
$200,000,000 / 400,000,000 = $0.50 per token
That's a 100x from here — and yes, that’s within striking distance in meme coin terms when a proper run begins.
Why This Isn’t Just “What If” Talk:
Low Float = High Velocity
With only 400M tokens in circulation, price impact per dollar is massive. When buyers show up, price moves fast — and that speed becomes the magnet.
Breakout Is Confirmed
After months of accumulation, Bozo just cleared its resistance zone. Volume spike. Momentum flip. Classic early-stage markup.
Reflexivity Effect
As price rises, more eyes come in. CT starts posting. Telegrams start firing signals. The crowd sees the move, and FOMO becomes self-fueling. This is how 10x becomes 50x.
Realistic Target Based on Ecosystem
$200M is not a moonshot. There are dozens of meme coins with less utility and worse structure sitting at or above that level. If capital rotates back into memes — and it always does — Bozo is positioned to ride that wave hard.
The Alpha:
This isn’t about “maybe” — it’s a perfect mix of low cap, reduced float, clean chart, and momentum fuel.
A $200M market cap on 400M circulating tokens = $0.50.
You're here at ~$0.005.
That’s the kind of asymmetry you don’t get often — and when it runs, there won't be time to chase.
Know what you hold. Trade it like you mean it.

Solana (SOL) Rectangle (4H)BINANCE:SOLUSDT appears to be forming a rectangle, clearly visible on the 4H chart.
Key Levels to Watch
• $160: Support
• $185: Resistance
Measured Targets
Activated, respectively, with a 4H close with good volume below support or above resistance.
• $135: Rectangle Short Target
• $210: Rectangle Long Target

"SOL Market Cap Breakdown Setup| Bearish Retest Targeting 83.3B"SOL Market Cap is showing signs of a potential breakdown after a series of lower highs and a bearish retest of previous support. Price is currently retesting the breakdown level. If confirmed, the next support zone is near 83.3B.
This is a technical analysis-based observation, not financial advice. Always manage risk and confirm with your own strategy before making any decisions.

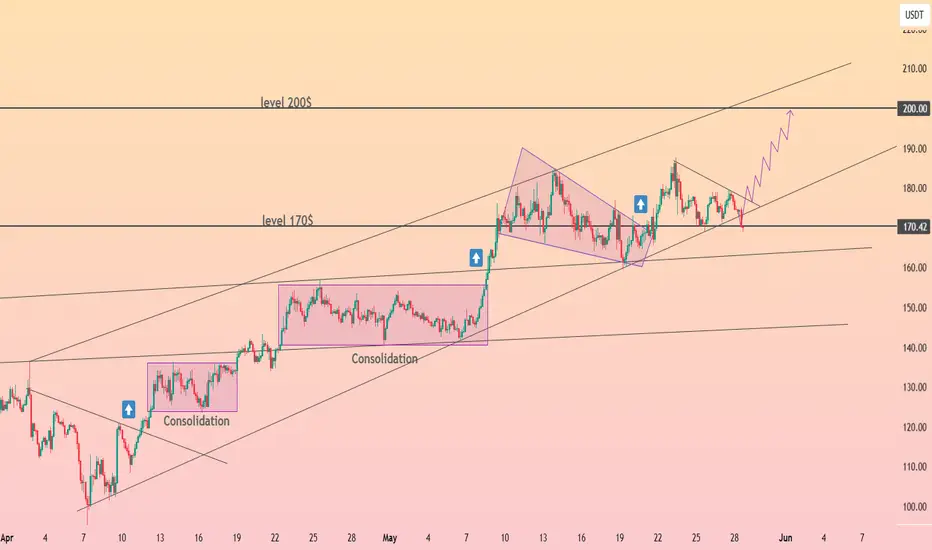
HolderStat┆SOLUSDCRYPTOCAP:SOL price radar: Solana escaped dual consolidations and now oscillates between 170 and 200 inside an ascending channel. Bulls defend trend-line support as a tightening wedge eyes 200. Chart structure and price analysis favor further upside momentum.
Aptus Apt usdt Daily analysis
Time frame daily
Risk rewards ratio >2 👈👌
Target 7.4$
Pattern = two bottom

Solana 8X Lev. Full PREMIUM Trade-Numbers (PP: 1088%)Good morning my fellow Cryptocurrency trader, I wanted to give you one more high profits potential, high probability, high certainty, great entry and timing, leveraged-trade.
The Altcoins market is about to go wild and this chart setup can be a life changer if approached with the right planning and mindset, if approached in the right away.
» SOLANA —SOLUSDT
I'll let you take care of the rest.
Full trade-numbers below:
____
LONG SOLUSDT
Leverage: 8X
Entry levels:
1) $182
2) $175
3) $165
Targets:
1) $195
2) $220
3) $253
4) $296
5) $343
6) $372
7) $420
Stop-loss:
Close weekly below $160
Potential profits: 1088%
Capital allocation: 5%
____
Thank you for reading.
If you enjoy the charts, numbers and content, consider a follow.
Namaste.

HUGE INCREASES Possible on PYT | Here's WhyPython is a fairly new altcoin with big upside.
From the earlier two charts on the left, we see that initial downturns shouldn't be feared. Historically, SOL and SUI started with downtrends and transitioned into massive upside alts.
Python might especially see parabolic increases, once ETH starts to move towards a new ATH. This will be due to the rotation of liquidity between altcoins in terms of larger and smaller market caps.
Don't miss yesterdays update on ETH!
____________________________
BINANCE:SOLUSDT
COINBASE:SUIUSD
BINANCE:PYTHUSDT

PNUT projects to a Dollar.TWO Clear patterns
Double bottom
and a Bull Flag.
Two respective Log Projections for you to consider.
This suggest strong Solana performance is incoming and another round of #Memecoin frenzy.

HolderStat┆SOLUSD channeling the sun toward $200CRYPTOCAP:SOL — After escaping a falling channel, price is tracking a neat growing channel between 170$ pivot and 200$ overhead resistance. Repeated consolidation diamonds reinforce upward trajectory and signal strength. Watch 160-165$ baseline—above it, 195-200$ target remains on radar.

Solana(based on NEowave)I consider this as a triangle but under the price zone which is 139 it tells us its going to make a diamond diametrical.

SOLANA Fractal Solana is currently in a fractal consolidation. Once it double tops it'll drop down one last time to gain momentum and break to 418.

Solana Potential UpsidesHey Traders, in today's trading session we are monitoring SOL/USDT for a buying opportunity around 166 zone, SOL/USDT is trading in an uptrend and currently is in a correction phase in which it is approaching the trend at 166 support and resistance area.
Trade safe, Joe.

Solana | SOL spot TRADE SETUP +65%Firstly, let's look at the SOL chart from a larger view to confirm the agreement for a bullish setup.
What we see above is a clear bullish bottom, followed by a sharp V-Shaped recovery in the daily timeframe.
From here, the ideal entry could be within this zone, either dollar-cost average or just one spot buy:
With the STOP-LOSS around here:
And THREE TP (take profit) points:
1️⃣
2️⃣
3️⃣
Naturally with the timeframe of your HOLD increasing as your target moves higher.
_________________________
BINANCE:SOLUSDT

Solana, Consider The Bigger Picture —$420 Isn't The Final TargetThe day before yesterday, based on session close, 23-May, marks a strong rejection from resistance, a mild resistance I should say but, this doesn't change much or anything when it comes to the bigger picture and what we expect in the coming weeks and months.
Good evening my fellow Cryptocurrency trader, I know it is Saturday night but still, it is fun to work.
When in doubt, zoom out... What happens if there is no doubt?
Well, when there is no doubt, rest easy and buy more. Hold easy and profits will come.
Notice the blue line on the chart. This line marks the low from 19-May. While we had a rejection 23-May there is absolutely no bearish action on this chart. The following day, yesterday, was neutral and we will see what the market does today.
The action is happening pretty high compared to the 19-May low. This low is the main support zone and also the baseline of our rounded bottom. $160. You can say that Solana is truly bullish above this level. If it moves below, nothing happens because this isn't likely to happen but if it happens it simply means a market shakeout or bear-trap is taking place. Why? Because we are bullish now, the bullish bias has been confirmed and we will see growth long-term.
Are you aware that interest rates, by the FED (USA), will be lowered next month? This will be used as the catalyst for the Cryptocurrency market to produce astounding growth. When this event happens, you should be fully invested, "buy like is the end of the world" remember?
That's the situation in which we are now. Prices are still low.
Prices are not low as in trading at $100 or $110. But you will consider them super low when Solana starts trading at $300 or higher.
Here is the thing, when the rise happens it will be so sudden and so strong, that you will be wondering, "why didn't I buy when prices were low?" "Master Ananda told me so many times, so many charts..."
It is not too late. Cryptocurrency is set to grow. Long-term.
Thanks a lot for your continued support.
Namaste.

solusdt will go to towards 320$solusdt BINANCE:SOLUSDT will go towards $320
In the current area, a downward correction to $150.5 is possible, but ultimately the final destination is $320,
Market geometry doesn't lie.
$320 is an index for this symbol.

Got Correction? Solayer Buy Opportunity (PP: ~600%)A correction is not the end. Remember, when prices drop in a bull market this truly becomes a buy opportunity...
Good evening my fellow Cryptocurrency trader, I hope you are having a very nice day.
Here LAYERUSDT went through a strong correction, a fast correction but that does not matter, it is actually good news because prices are back to baseline and low prices means a new opportunity to trade.
Prices are back to the level visited in mid-March and the correction was more than 70% strong. What does this means? This means that the correction is over and there is room for a new wave of growth.
We have a volume breakout and support is found at a higher low.
Keeping it simple, Solayer is ready to grow.
Namaste.

SOL showing strength despite the orange swan event. SOL will either break out or consolidate into a tradable structure. The orange swan event sell-off leading into the weekend is not a good time to enter fresh trades. However, preparing appropriately for what is coming next is a valid strategy.
Full TA: Link in the BIO

HolderStat┆SOLUSD held the support trend lineCRYPTOCAP:SOL sprinted from a falling channel into a sturdy growing channel, staging pauses at 145 and 170. Price now coils inside a descending mini-flag clamped to the 170 horizontal—flip that lid and the 195-200 magnet comes alive, mirroring the flag’s height. Only a decisive close below 160 would dull the current trajectory toward fresh 200-plus highs.

SOLANA - Light it up
SOLANA can flip the $185 resistance into support, it opens the door for a potential rally toward the next key levels:
T1: $241
T2: $301
T3: $371
T4: $468
The structure is clean, and the market sentiment is shifting. As long as SOL holds above the reclaimed range and macro conditions remain supportive, this setup could deliver serious upside.

HolderStat┆SOLUSD retesting the supportCRYPTOCAP:SOL has ridden a well-behaved growth channel since early April. After rejection at 180 USDT, price tests the channel spine around 165, which also marks the April breakout node. Defend it and the upper rail near 195-200 beckons; lose 160 and eyes shift to the lower boundary close to 150.

Give me some energy !!!The SOL will increase $150 and reach to the top of the wedge in the coming weeks .
Give me some energy !!
✨We spend hours finding potential opportunities and writing useful ideas, we would be happy if you support us.
Best regards CobraVanguard.💚

