Solana Price Target: Expert Predicts $180–$200 BreakoutSolana Price Target: Expert Predicts $180–$200 BreakoutSolana (SOL), one of the most prominent blockchain platforms in the cryptocurrency market, has been on a tear recently, with its price rallying significantly. As of today, Solana’s bullish momentum has caught the attention of investors and analysts alike, with many predicting a breakout to the $180–$200 price range. This optimistic outlook comes on the back of strong technical indicators, increasing adoption, and improving fundamentals.
In this article, we’ll explore the key factors driving Solana’s price rally, analyze expert predictions, and assess whether SOL can sustain its upward trajectory to hit the $200 mark.
________________________________________
Solana’s Recent Rally: A Snapshot
Solana has seen a remarkable recovery in recent weeks, with its price climbing steadily after periods of consolidation and minor corrections. The blockchain platform, known for its high-speed transactions and low fees, is once again making waves as it captures investor interest.
Key Highlights of the Rally:
1. Price Momentum: Solana’s price surged by over 30% in the last week, breaking past key resistance levels and positioning itself for further gains.
2. High Trading Volumes: The rally has been accompanied by a significant increase in trading volumes, indicating strong market participation.
3. On-Chain Activity: Solana’s on-chain activity has also spiked, with rising transaction counts and growing usage of decentralized applications (dApps) on its network.
These developments underscore the growing confidence among investors and the sustained demand for Solana’s ecosystem.
________________________________________
What’s Driving Solana’s Price Surge?
The ongoing rally in Solana's price is being fueled by a combination of technical, fundamental, and macroeconomic factors. Let’s take a closer look at these drivers:
1. Strong Technical Indicators
Technical analysis suggests that Solana’s price is in a bullish breakout phase. Analysts have pointed to several key technical patterns that support the prediction of a move toward $200:
• Ascending Triangle Pattern: Solana’s price chart shows an ascending triangle formation, a bullish continuation pattern that typically signals a breakout to higher levels.
• Support and Resistance Levels: SOL recently broke through the $150 resistance level, which had previously acted as a key barrier. With this resistance now flipped into support, the path to $180–$200 becomes more feasible.
• Moving Averages: Solana’s price is trading well above its 50-day and 200-day moving averages, a classic bullish signal that indicates strong upward momentum.
2. Ecosystem Growth
Solana’s ecosystem has been expanding rapidly, with an increasing number of developers and projects choosing its blockchain for their applications. Key areas of growth include:
• DeFi Expansion: Solana has become a hub for decentralized finance (DeFi) projects, with platforms such as Raydium, Serum, and Marinade gaining traction.
• NFT Boom: The Solana blockchain has also emerged as a major player in the non-fungible token (NFT) space, hosting popular marketplaces like Magic Eden and SolSea.
• Gaming and Web3: Solana’s high-speed, low-cost infrastructure makes it an ideal platform for blockchain-based gaming and Web3 applications.
This growing ecosystem contributes to increased demand for SOL tokens, driving up their value.
3. Institutional Interest
Institutional investors have been steadily increasing their exposure to Solana. This trend is evident from the inflows into Solana-based investment products and the growing number of hedge funds and venture capital firms backing Solana projects.
Notably, Solana’s ability to process thousands of transactions per second at a fraction of the cost of Ethereum has made it an attractive alternative for institutional use cases.
4. Favorable Market Conditions
The broader cryptocurrency market has also been in a recovery phase, with Bitcoin, Ethereum, and other major cryptocurrencies rallying. This positive market sentiment has spilled over into Solana, amplifying its price gains.
Additionally, the macroeconomic environment—characterized by easing inflation concerns and renewed interest in risk assets—has created a conducive environment for cryptocurrencies to thrive.
________________________________________
Expert Predictions: $180–$200 Breakout
Several experts and analysts have weighed in on Solana’s price trajectory, with many predicting a move to $180–$200 in the near term. Here are some of the most notable predictions:
Technical Analysts See Bullish Patterns
Prominent cryptocurrency analysts have pointed to bullish technical patterns that suggest Solana could soon reach $200. For instance:
• Ascending Triangle Target: Based on the ascending triangle pattern, the measured move suggests a price target of $190–$200.
• Fibonacci Retracement Levels: Analysts using Fibonacci retracement levels have identified $180 and $200 as key levels of interest.
Institutional Analysts Eye $200
Institutional analysts have also expressed optimism about Solana’s price potential. A recent report by a leading investment firm highlighted the following factors supporting a $200 price target:
• Increasing adoption in the DeFi and NFT sectors.
• Strong developer activity on the Solana blockchain.
• Growing institutional inflows into Solana-based products.
Community Sentiment
The Solana community remains highly bullish, with many investors and enthusiasts sharing optimistic price targets on social media platforms. This positive sentiment often serves as a self-reinforcing mechanism, attracting more buyers and driving up the price.
________________________________________
Challenges and Risks
While the outlook for Solana appears promising, it’s important to consider the potential challenges and risks that could impact its price trajectory:
1. Competition from Ethereum and Layer-2 Solutions
Ethereum’s transition to Proof of Stake (PoS) and the rise of Layer-2 scaling solutions like Arbitrum and Optimism could pose challenges to Solana’s market share. These competitors are addressing scalability issues, reducing the competitive advantage that Solana has traditionally enjoyed.
2. Network Outages
Solana has faced criticism for network outages in the past, which have raised concerns about its reliability. Any future outages could undermine investor confidence and slow adoption.
3. Regulatory Uncertainty
The cryptocurrency market remains highly sensitive to regulatory developments. Unfavorable regulations targeting DeFi, NFTs, or blockchain technology could negatively impact Solana and the broader market.
4. Market Volatility
Cryptocurrencies are inherently volatile, and Solana is no exception. While the current rally is encouraging, sharp corrections are always a possibility, particularly if external factors such as macroeconomic events or market sentiment shift.
________________________________________
Can Solana Sustain Its Momentum?
For Solana to sustain its momentum and achieve the $200 price target, several factors need to align:
• Continued Ecosystem Growth: Solana must maintain its position as a leading platform for DeFi, NFTs, and Web3 applications. This requires ongoing innovation and developer support.
• Institutional Adoption: Increased participation from institutional investors will be critical to sustaining demand for SOL tokens.
• Positive Market Sentiment: The broader cryptocurrency market needs to remain in a bullish phase, providing a favorable backdrop for Solana’s price growth.
• Resolving Network Issues: Addressing concerns about network reliability and scalability will be key to maintaining investor confidence.
________________________________________
Conclusion
Solana’s recent rally and the expert predictions of a $180–$200 breakout highlight the growing confidence in its ecosystem and price potential. Driven by strong technical indicators, ecosystem expansion, institutional interest, and favorable market conditions, Solana appears well-positioned for further gains.
However, challenges such as competition, network reliability, regulatory risks, and market volatility remain. Investors should approach Solana with cautious optimism, balancing the bullish outlook with an awareness of the risks involved.
As Solana continues its upward trajectory, the $200 milestone could mark a significant achievement for the blockchain platform, solidifying its status as one of the leading players in the cryptocurrency space. Whether this rally leads to sustained growth or faces temporary setbacks, one thing is clear: Solana’s growing ecosystem and innovative technology make it a force to be reckoned with in the world of blockchain and decentralized applications.
Solana

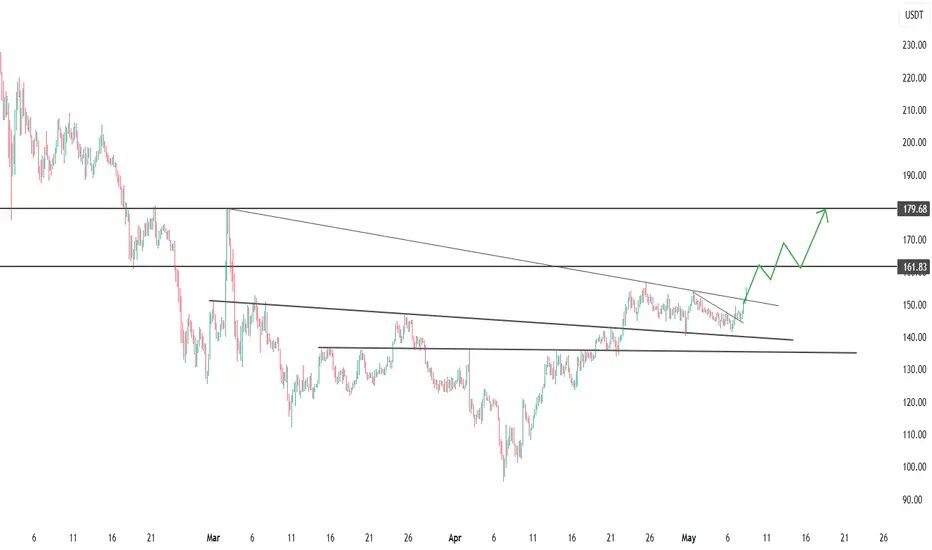
SOL broke through the resistance line near $150CRYPTOCAP:SOL - wedge broken, bulls take control
Price broke out of the descending wedge (140-150 → 150-162) and closed above 150 USDT on higher volume - a break of the medium-term trend.
📌 Levels
- S1 150 ± 3 - retest zone, S2 140 - April base.
- R1 161.8 - March resistance, R2 179-180 - wedge height and supply zone target.
📈 Scenario
A consolidation > 161.8 activates a move to 180; if successful, a push to 195 is possible.
⚠️ Risks
Failure < 147 will bring price back inside the wedge with a chance of 140.
As long as 147-150 holds, priority long.
Solana SOL price analysisToday, a press release was published that CRYPTOCAP:SOL Strategies (aka MicroStrategy from the world of #Solana) bought another 122,524 CRYPTOCAP:SOL at $149
Earlier, the company said it would sell $500mn in convertible bonds, to buy #Solana, which capitalized now is at $74bn
Well, if you look at the OKX:SOLUSDT chart, we can say that it would be good to keep the price above $107-115, above the trendline, which has been going on since the beginning of 2023.
Once this condition is met, we can start dreaming again about the start of a super march of the #SOLUSD price to $790 in 2025.
_____________________
Did you like our analysis? Leave a comment, like, and follow to get more

Phemex Analysis #78: Pro Tips for Trading SOLANA (SOL)Solana ( PHEMEX:SOLUSDT.P ) is known for its high throughput and fast transaction speeds, making it a popular choice for various decentralized applications (dApps) and traders. Large crypto-native funds are actively bidding for bulk SOL positions, betting on eventual U.S. spot-ETF approval. This analysis will outline potential trading scenarios for SOL, keeping in mind the volatility inherent in the cryptocurrency market and the interest from large crypto funds.
Possible Scenarios
1. Uptrend
If Solana demonstrates strong buying pressure, high volume, and positive news or developments, including potential U.S. spot-ETF approval, it could establish and maintain an uptrend. The interest from large crypto-native funds suggests significant capital inflows could drive prices higher in this scenario.
Pro Tips:
Identify key resistance levels, such as $157. A breakout above these levels, accompanied by increased volume, could signal a continuation of the uptrend.
Consider entering long positions on the breakouts, with stop-loss orders placed below recent swing lows to manage risk.
Short term profit targets are $179, $205 & $241.
2. Consolidation
Solana's price may enter a consolidation phase, characterized by sideways movement within a defined range. This could occur after a significant uptrend or downtrend, or as the market awaits further clarity on factors such as regulatory developments or ETF approval.
Pro Tips:
Identify the upper and lower boundaries of the consolidation range, such as $157 (upper) and $133 (lower).
Be patient and wait for a clear breakout or breakdown from the range before taking a position.
Consider range-bound trading strategies, such as buying near support and selling near resistance, but manage risk carefully.
3. Downtrend
Solana's price could decline due to various factors, including negative news, market-wide sell-offs, or a decrease in demand. However, the presence of large funds accumulating SOL may provide a degree of support during downturns.
Pro Tips:
Identify key support levels, such as $140 & $133. A break below these levels could signal further downside.
Consider exiting long positions or tightening stop-loss orders if the price breaks below important support.
For experienced traders, short-selling opportunities may arise during a downtrend, but this carries higher risk.
Conclusion
Solana presents both opportunities and risks for traders. Its high throughput and fast transaction speeds, combined with the interest from large crypto-native funds anticipating potential ETF approval, suggest the potential for significant price appreciation. However, like all cryptocurrencies, Solana is subject to market volatility and regulatory uncertainty. Traders should employ a combination of technical and fundamental analysis, practice sound risk management, and stay informed about market developments to make informed trading decisions. The potential for a U.S. spot-ETF adds a layer of complexity and opportunity, requiring traders to closely monitor regulatory news and fund flows.
Pro Tips:
Trade Smarter, Not Harder with Phemex. Benefit from cutting-edge features like multiple watchlists, basket orders, and real-time strategy adjustments. Our unique scaled order system and iceberg order functionality give you a competitive edge.
Disclaimer: This is NOT financial or investment advice. Please conduct your own research (DYOR). Phemex is not responsible, directly or indirectly, for any damage or loss incurred or claimed to be caused by or in association with the use of or reliance on any content, goods, or services mentioned in this article.

Solana Daily Outlook | Key Levels & Market Momentum👀 Welcome to my Trading View Analysis and Trading Channel Here , we share the latest market analysis, trading signals, and key insights together .
Ready for smarter trades ? ⭐️
⚡️Today , we're going to analyze the SOL( Solana ) coin together on the daily timeframe and find triggers for our positions .
💠 🔍Daily Technical Overview
Solana (SOL) recently broke out of its descending trendline on the daily chart, leading to an impressive 30% price surge. This breakout marked a key shift in market sentiment and highlighted a fresh wave of buyer interest.
Currently, SOL is moving through a distribution phase, where price consolidates and profit-taking occurs. All eyes are on the $152.55 resistance level – a breakout above this zone, backed by solid volume, would present a strong long entry opportunity.
📊 🧠 Fundamental Insights
Solana isn’t just showing strength technically – the fundamentals are also aligning for a bullish outlook:
✅ After a 65% correction, buyers are returning to accumulate at discounted levels.
✅ Ecosystem growth continues, with strong developer activity and use case expansion.
✅ Trading volume is on the rise, supporting the price recovery.
📰 🔥 This Week’s Positive Solana News
Here are the major developments from the past week that are giving Solana a strong boost:
📈 Price Forecast: Analysts now project that SOL could reach $155–$160 by the end of May, with potential upside toward $180 in the near term.
🏦 Institutional Investment: Upexi Inc. has announced plans to allocate $100 million toward purchasing Solana tokens — a major show of confidence.
📊 ETF Filing: Franklin Templeton has filed for a Solana-based ETF to track SOL’s price, which could open the door for more mainstream investment.
🇺🇸 US Government Involvement: Reports suggest the U.S. government is considering Solana as part of its strategic digital asset reserve, highlighting its growing legitimacy.
📝 Conclusion
🚀 Trendline breakout = bullish confirmation
📌 Consolidation = distribution zone
📊 Break above $152.55 = long setup
📉 Previous 65% correction = attractive accumulation zone
📰 Positive news flow = fundamental support for continued growth
I love you all so much . 👀
don't forget about capital management and risk management .
Be careful with your positions . 🥇

AI Prediction SOL/USD Trading Plan 24 hours!💰 May 4, 2025 8:52 pm. SOL/USD Trading Plan
Long Scenario
- Entry: Breakout above 148.50 (volume >8,000).
- Stop-Loss (SL): 145.50 (below support).
- Take-Profit (TP): 149.50 (below resistance).
- Trailing Stop: 1.5x ATR ($0.77).
- Confirmation: Supertrend (long), MACD bullish crossover, RSI >50.
Short Scenario
- Entry: Breakdown below 146.50 (volume >12,000).
- SL: 147.50 (above resistance).
- TP: 145.50 (above support).
- Trailing Stop: 1x ATR ($0.51).
- Confirmation: Supertrend flips short, MACD bearish, CMF <0.

SOLUSDT Reversal Brewing — Watch This Level or Get Wrecked!Yello Paradisers — Are you paying attention to #SOLUSDT? Because what’s forming right now isn’t just noise — it’s a high-probability reversal setup that could trap the late bulls or become the kind of move that sets the tone for the next few weeks. Either way, the next play is going to separate professionals from gamblers. Let’s talk.
💎#SOLUSDT has been printing textbook bearish price action for weeks — lower lows and lower highs on the major time frame. But something critical has just changed. A break in market structure has occurred, and we’ve now got a higher high. That’s your first probable signal that the tide may be turning. Now comes the most important test — can we form the higher low to confirm this shift?
💎What makes this setup even more interesting is that we’re not just seeing a random bounce. SOL is in the middle of potentially probable completing two major bullish reversal patterns — an inverse head and shoulders and a Quasimodo. The left shoulder and neckline are already locked in. The right shoulder? Still cooking. But here’s the thing — the previous resistance, which aligns perfectly with where the right shoulder could form, is lining up as a textbook retest zone. That means we could get the higher low right there, completing both patterns at once.
💎Right now, price is struggling against multi-timeframe resistance, and that’s exactly what we want. It increases the probability of a short-term pullback to the key zone — around 110.9 to 115 — before the real breakout happens. If that level holds, and we print a confirmed higher low, this whole setup becomes explosive.
💎First area of resistance sits at 153, but that’s just the appetizer. The main zone we’re looking at is 173 to 181. That’s the bigger move that this structure is potentially building toward. But let’s be clear — if SOLUSDT closes a candle below 110.9, the entire setup gets invalidated. That level is your line in the sand.
This is the kind of setup we live for — clean structure, clear invalidation, and serious upside potential. But don’t rush it. The market will reward the ones who wait, not those who chase. Let others panic. Let others fomo. You focus on execution.
Trade smart, Paradisers — and always remember, only a few will catch the real move. Be one of them.
MyCryptoParadise
iFeel the success🌴

Opened liquidity pool for SOLUSDC💰Opened a SOL/USDC liquidity pool
1% range with approximately $300
I want to create detailed statistics and understand how well it performs within narrow ranges.

SOL/USD AI Prediction!Apr 29, 2025 SOL/USD Trading Strategy
I use an AI-powered prediction tool to make daily crypto price forecasts — and I fully analyze the results! 📊
My goal? To develop a consistently profitable intraday trading strategy, month after month. 📈
Follow along to see real data, honest results, and how AI can transform short-term crypto trading! 🚀
Long Scenario
- Entry: 147.50 (confirmed if price holds above Supertrend 147.04 + MACD bullish).
- Stop-Loss: 146.50 (below Supertrend support).
- Take-Profit: 149.80 (near 150 resistance) & 152.50 (below 153 peak).
- Trailing Stop: 1.5x ATR (1.15 points) after breaching 149.
Short Scenario
- Entry: 146.50 (confirmed if price breaks Supertrend 147.04 + MACD bearish crossover).
- Stop-Loss: 147.50 (above Supertrend flip level).
- Take-Profit: 145.30 (below 145.45 panic low) & 139.80 (near 140 target).
- Trailing Stop: 1.5x ATR (1.15 points) after breaking 145.
Re-Evaluate Forecast If:
1. Price closes above 150 (bullish invalidation) or below 145 (bearish acceleration).
2. RSI crosses 70 (overbought) or drops below 40 (bearish momentum).
3. Supertrend flips direction or volume exceeds 20,000.
Confirmation Tools: Supertrend, MACD crossover, RSI trend.
Risk Note: Avoid overbought/oversold traps; adjust stops away from S/R. Disclaimer: This is not financial advice. Crypto markets are highly volatile and speculative. Always do your own research and consult a qualified financial advisor before investing. You could lose your entire investment.

Solana vs Ethereum – A Meme War or Market Shift?🔥⚔️ Solana vs Ethereum – A Meme War or Market Shift? 🧠📉
It’s getting spicy out here in the crypto arena... and the memes are hitting just as hard as the market caps! 💥
Over the weekend, Solana briefly flipped Ethereum in total staking value — triggering a fiery debate on whether that’s bullish or bearish for SOL. Some celebrated the milestone 🥂, while others, especially from the ETH camp, argued it reveals a deeper problem: Solana’s staking isn't really staking (as slashing isn’t automatic, and network restarts are still a thing). 🛑🔧
📸 Bonus Meme: Apparently Ethereum’s new logo is now Internet Explorer 😂 — can’t say the UX didn’t earn it.
🧠 The FXProfessor’s Technical Take: Let’s cut through the noise.
📉 SOLETH (Solana vs Ethereum Ratio)
Rejected at grand resistance: 0.088
Projected drop: -28% to 0.063
Structure: Bearish inside an ascending channel (highlighted in orange)
📊 ETHUSD
Support: $1,530
Rebound potential: $1,650 and beyond
Long-term structure still forming — this could be a spring.
📈 SOLUSD
Key support: $114
If that breaks higher, next test is $179, then $215
But failure at this level opens room for downside re-test near $80
💬 So where do we stand? On chart structure alone, Solana might still outperform ETH short-term — but technically, SOLETH suggests a correction is due.
🧑🏫 Yes, I’m emotionally attached to Ethereum — I have build on it, invested in it, got smashed on it for months..pain, at least for now. But I trade what I see (or at least i try damn it!)
Let the memes roll, but let the charts speak. Drop your thoughts — SOL or ETH? 👇
One Love,
The FXPROFESSOR 💙

Going long on SolanaBINANCE:SOLUSDT
Solana has experienced climatic volume to the downside, bullish RSI divergence, and now it seems ready for a big bounce. Also, there is a Hammer candlestick at the bottom of the decline.
Good luck to you

BTC - Inversion Play at Resistance With IFVG Breakdown PotentialPrice has tapped into a previously established resistance zone and is now showing signs of exhaustion. A reactive short setup is in play, contingent on further bearish confirmation.
---
1. Resistance Zone — Key Supply Area
The marked red zone above highlights:
- Repeated Rejections: Price has failed multiple times to break and hold above this level.
- Order Block & Liquidity: Likely an area where institutional selling interest remains.
This zone offers a prime location for short setups, especially if price fails to hold above it and begins to roll over.
---
2. IFVG Inversion — Breaker-Type Setup
We are watching for:
- Inversion of a Bullish IFVG: A common signal of shifting order flow.
- Breaker Behavior: A previously supportive zone now acting as resistance — a hallmark of smart money reversals.
This structure suggests an intent to trap late longs and transition into lower pricing.
---
3. Internal Liquidity Sweep — Fuel for the Drop
The local high served to:
- Clear Short-Term Liquidity: Wick just above resistance suggests engineered breakout bait.
- Trigger Buyer Commitment: Which could now get trapped if momentum fails.
This liquidity event sets up the conditions for a more sustained push downward.
---
4. Downside Targeting the Discount Zone
Price is projected to revisit the blue discount zone:
- 0.618–0.65 Retracement Levels: Classic Fibonacci discount area often targeted after a premium rejection.
- Reaccumulation Potential: Watch for signs of buyer interest returning here.
This forms the logical destination for price following a confirmed rejection.
---
5. Summary:
- Price Rejecting Resistance & IFVG Inversion Signals Reversal Bias
- Liquidity Sweep Confirms Trap Setup
- Discount Zone Below Offers High-Probability Reaction Area
A strong short scenario may unfold if bearish order flow confirms beneath the resistance region.

SOLUSDT - Quadruple Bottom SupportVery solid support line in green horizontal
This has been tested at least 4 or more times on this daily timeframe
Very bullish for Solana

Geospatial Technology: A Catalyst for Modern InnovationBeyond Earth-based uses, geospatial tools are now integral to advancements in autonomous vehicles, drone technology, and even space exploration. As data becomes increasingly abundant, the ability to tie that data to a physical location adds powerful context that static information cannot provide.
Geospatial technology enhances safety, efficiency, and scalability. It enables vehicles and systems to operate with spatial awareness, supports AI-driven decision-making, and ultimately helps automate logistics in a reliable and responsive way.
FedEx has recently emphasized its commitment to integrating autonomous technologies to enhance logistics efficiency and resilience. These initiatives aim to streamline operations and reduce costs, contributing to a $6 billion reduction in the company's cost base over three years. XYO happens to be a partner at the FedEx institute of tech.
XYO is also rumored to be integrated with Tesla vehicles -- just like with Bitcoin mining. The hope is to use the XYO blockchain to address location spoofing issues where validity of data and safety is paramount. This goes in hand with Tesla's goals to make your care work for you. In fact, the goal for XYO is to pay users for creating and validating data.
Key Developments in the Past 12 Months:
1. Launch of XYO Layer One and Dual-Token Economy
2. Expansion to Solana
3. Introduction of the XYO Platform Node
4. Gamification and User Engagement
5. Developer Resources and Community Building
XYO launched the "Build the Future" initiative, aimed at fostering a robust developer community. This program provides resources, documentation, and incentives for developers to build applications and tools on the XYO network.
Looking ahead, XYO plans to continue enhancing its Layer-1 blockchain capabilities, expanding interoperability with other blockchain networks, and introducing more user-centric applications. The focus remains on building a decentralized, user-owned geospatial data network that empowers individuals and developers alike. A network-effect-like-potential for this technology is worth paying attention to.
From a military standpoint, geospatial technology is critical because it provides the foundation for situational awareness, precision, and operational dominance in modern warfare:
GPS and satellite imagery
Real-time geospatial intelligence (GEOINT) ensures that moving or hidden targets can be tracked and re-verified before engagement.
Terrain analysis
Topographic and environmental data
Autonomous surveillance drones need GPS and HD geospatial mapping to patrol borders or conflict zones.
Logistics bots and unmanned vehicles rely on route optimization for resupply missions under fire or in denied environments.
Geospatial analytics can identify unusual patterns (e.g., IED placements, enemy camps) from satellite data.
Geofencing can alert personnel when enemies or drones breach a protected area.
Before any mission, simulations and war games based on real-world geospatial data improve planning and reduce risks.

MEGA MEGA MEGAPHONE - Insane Upside for Solana SOLUSD SOLUSDTMassive Megaphone setup identified.
Testing double resistance zone...if pass:
Target $420-800, in fast and short lived spike.
Target $1300-1500, in slow and steady...
Looks like either $2T Injection or/and Rate Cuts priced in and about to be announced.
The information and publications are not meant to be, and do not constitute, financial, investment, trading, or other types of advice or recommendations

SOL/USDT – 3D Long Signal Active📅 April 29, 2025
The system triggered a long entry at the last 3D bar close.
Currently, the price remains around the same levels.
✅ System conditions for a long are fully met:
MLR > SMA > BB Center > PSAR
Price is trading above the 200 MA on the 3D timeframe.
⚠️ Caution:
On the 1D timeframe, price is still below the 200 MA, which suggests some lingering weakness. Proceed carefully.
📍 Strategy Plan:
Consider entering long at today’s daily close or at the next 3D bar close.
Suggested stop-loss: below the latest PSAR dot for system integrity.
🔔 Keep an eye on updates and thank you for reading! 📈📊

SOLANA's massive 1W MA200 rebound hints to enormous rally ahead.Solana (SOLUSD) made a very strong rebound on its 1W MA200 (orange trend-line) on the very first week of April. Now that the month is about to close, it has already completed three straight green 1W candles and is aiming for the critical 1W MA50 (blue trend-line) test.
If broken, we expect it to turn into a long-term Support again and target the Higher Highs of the Wedge at $350. After all, the 1W MA200 rebound also made contact on the 2-year Higher Lows trend-line of the Bull Cycle, so technically it is a massive Bottom cluster. The 1W RSI also broke above its MA last week, confirmed the buying pressure.
Given that the recent 3-month correction was -67.23%, identical to the last correction (May 2021) of the previous Cycle, we expect one final rally to the 2.0 Fibonacci extension at $900, if the Higher Highs trend-line breaks.
-------------------------------------------------------------------------------
** Please LIKE 👍, FOLLOW ✅, SHARE 🙌 and COMMENT ✍ if you enjoy this idea! Also share your ideas and charts in the comments section below! This is best way to keep it relevant, support us, keep the content here free and allow the idea to reach as many people as possible. **
-------------------------------------------------------------------------------
💸💸💸💸💸💸
👇 👇 👇 👇 👇 👇

Solana Classic Signals (5 Total) & Bullish ConfirmationIt is the first time that Solana moves back above EMA55 after producing a major low since late 2024. Naturally, when this event happened back in late 2024 what followed was a bullish impulse. This is always the case as this is a confirmed classic bullish signal.
Solana is trading daily above EMA55 and this confirms mid-term growth potential.
The low happened 7-April and produced the highest buy volume in more than a year, since March 2024.
The difference is that March 2024 was a peak while April 2025 was a bottom. The volume signal is another classic.
The RSI is really strong with a reading reaching ~60.
The MACD is on the bullish zone now, it has been trading in this zone since 19-April.
There is a broken downtrend line (black) and this is another classic.
We have a total of five classic signals and we used these one hundred trillion times in the past few years to predict how the market would behave next. The list goes as follows:
» Moving averages
» Volume indicator
» Oscillators (MACD & RSI)
» Chart patterns
» Trendlines
Another one that we use very often is candlestick reading. Even if it is not mentioned in the analysis, it is always there. The bottom is confirmed with a reversal candlestick pattern.
» These are some of the classic signals, all bullish. Bullish means up. Solana is going up.
Thank you for reading.
Namaste.

Sei's Downtrend Has Been Broken —Bull Market Cycle & ProfitsSei's downtrend has been broken, prepare for bullish momentum to build up as SEIUSDT moves toward higher prices. A long-term higher high first followed by a very strong new All-Time High in late 2025. Are you ready?
The downtrend line is shown on the chart. It broke around April 19 and the action has been green since.
We have a perfect bottom pattern and the action is happening safely above the 3-Feb. low.
This is a solid chart setup and reveals that the type of action the market will present consist of straight up, literally. Notice the correction, it has a perfect decline. The same will be true for the rise, you will be able to draw a perfect line for the higher lows as prices rise. The higher highs can become erratic but the base will be stable. There will be huge growth. Current action reveals this clearly.
» The first target has 420% profits potential and the second one 700%. These are strong targets yet easy to achieve. Total growth would be much higher if you start counting from the 7-April low but it is too late for bottom prices now. It is still early though based on the broader picture and market cycle.
It is late for the true bottom, but it is early for huge profits. Understand what I mean?
It is normal not being around when the market hits bottom because the fact that the market is trading at bottom prices means that it is depressed. Nobody wants to be around depressed energy so people go away. But this energy doesn't last forever, it never does things change.
Everything is changing now and instead of a depressed market we will have a growing market, euphoria, fun, excitement and profits. Money is yours to take.
You can make as much as you want, the market will never limit you in any way.
It all depends on your mindset and preparation, how much money are you ready to take home in this Cryptocurrency market bullish phase?
You have my support.
Thank you for reading.
Namaste.

BTC Potential Breakout, Daily DivergenceBTC on the daily has the opportunity to expand way upwards over the next month - a divergence on the daily evidently takes longer to play out but RSI could easily reach 80 off the back of the structure.
I have been shorting, confidently, for a good few weeks now, with longs in between, but I'm starting to feel like I should flip long.
Solana is also trying to reclaim the daily/weekly range - things to think about for sure.
Good luck out there!

Solana to hit $180?SOL starts the week with bullish momentum from local support around $147. Reclaiming local highs or a solid candle above $155 could signal a push towards $179 or 1D 200MA around $181.
A close below $147 could signal short term weakness.

$SPX Sell in May, Go Away, $5k, Dead Cat to $5.3k, $4.8k by EOMAlrighty. My forecast is as follows. I made a video explaining just a quick thought and here's the video in a written version for the most part. Basically, I'm a pattern chart trader and I spend the majority of my days looking for specific candlestick patterns that match candle for candle. I cannot find anything remotely close to today's Price Action besides October 2001. I have been and will continue to be doubted and that's okay. I am not here for anyone except myself and anyone that wants to gain a fresh unbiased perspective. People have called me a Permabear but that only pertains to my personality, which is that of a realist. I do not believe investing for the next 20-50 Years will work for everyone. You'd have to do it well and continuously contribute even during the down days. Either way. This is the analog I will be following. Fib is Extended way beyond Blow Off Top measurements imo. The market gained 50% in One Year and Three Months. I'd like to think that the uncertainty being priced in will cause these Deeper Fib Retracements. We already crashed down to the 1.61 GOLDEN POCKET from above and now bounce back to Secon Golden Pocket at 2.61. Based on the past behavior, now we move back to 2.0 for a move to the original extension of the 1.00 Fib. If we lose this, we start moving back to the 1.27 near $4.74k on SPX where I will then be looking for one final dead cat to $5300 by mid August, Every July dip being grabbed up ... Final Sell in August for an End of Year Crash to Mark 2025 as one of the worst years ever in Life as far as the Market goes. Good Luck everyone. Tips always welcome.

Breaks Out of Red Resistance Zone 🚨 NASDAQ:RAY
Breaks Out of Red Resistance Zone 🚨
NASDAQ:RAY
has successfully broken out of the red resistance zone, which was part of a symmetrical pattern. This breakout could signal a strong bullish move.
📈 Technical Overview:
Pattern: Symmetrical
Breakout Level: Red resistance zone.
🎯 Potential Targets: To be determined upon further price action.
